Download as PDF, PPTX


![Bibliography :
● Bruggen Blog. Using Neo4j to Manage and Calculate Hierarchies. Available:
http://blog.bruggen.com/2014/03/using-neo4j-to-manage-and-calculate.html [September 2017]
● Product lifecycle management. PLM models. Available:
http://www.product-lifecycle-management.info/plm-elements/plm-models.html [September 2017]
● Beyond PLM. PLM graph-aware architecture and search for data. Available
http://beyondplm.com/2017/05/10/plm-graph-aware-architecture-search-relevant-data/
[September 2017]
● PLM Book. What is the right data model for PLM. Available
http://plmbook.com/what-is-right-data-model-for-plm/
Images:
● Istock
● Data visualization icon by Creative Outlet from the Noun Project
● Browser Analytics icon by Oliviu Stoian from the Noun Project
Sources and links](https://image.slidesharecdn.com/slidesharewebinar15-plm-171002091638/85/Graph-based-Product-Lifecycle-Management-21-320.jpg)

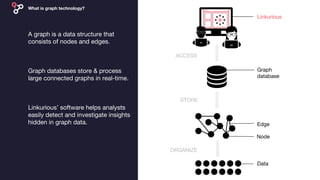
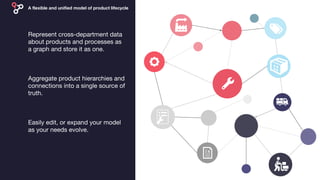
Linkurious, founded in 2013 in Paris, is a graph-based product lifecycle management startup that helps clients like NASA and Cisco visualize and analyze complex data using graph technology. Their software enables efficient detection and investigation of insights from interconnected data, addressing challenges in various sectors such as cybersecurity, IT operations, and life sciences. By leveraging graph databases, Linkurious enhances productivity and decision-making throughout product lifecycles, while overcoming limitations of traditional relational database management systems.


![[DSC Europe 25] Slobodan Dolinic - Smart and Intelligent Green Region.pptx](https://cdn.slidesharecdn.com/ss_thumbnails/0bribinjsp6ghwtvsvor-2-sigre-slobodan-dolinic-260115093812-c9c10e90-thumbnail.jpg?width=640&height=640&fit=bounds)


