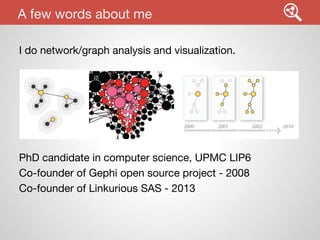
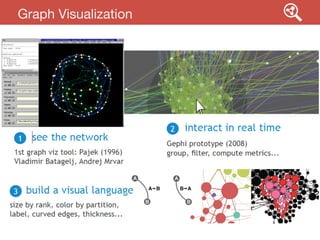
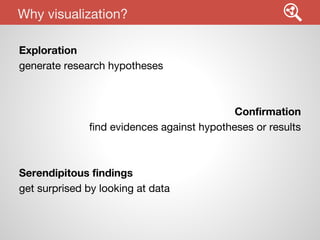
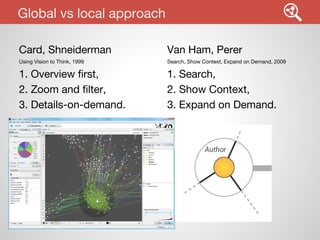
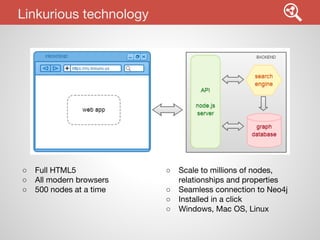
Navigating large graphs like a breeze
with Linkurious
by Sébastien Heymann

http://linkurio.us | @linkurious
A few words about me
I do network/graph analysis and visualization.

PhD candidate in computer science, UPMC LIP6
Co-founder of Gephi open source project - 2008
Co-founder of Linkurious SAS - 2013
Graph Visualization
Why visualization?

“The greatest value of a picture
is when it forces us to notice
what we never expected to see”
John Tukey (1962)
Why visualization?
Exploration
generate research hypotheses

Confirmation
find evidences against hypotheses or results

Serendipitous findings
get surprised by looking at data
The “beautiful-but-unreadable” issue
Global vs local approach
Card, Shneiderman

Van Ham, Perer

Using Vision to Think, 1999

Search, Show Context, Expand on Demand, 2009

1. Overview first,
2. Zoom and filter,
3. Details-on-demand.

1. Search,
2. Show Context,
3. Expand on Demand.
Global vs local approach
Card, Shneiderman

Van Ham, Perer

Using Vision to Think, 1999

2009

1. Overview first,
2. Zoom and filter,
3. Details-on-demand.

1. Search,
2. Show Context,
3. Expand on Demand.
Linkurious SAS
Started by a collaboration with Stanford - Mapping the
Republic of Letters and DensityDesign in 2012.
Linkurious solves this problem:

How to easily store, search and visualize your graphs using
Neo4j graph database and a web browser?
We help:

data analysts, R&D teams, developers and business
people
The Linkurious team
Jean

Sébastien

Romain

CMO

CEO

CTO

Consulting industry

Gephi co-founder

Master:

Master:

PhD:

Computer Science /
Machine Learning

Political Science /
Competitive Intelligence

Computer Science /
Complex Networks
Live demo - bibliographic dataset
30k nodes, 460k relationships
Everything published in Elsevier Scopus & ISI WoS for the
search term "project management" in 2012
Multipartite, multiplex graph of publications, authors and
stemmed abstract words (using Sci2 tool)
Work in progress with Julien Pollack & Daniel Adler,
University of Technology Sydney, project Mapping the
Field of Project Management.
Who writes with whom, and about what: a scientometric analysis of project management research, IRNOP 2013, Oslo
Conclusion
Linkurious SAS: French company, 3 guys, +60 customers
(startups, big companies, researchers, developers)
Product development driven by user feedback
Main value proposition
navigate in graph data easily
How we can help you:
- research & development partnership
- setting up graph data portals on the Web
Merci ! (thanks)

More info and live demo at
http://linkurio.us

contact@linkurio.us
Linkurious technology

○
○
○

Full HTML5
All modern browsers
500 nodes at a time

○
○
○
○

Scale to millions of nodes,
relationships and properties
Seamless connection to Neo4j
Installed in a click
Windows, Mac OS, Linux

Navigating large graphs like a breeze with Linkurious

  • 1.
    Navigating large graphslike a breeze with Linkurious by Sébastien Heymann http://linkurio.us | @linkurious
  • 2.
    A few wordsabout me I do network/graph analysis and visualization. PhD candidate in computer science, UPMC LIP6 Co-founder of Gephi open source project - 2008 Co-founder of Linkurious SAS - 2013
  • 3.
  • 4.
    Why visualization? “The greatestvalue of a picture is when it forces us to notice what we never expected to see” John Tukey (1962)
  • 5.
    Why visualization? Exploration generate researchhypotheses Confirmation find evidences against hypotheses or results Serendipitous findings get surprised by looking at data
  • 6.
  • 7.
    Global vs localapproach Card, Shneiderman Van Ham, Perer Using Vision to Think, 1999 Search, Show Context, Expand on Demand, 2009 1. Overview first, 2. Zoom and filter, 3. Details-on-demand. 1. Search, 2. Show Context, 3. Expand on Demand.
  • 8.
    Global vs localapproach Card, Shneiderman Van Ham, Perer Using Vision to Think, 1999 2009 1. Overview first, 2. Zoom and filter, 3. Details-on-demand. 1. Search, 2. Show Context, 3. Expand on Demand.
  • 9.
    Linkurious SAS Started bya collaboration with Stanford - Mapping the Republic of Letters and DensityDesign in 2012. Linkurious solves this problem: How to easily store, search and visualize your graphs using Neo4j graph database and a web browser? We help: data analysts, R&D teams, developers and business people
  • 10.
    The Linkurious team Jean Sébastien Romain CMO CEO CTO Consultingindustry Gephi co-founder Master: Master: PhD: Computer Science / Machine Learning Political Science / Competitive Intelligence Computer Science / Complex Networks
  • 11.
    Live demo -bibliographic dataset 30k nodes, 460k relationships Everything published in Elsevier Scopus & ISI WoS for the search term "project management" in 2012 Multipartite, multiplex graph of publications, authors and stemmed abstract words (using Sci2 tool) Work in progress with Julien Pollack & Daniel Adler, University of Technology Sydney, project Mapping the Field of Project Management. Who writes with whom, and about what: a scientometric analysis of project management research, IRNOP 2013, Oslo
  • 12.
    Conclusion Linkurious SAS: Frenchcompany, 3 guys, +60 customers (startups, big companies, researchers, developers) Product development driven by user feedback Main value proposition navigate in graph data easily How we can help you: - research & development partnership - setting up graph data portals on the Web
  • 13.
    Merci ! (thanks) Moreinfo and live demo at http://linkurio.us contact@linkurio.us
  • 14.
    Linkurious technology ○ ○ ○ Full HTML5 Allmodern browsers 500 nodes at a time ○ ○ ○ ○ Scale to millions of nodes, relationships and properties Seamless connection to Neo4j Installed in a click Windows, Mac OS, Linux