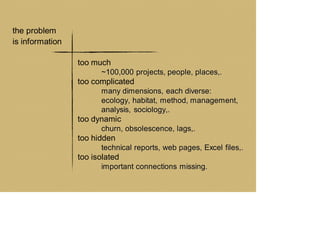
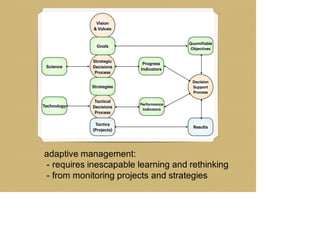
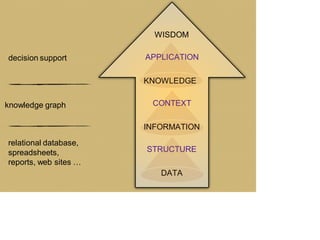
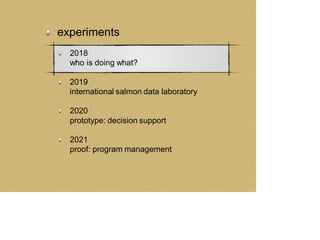
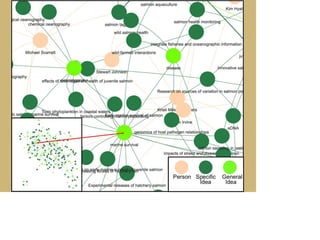
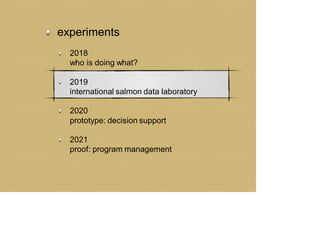
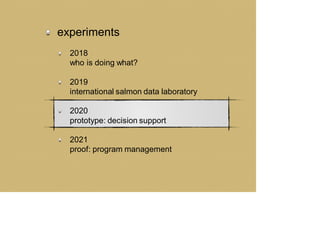
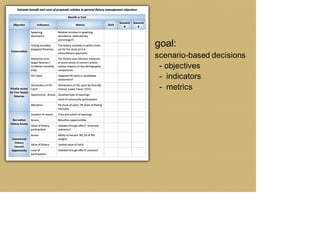
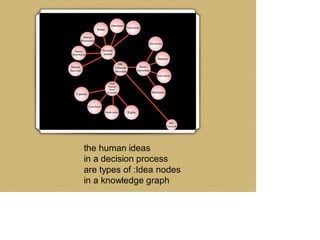
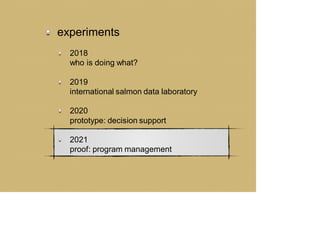
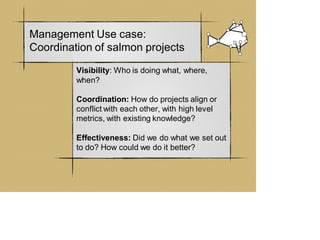
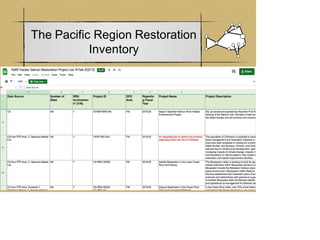
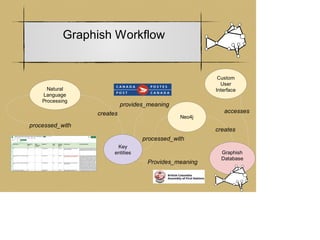
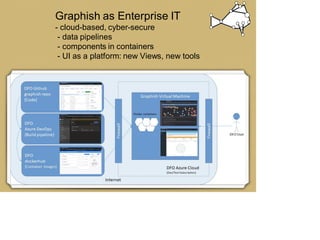
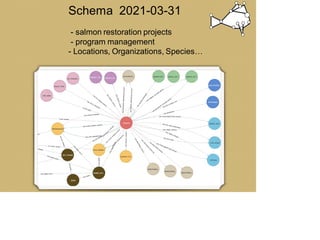
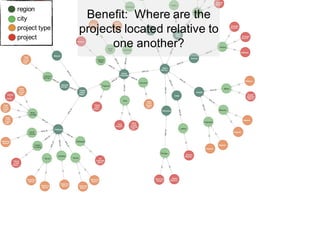
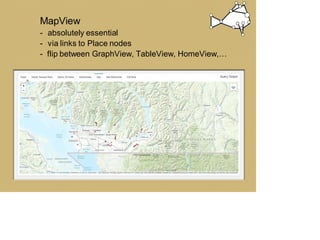
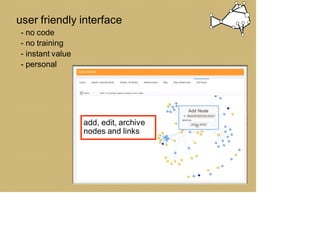
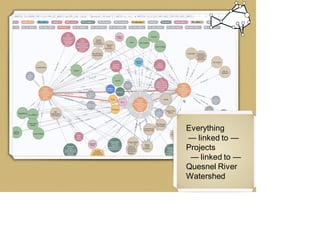
Experiments With
Knowledge Graphs
in
Fisheries & Oceans Canada
Neo4j Innovations Seminar
2021-08-25
Scott Akenhead scott@s4s.com
Tom Bird tom.bird@dfo-mpo.gc.ca
Tell us about yourself: Who are you and how
did you come to be working with Graphs?
Question:
Can you give us some background about the
Problem you are trying to solve?
Salmon
Background
slide:
too much
~100,000 projects, people, places,.
too complicated
many dimensions, each diverse:
ecology, habitat, method, management,
analysis, sociology,.
too dynamic
churn, obsolescence, lags,.
too hidden
technical reports, web pages, Excel files,.
too isolated
important connections missing.
the problem
is information
adaptive management:
- requires inescapable learning and rethinking
- from monitoring projects and strategies
KNOWLEDGE
DATA
INFORMATION
WISDOM
STRUCTURE
CONTEXT
APPLICATION
relational database,
spreadsheets,
reports, web sites …
knowledge graph
decision support
experiments
2018
who is doing what?
2019
international salmon data laboratory
2020
prototype: decision support
2021
proof: program management
experiments
2018
who is doing what?
2019
international salmon data laboratory
2020
prototype: decision support
2021
proof: program management
experiments
2018
who is doing what?
2019
international salmon data laboratory
2020
prototype: decision support
2021
proof: program management
goal:
scenario-based decisions
- objectives
- indicators
- metrics
the human ideas
in a decision process
are types of :Idea nodes
in a knowledge graph
experiments
2018
who is doing what?
2019
international salmon data laboratory
2020
prototype: decision support
2021
proof: program management
Management Use case:
Coordination of salmon projects
Visibility: Who is doing what, where,
when?
Coordination: How do projects align or
conflict with each other, with high level
metrics, with existing knowledge?
Effectiveness: Did we do what we set out
to do? How could we do it better?
The Pacific Region Restoration
Inventory
Graphish Workflow
Natural
Language
Processing
Key
entities Graphish
Database
Custom
User
Interface
processed_with
creates
Provides_meaning
processed_with
creates
provides_meaning
Neo4j
accesses
Graphish as Enterprise IT
- cloud-based, cyber-secure
- data pipelines
- components in containers
- UI as a platform: new Views, new tools
Schema 2021-03-31
- salmon restoration projects
- program management
- Locations, Organizations, Species…
region
city
project type
project
Benefit: Where are the
projects located relative to
one another?
MapView
- absolutely essential
- via links to Place nodes
- flip between GraphView, TableView, HomeView,…
add, edit, archive
nodes and links
user friendly interface
- no code
- no training
- instant value
- personal
Everything
— linked to —
Projects
— linked to —
Quesnel River
Watershed
Organizational Challenges
- New software = new training, IT management
- Information and data are siloed inside business
units
- Cultural, political and security barriers to
engagement and implementation
- Why should I use this?
Technical Challenges for Neo4j
- Thousands of node types
- Some nodes and linkages are stochastic
- Some parts of the data schema need to be discovered
by the crowd
- What are some similar graph analysis use-cases?
Next steps for Graphish 2.0
- Make user engagement part of the technical workflow
- Identify cross-cutting problems and high value network
analyses
- Let users interact with and structure the graph
- Make it accessible to people managing the current
Salmon crisis
Thank you

Experiments With Knowledge Graphs in Fisheries & Oceans Canada