Download as PDF, PPTX
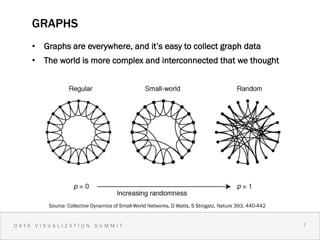
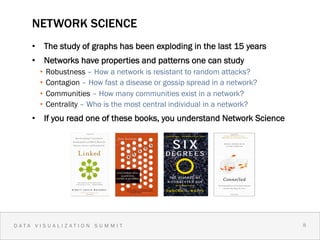
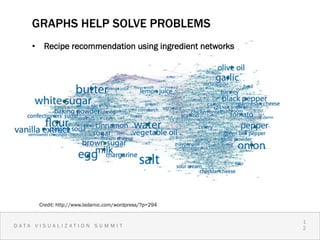
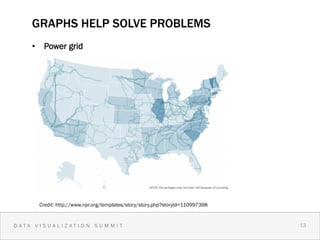
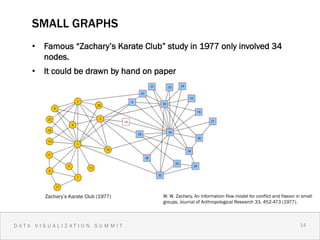
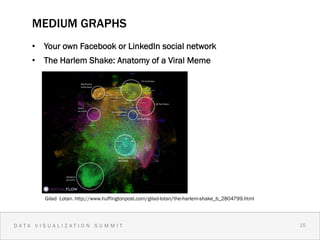
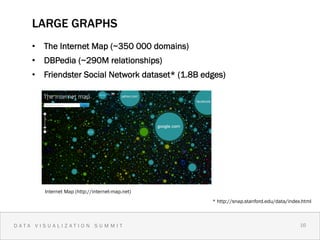
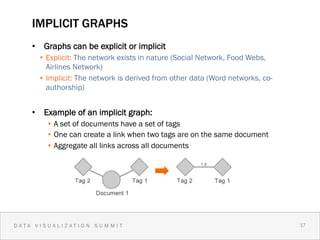
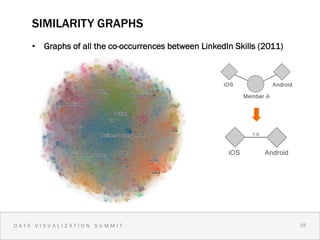
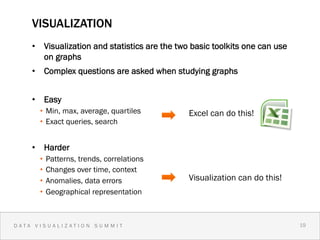
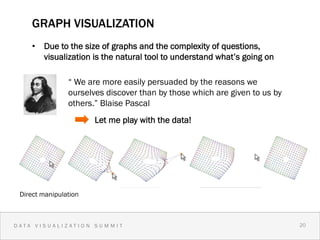
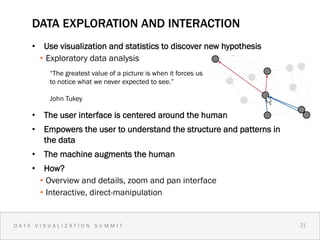
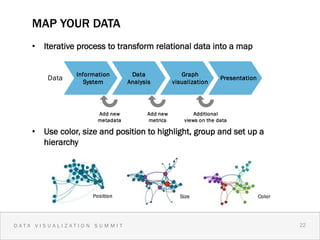
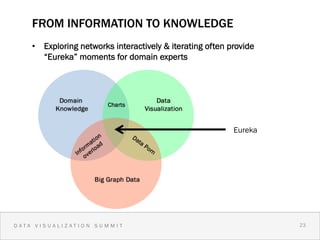
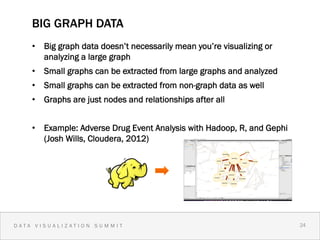
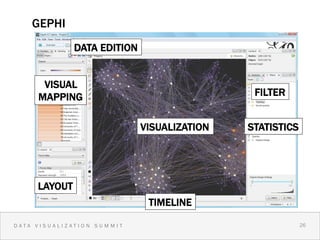
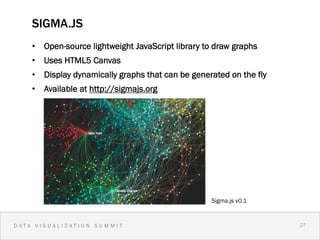

The document discusses big graph data and data visualization. Some key points: - Graphs are useful for solving problems across many domains like disease spread, recommendations, and power grids. - Graphs can be small, medium, large, explicit, or implicit based on how the network is constructed from data. - Visualization is a natural tool for exploring and understanding complex graph data through interaction and iteration. - Open source tools like Gephi and Sigma.js can be used to visualize and analyze graph data.


![Getting Started with Apache Spark: Big Data Made Simple [Free Meetup]](https://cdn.slidesharecdn.com/ss_thumbnails/apachesparkgettingstarted-260203175547-8361bcc3-thumbnail.jpg?width=640&height=640&fit=bounds)


