Downloaded 11 times
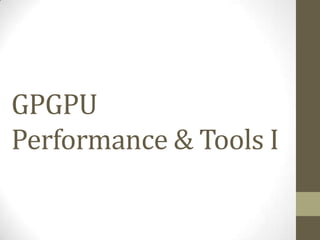


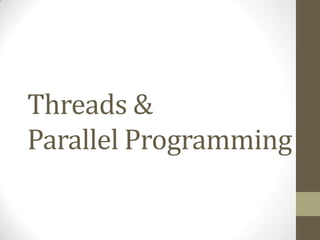
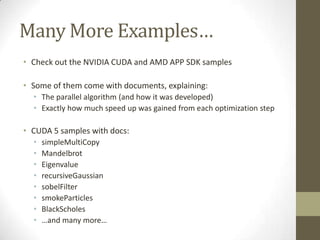
![ILP Magic
• The GPU facilitates both TLP and ILP
• Thread-level parallelism
• Instruction-level parallelism
• ILP means: We can execute multiple instructions at the same time
• Thread does not stall on memory access
• It only stalls on RAW (Read-After-Write) dependencies:
a = A[i]; // no stall
b = B[i]; // no stall
// …
c = a * b; // stall
• Threads can execute multiple arithmetic instructions in parallel
a = k1 + c * d; // no stall
b = k2 + f * g; // no stall](https://image.slidesharecdn.com/gpgpuintro-130319115035-phpapp01/85/Gpgpu-intro-28-320.jpg)
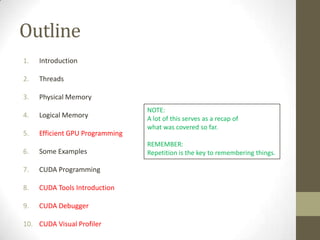
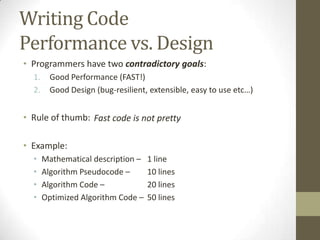
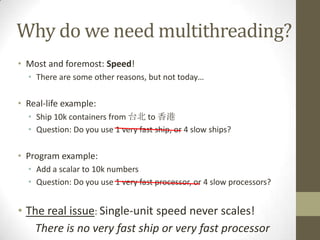
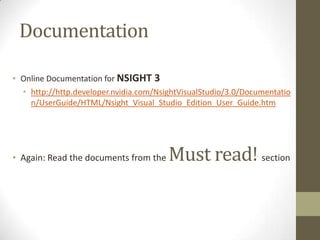
![Warps occupying a SM
(SM=Streaming Multiprocessor)
• Using the previous example: SM Scheduler
…
a = A[i]; // no stall warp6
warp4
b = B[i]; // no stall
// … warp5 warp8
c = a * b; // stall
• What happens on a stall?
• The current warp is placed in the I/O queue and another can run on
the SM
• That is why we want as many threads (warps) per SM as possible
• Also need multiple blocks
• E.g. Geforce 660 can have 2048 threads/SM but only 1024 threads/block](https://image.slidesharecdn.com/gpgpuintro-130319115035-phpapp01/85/Gpgpu-intro-29-320.jpg)
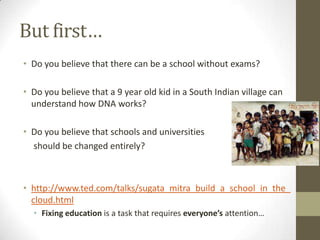
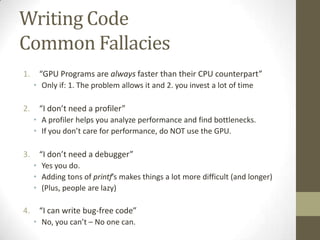
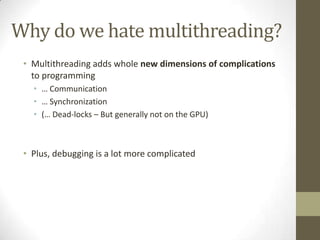
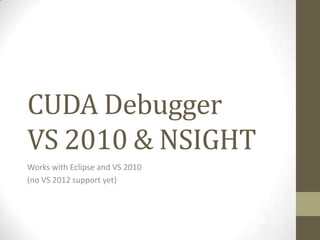
![Look beyond the code
E.g.
int a = …, wA = …;
int tx = threadIdx.x, ty = threadIdx.y;
__shared__ int A[128];
As[ty][tx] = A[a + wA * ty + tx];
• Which resources does the line of code use?
• Several registers and constant cache
• Variables and constants
• Intermediate results
• Memory (shared or global)
• Reads from A (shared)
• Writes to As (maybe global)](https://image.slidesharecdn.com/gpgpuintro-130319115035-phpapp01/85/Gpgpu-intro-35-320.jpg)


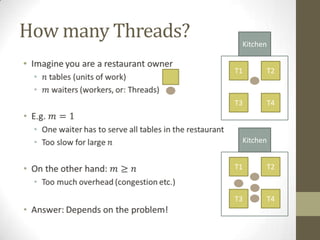
![Update (1)
1. Compiler Options
nvcc (NVIDIA Cuda Compiler)有很多option可以玩玩看。
建議各位把nvcc的help印到一個檔案然後每次開始寫code之前多多參考:
nvcc --help > nvcchelp.txt
2. Compute Capability 1.3
測試系統很老所以他跑的CUDA版本跟大部分的人家裡的CUDA版本應該不一樣。
你們如果家裡可以pass但是批改娘雖然不讓你們pass的話,這裡就有一個很好
的解決方法:用"-arch=sm_13"萊compile跟測試系統會跑一樣的machine code:
nvcc -arch=sm_13
3. Register Pressure & Register Usage
這個stackoverflow的文章就是談nvcc跟register usage的一些事情:
[url]http://stackoverflow.com/questions/9723431/tracking-down-cuda-kernel-
register-usage[/url]
如果跟nvcc講-Xptxas="-v"的話,他就會跟你講每一個thread到底在用幾個
register。
我的中文好差。請各位多多指教。](https://image.slidesharecdn.com/gpgpuintro-130319115035-phpapp01/85/Gpgpu-intro-65-320.jpg)

The document provides an outline for a lecture on GPGPU performance and tools, discussing threads, physical and logical memory, efficient GPU programming, examples of GPU programming, and CUDA programming tools including the CUDA debugger and visual profiler. It emphasizes reading documentation, using profilers and debuggers to optimize code, and challenges common assumptions about GPU programming.


![[Harvard CS264] 06 - CUDA Ninja Tricks: GPU Scripting, Meta-programming & Aut...](https://cdn.slidesharecdn.com/ss_thumbnails/cs264201106-cudaninjasharetmp-110301171948-phpapp01-thumbnail.jpg?width=640&height=640&fit=bounds)