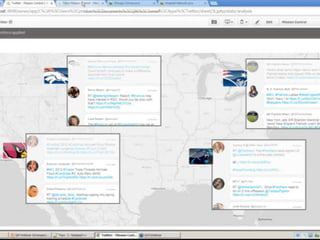
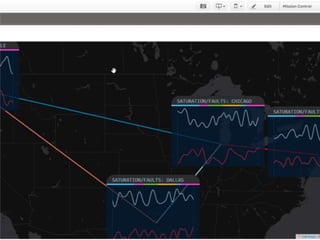
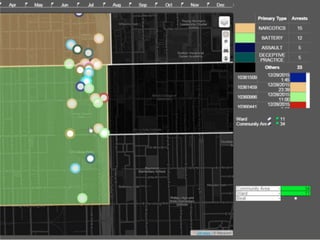
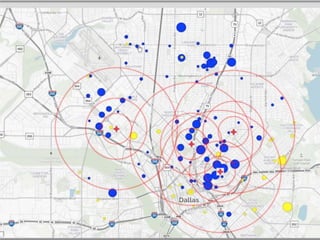
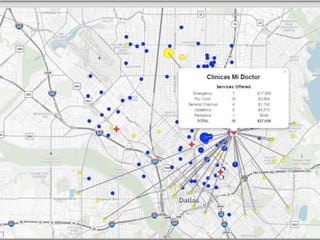
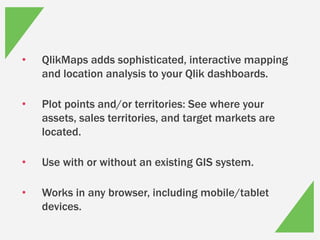
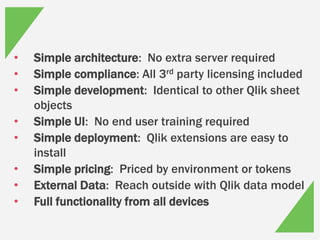
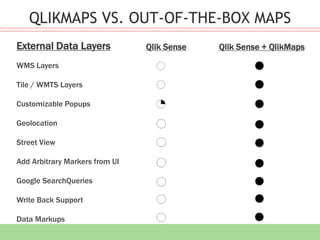
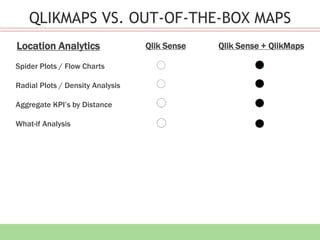
@QlikMaps
#HappyMapping
1 Real-Time Mission
Control Dashboard
Utilize HTML Markers,
Customizable Popups, and
ESRI Integration.
1. Real-Time Mission Control Dashboard
2 Spot A Problem
Take Instant Action
Use Popups with live integration
of a trouble ticketing system.
Take action using Writebacks to
another system.
2. Spot A Problem, Take Instant Action
3 Crime
Analysis
Utilize Popups with live cams,
street views and google searches.
Historical analysis using Lines and
density analysis with Radial Plots.
3. Crime Analysis
4 Market & Sales
Territory Planning
Utilize Radial Plots to show
cannibalization and Spider Plots to
show relationship between
customers and stores.
4. Market & Sales Territory Planning
5 Hospital Network
Planning
Use Spider Plots, Radial
Plots, Search Functionality,
and ESRI Integration to
plan network strategy.
5. Hospital Network Planning
Qlikmaps.com | @QlikMaps | #HappyMapping
• QlikMaps adds sophisticated, interactive mapping
and location analysis to your Qlik dashboards.
• Plot points and/or territories: See where your
assets, sales territories, and target markets are
located.
• Use with or without an existing GIS system.
• Works in any browser, including mobile/tablet
devices.
WHY
QLIKMAPS?
• Simple architecture: No extra server required
• Simple compliance: All 3rd party licensing included
• Simple development: Identical to other Qlik sheet
objects
• Simple UI: No end user training required
• Simple deployment: Qlik extensions are easy to
install
• Simple pricing: Priced by environment or tokens
• External Data: Reach outside with Qlik data model
• Full functionality from all devices
Points / Markers as Circles
Markers with Custom Shading
Markers with Icons
Polygons / Territories
Custom Polygons / Territories
Multilayer
Drilling
International Boundary Library
Data Layers Qlik Sense Qlik Sense + QlikMaps
QLIKMAPS VS. OUT-OF-THE-BOX MAPS
WMS Layers
Tile / WMTS Layers
Customizable Popups
Geolocation
Street View
Add Arbitrary Markers from UI
Google SearchQueries
Write Back Support
Data Markups
External Data Layers Qlik Sense Qlik Sense + QlikMaps
Spider Plots / Flow Charts
Radial Plots / Density Analysis
Aggregate KPI’s by Distance
What-if Analysis
Location Analytics
QLIKMAPS VS. OUT-OF-THE-BOX MAPS
Qlik Sense Qlik Sense + QlikMaps
THANK YOU

5 Unexpected Ways To Use Location Analytics

  • 1.
  • 2.
  • 3.
    Utilize HTML Markers, CustomizablePopups, and ESRI Integration. 1. Real-Time Mission Control Dashboard
  • 5.
    2 Spot AProblem Take Instant Action
  • 6.
    Use Popups withlive integration of a trouble ticketing system. Take action using Writebacks to another system. 2. Spot A Problem, Take Instant Action
  • 8.
  • 9.
    Utilize Popups withlive cams, street views and google searches. Historical analysis using Lines and density analysis with Radial Plots. 3. Crime Analysis
  • 11.
    4 Market &Sales Territory Planning
  • 12.
    Utilize Radial Plotsto show cannibalization and Spider Plots to show relationship between customers and stores. 4. Market & Sales Territory Planning
  • 14.
  • 15.
    Use Spider Plots,Radial Plots, Search Functionality, and ESRI Integration to plan network strategy. 5. Hospital Network Planning
  • 17.
    Qlikmaps.com | @QlikMaps| #HappyMapping
  • 18.
    • QlikMaps addssophisticated, interactive mapping and location analysis to your Qlik dashboards. • Plot points and/or territories: See where your assets, sales territories, and target markets are located. • Use with or without an existing GIS system. • Works in any browser, including mobile/tablet devices.
  • 19.
  • 20.
    • Simple architecture:No extra server required • Simple compliance: All 3rd party licensing included • Simple development: Identical to other Qlik sheet objects • Simple UI: No end user training required • Simple deployment: Qlik extensions are easy to install • Simple pricing: Priced by environment or tokens • External Data: Reach outside with Qlik data model • Full functionality from all devices
  • 21.
    Points / Markersas Circles Markers with Custom Shading Markers with Icons Polygons / Territories Custom Polygons / Territories Multilayer Drilling International Boundary Library Data Layers Qlik Sense Qlik Sense + QlikMaps QLIKMAPS VS. OUT-OF-THE-BOX MAPS
  • 22.
    QLIKMAPS VS. OUT-OF-THE-BOXMAPS WMS Layers Tile / WMTS Layers Customizable Popups Geolocation Street View Add Arbitrary Markers from UI Google SearchQueries Write Back Support Data Markups External Data Layers Qlik Sense Qlik Sense + QlikMaps
  • 23.
    Spider Plots /Flow Charts Radial Plots / Density Analysis Aggregate KPI’s by Distance What-if Analysis Location Analytics QLIKMAPS VS. OUT-OF-THE-BOX MAPS Qlik Sense Qlik Sense + QlikMaps
  • 24.

Editor's Notes

  • #25 Pan and Zoom. Base Maps Show Layers. Region is a custom region Custom region popup – Top 5 sales in pop up. Drilling is possible Points in Sense – The bigger the bubble, the more Sales a customer has. The colors represent the trend in sales. Radials – Each one of my customers has an equal amount of my customers, or as close as it can. Popups  Street View  Radials  Custom Icons  Search