Download as PDF, PPTX


![© 2014 SOLARWINDS WORLDWIDE, LLC. ALL RIGHTS RESERVED.
Resource listing
» Presentations: OraPub search, “time analysis”
» Craig’s Blog – Search “time analysis”
» Training from OraPub
Oracle Performance Firefighting (I)
Adv Oracle Performance Analysis (II)
Super Seminars: One day Super Saturdays
» OraPub Online Institute – Any [Device, Time, Location]
Tuning Oracle Using An AWR Report
Utilization On Steroids
» Tools at www.orapub.com
OSM Toolkit. OP search, “OSM”.
» Books
Oracle Performance Firefighting.
Forecasting Oracle Performance.
San Jose, CA USA
December 8-12](https://image.slidesharecdn.com/howtofindwhatismakingyouroracledatabaseslow-151009185141-lva1-app6891/85/How-to-find-what-is-making-your-Oracle-database-slow-44-320.jpg)

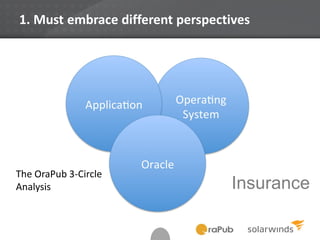
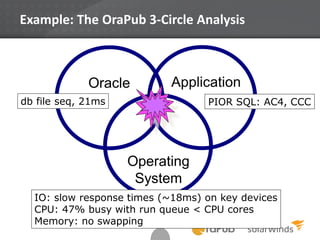
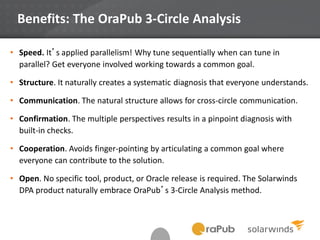
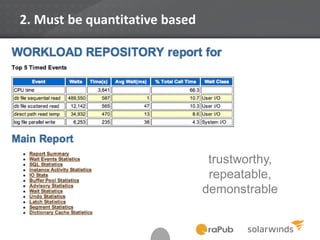
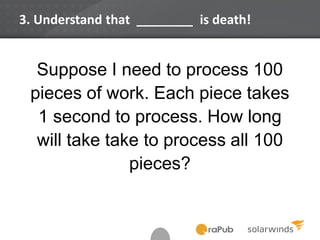
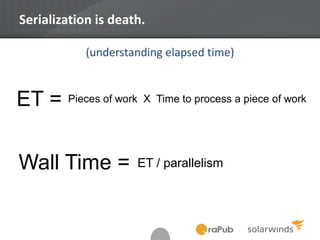
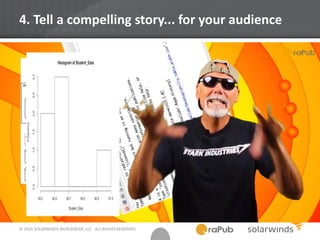
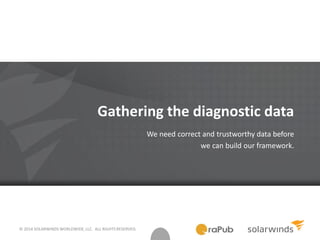
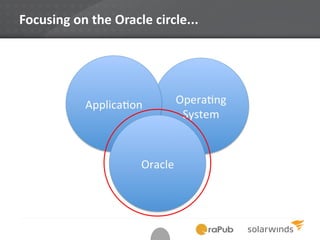
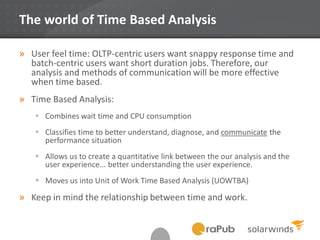
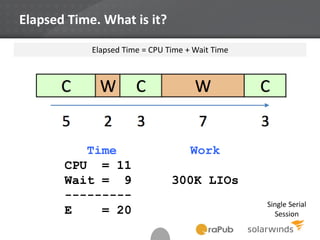
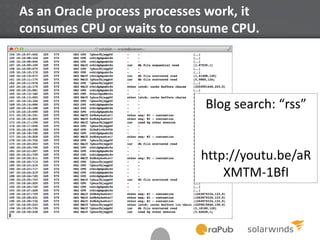
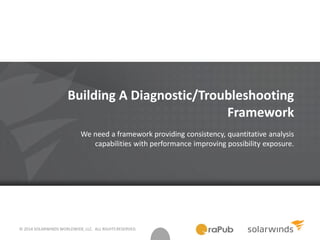
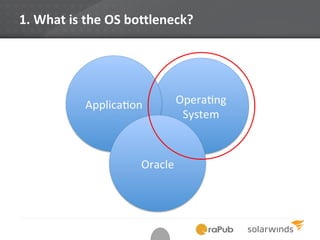
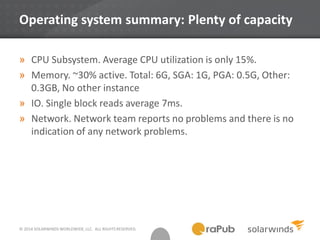
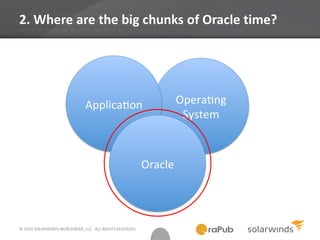
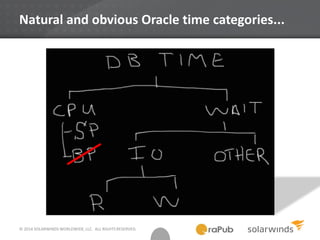
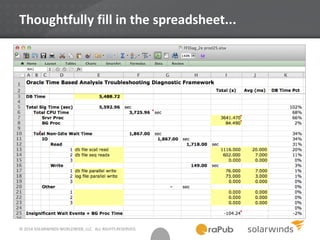
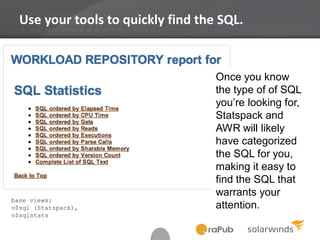
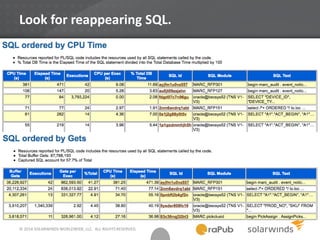
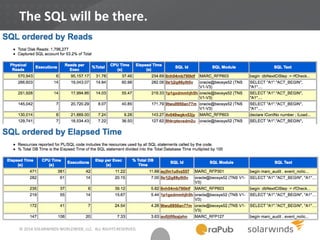
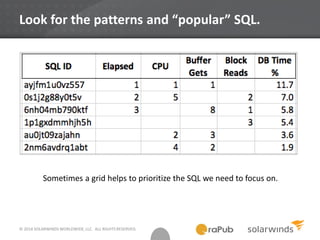
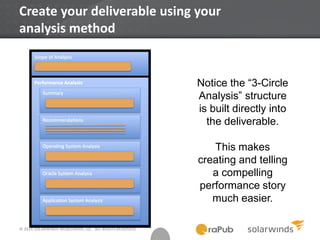
The document discusses time-based analysis for improving Oracle performance. It introduces the OraPub 3-Circle Analysis method which examines the operating system, Oracle database, and application simultaneously. It emphasizes the importance of using quantitative, trustworthy data and understanding how work is processed over time. The document provides guidance on gathering diagnostic data, identifying performance bottlenecks, and focusing on the right types of SQL to optimize Oracle performance.