Download to read offline


![Gentrification and its Effects on Minority Communities – A Comparative Case Study of Four Global Cities: San Diego, San Francisco, Cape Town, and Vienna
Int. J. Public Admin. Pol. Res. 089
Kotze, N. “A community in trouble? The impact of gentrification on the Bo-Kaap, Cape Town”. Urbani Izziv, 2013, 24(2),
124-132. doi:10.5379/urbani-izziv-en-2013-24-02-004
Lees L. and Philips, M., “Tourism gentrification”, Centre of Geographical Studies, University of Lisbon.
https://www.researchgate.net/publication/323696032_Tourism_gentrification
Lees L., Slater T, and Wyly Elvin, “Gentrification”, Routledge Taylor and Francis Group, New York and London, 2008.
Lopez-Villafana, Andrea. “Barrio Logan community members discuss gentrification.” 2019.
https://www.sandiegouniontribune.com/communities/san-diego/story/2019-09-28/barrio-logan-residents-discuss-
gentrification
Lopez-Villafania, Andrea. “Barrio Logan Affordable Housing Tenants Object to Rent Hike.” San Diego Union-Tribune.
March 29, 2020, www.sandiegouniontribune.com/communities/san-diego/story/2020-03-29/tenants-in-barrio-
logan-affordable-housing-complex-demand-owner-reconsider-rent-hike.
Lopez-Villafania, Andrea. Groups work to revive Barrio Logan community plan update. San Diego Union-Tribune. March
4, 2020, https://www.sandiegouniontribune.com/communities/san-diego/story/2020-03-04/groups-work-to-revive-
barrio-logan-community-plan-update
Manson, Bill. “Soon There Won’t Be a Barrio Logan.” 2009, https://www.sandiegoreader.com/news/2009/sep/30/cover/
Makris, Sohphie. Phys.org. “Urban Planners Look To Vienna To Solve Housing Crises.” 2020. https://phys.org/news/2018-
12-urban-planners-vienna-housing-crises.html. Accessed 10 June 2020.
Mayor Ed Lee. City and County of San Francisco. “First Source Hiring Program.” Office of Economic Workforce
Development. 2006, http://mission.sfgov.org/oca_bid_attachments/fa22336.pdf.
Mercado Apartments. “Fact Sheet” Sandiego.gov. 2020, https://www.sandiego.gov/sites/default/files/legacy
/redevelopment-agency/pdf/affhousing/mercadoaptsfactsheet.pdf. Accessed 10 June 2020.
Minder, Raphael. “Lisbon Is Thriving. But at What Price for Those Who Live There?”. The New York Times, May 23, 2018.
Lisbon Is Thriving. But at What Price for Those Who Live There? - The New York Times (nytimes.com)Molnar,
Phillip. “More than 2,000 New San Diego Apartments to Open This Year.” San Diego Union-Tribune, 9 Mar. 2018,
www.sandiegouniontribune.com/business/real-estate/sd-fi-new-apartments-multifamily-20180309-story.html.
Accessed 9 June 2020.
Molnar, Phillip. “San Diego Average Rent up to $1,887, Breaking Record. Will It Last?” San Diego Union-Tribune, 4 Apr.
2018, www.sandiegouniontribune.com/business/real-estate/sd-fi-rent-vacancy-20180403-story.html. Accessed 9
June 2020.
Molnar, Phillip. “San Diego Will Soon Have Rent Control. What Renters and Landlords Need to Know.” San Diego Union-
Tribune, 25 Oct. 2019, www.sandiegouniontribune.com/business/real-estate/story/2019-10-25/san-diego-will-
soon-have-rent-control-what-renters-and-landlords-need-to-know. Accessed 9 June 2020.
Montgomery, Charles. “Happy City: Transforming Our Lives through Urban Design”. Anchor Canada, 2014.
Moskowitz, P. E. “How to Kill a City: Gentrification, Inequality, and the Fight for the Neighborhood”. Nation Books, 2018.
NBC 7. “San Diego City Council Votes to Adopt Affordable Housing Study.” June 3, 2020.
https://www.nbcsandiego.com/news/local/san-diego-city-council-votes-to-adopt-affordable-housing-
study/2339229/.
Population of San Diego County, CA - “Census 2010 and 2000 Interactive Map, Demographics, Statistics, Quick Facts –
Census Viewer.” Census viewer. Com, 2010, censusviewer.com/county/CA/San%20Diego. Accessed 9 June
2020.
N.D. “Property values in Bo Kaap”, Retrieved August, 2020, https://www.property24.com/property-values/bo-kaap/cape-
town/western-cape/9136
Perry, Francesca. “'We Are Building Our Way to Hell': Tales of Gentrification around the World.” The Guardian. Guardian
News and Media, October 5, 2016, https://www.theguardian.com/cities/2016/oct/05/building-way-to-hell-readers-
tales-gentrification-around-world.
Price, David. Shelterforce. “7 Policies That Could Prevent Gentrification.” Shelterforce. 2020,
https://shelterforce.org/2014/05/23/7_policies_that_could_prevent_gentrification/. Accessed 10 June 2020.
Property Shark. “San Francisco Median Home Sales Map”. 2004-2014, https://www.propertyshark.com/mason/ca/San-
Francisco-County/Maps?map=ca_sanfrancisco&x=0.50625&y=0.43875&zoom=0&basemap=
gentrification&tab=themes&ll=37.7795460412266,-122.441370584653.
Rendon-Alvarez, M. R. “Barrio Logan residents, activists protest rent hike”. NBC 7 San Diego. March 3, 2020,
https://www.nbcsandiego.com/news/local/barrio-logan-residents-activists-protest-rent-hike/2277168/
Riedl, Daniel, et al. “First Vienna Residential Market Report”. 2019, residentialmarketvienna.at/links/pdf/
BUWOG_WMB19_EN.pdf.
Riegler, Johannes. “Competitiveness VS. Social Balance: Gentrification as Urban Policy in Cases in Budapest and Vienna”
[Master's thesis]. 2011, https://www.4cities.eu/wp-content/uploads/2016/06/MAthesis_4CITIES_RIEGLER_
JOHANNES_Cohort2.pdf
Safdie Rabines Architects, Mercado del Barrio, San Diego, CA, Shea Properties with San Diego Redevelopment Agency.
https://www.safdierabines.com/portfolio/mercado-del-barrio/ (Figure 2).](https://image.slidesharecdn.com/pdff-210331152940/75/Gentrification-and-its-Effects-on-Minority-Communities-A-Comparative-Case-Study-of-Four-Global-Cities-San-Diego-San-Francisco-Cape-Town-and-Vienna-23-2048.jpg)

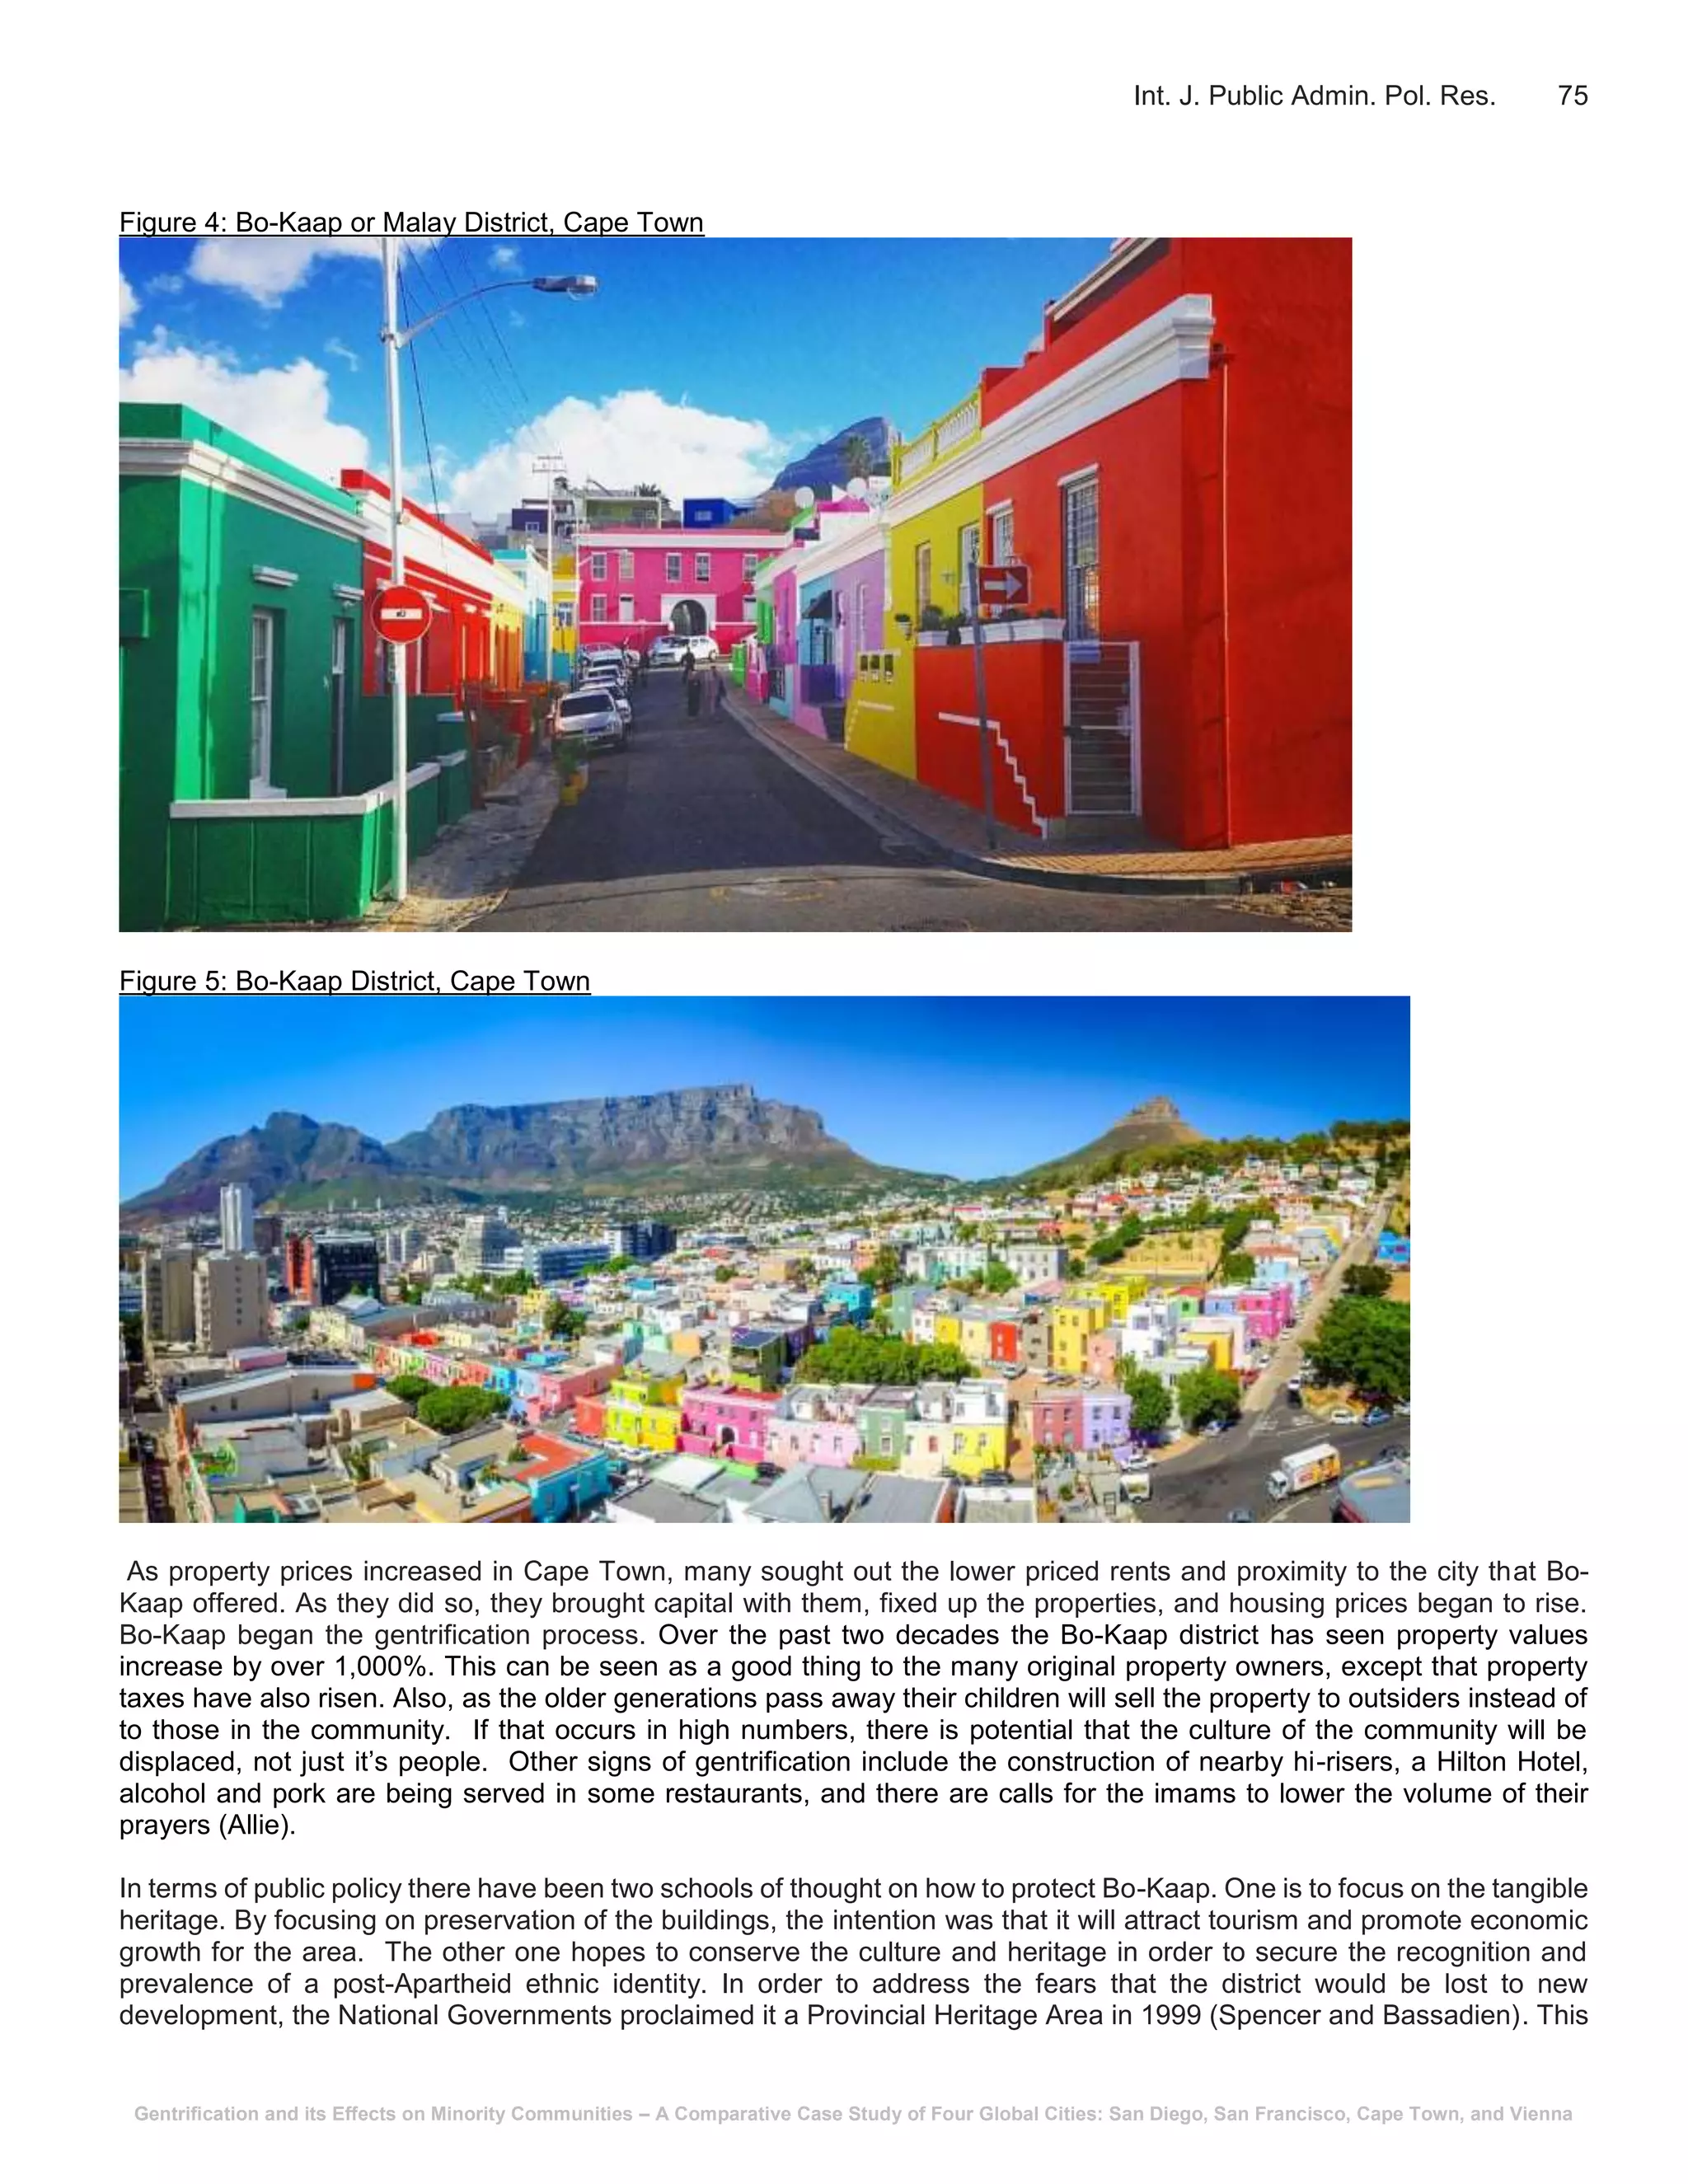
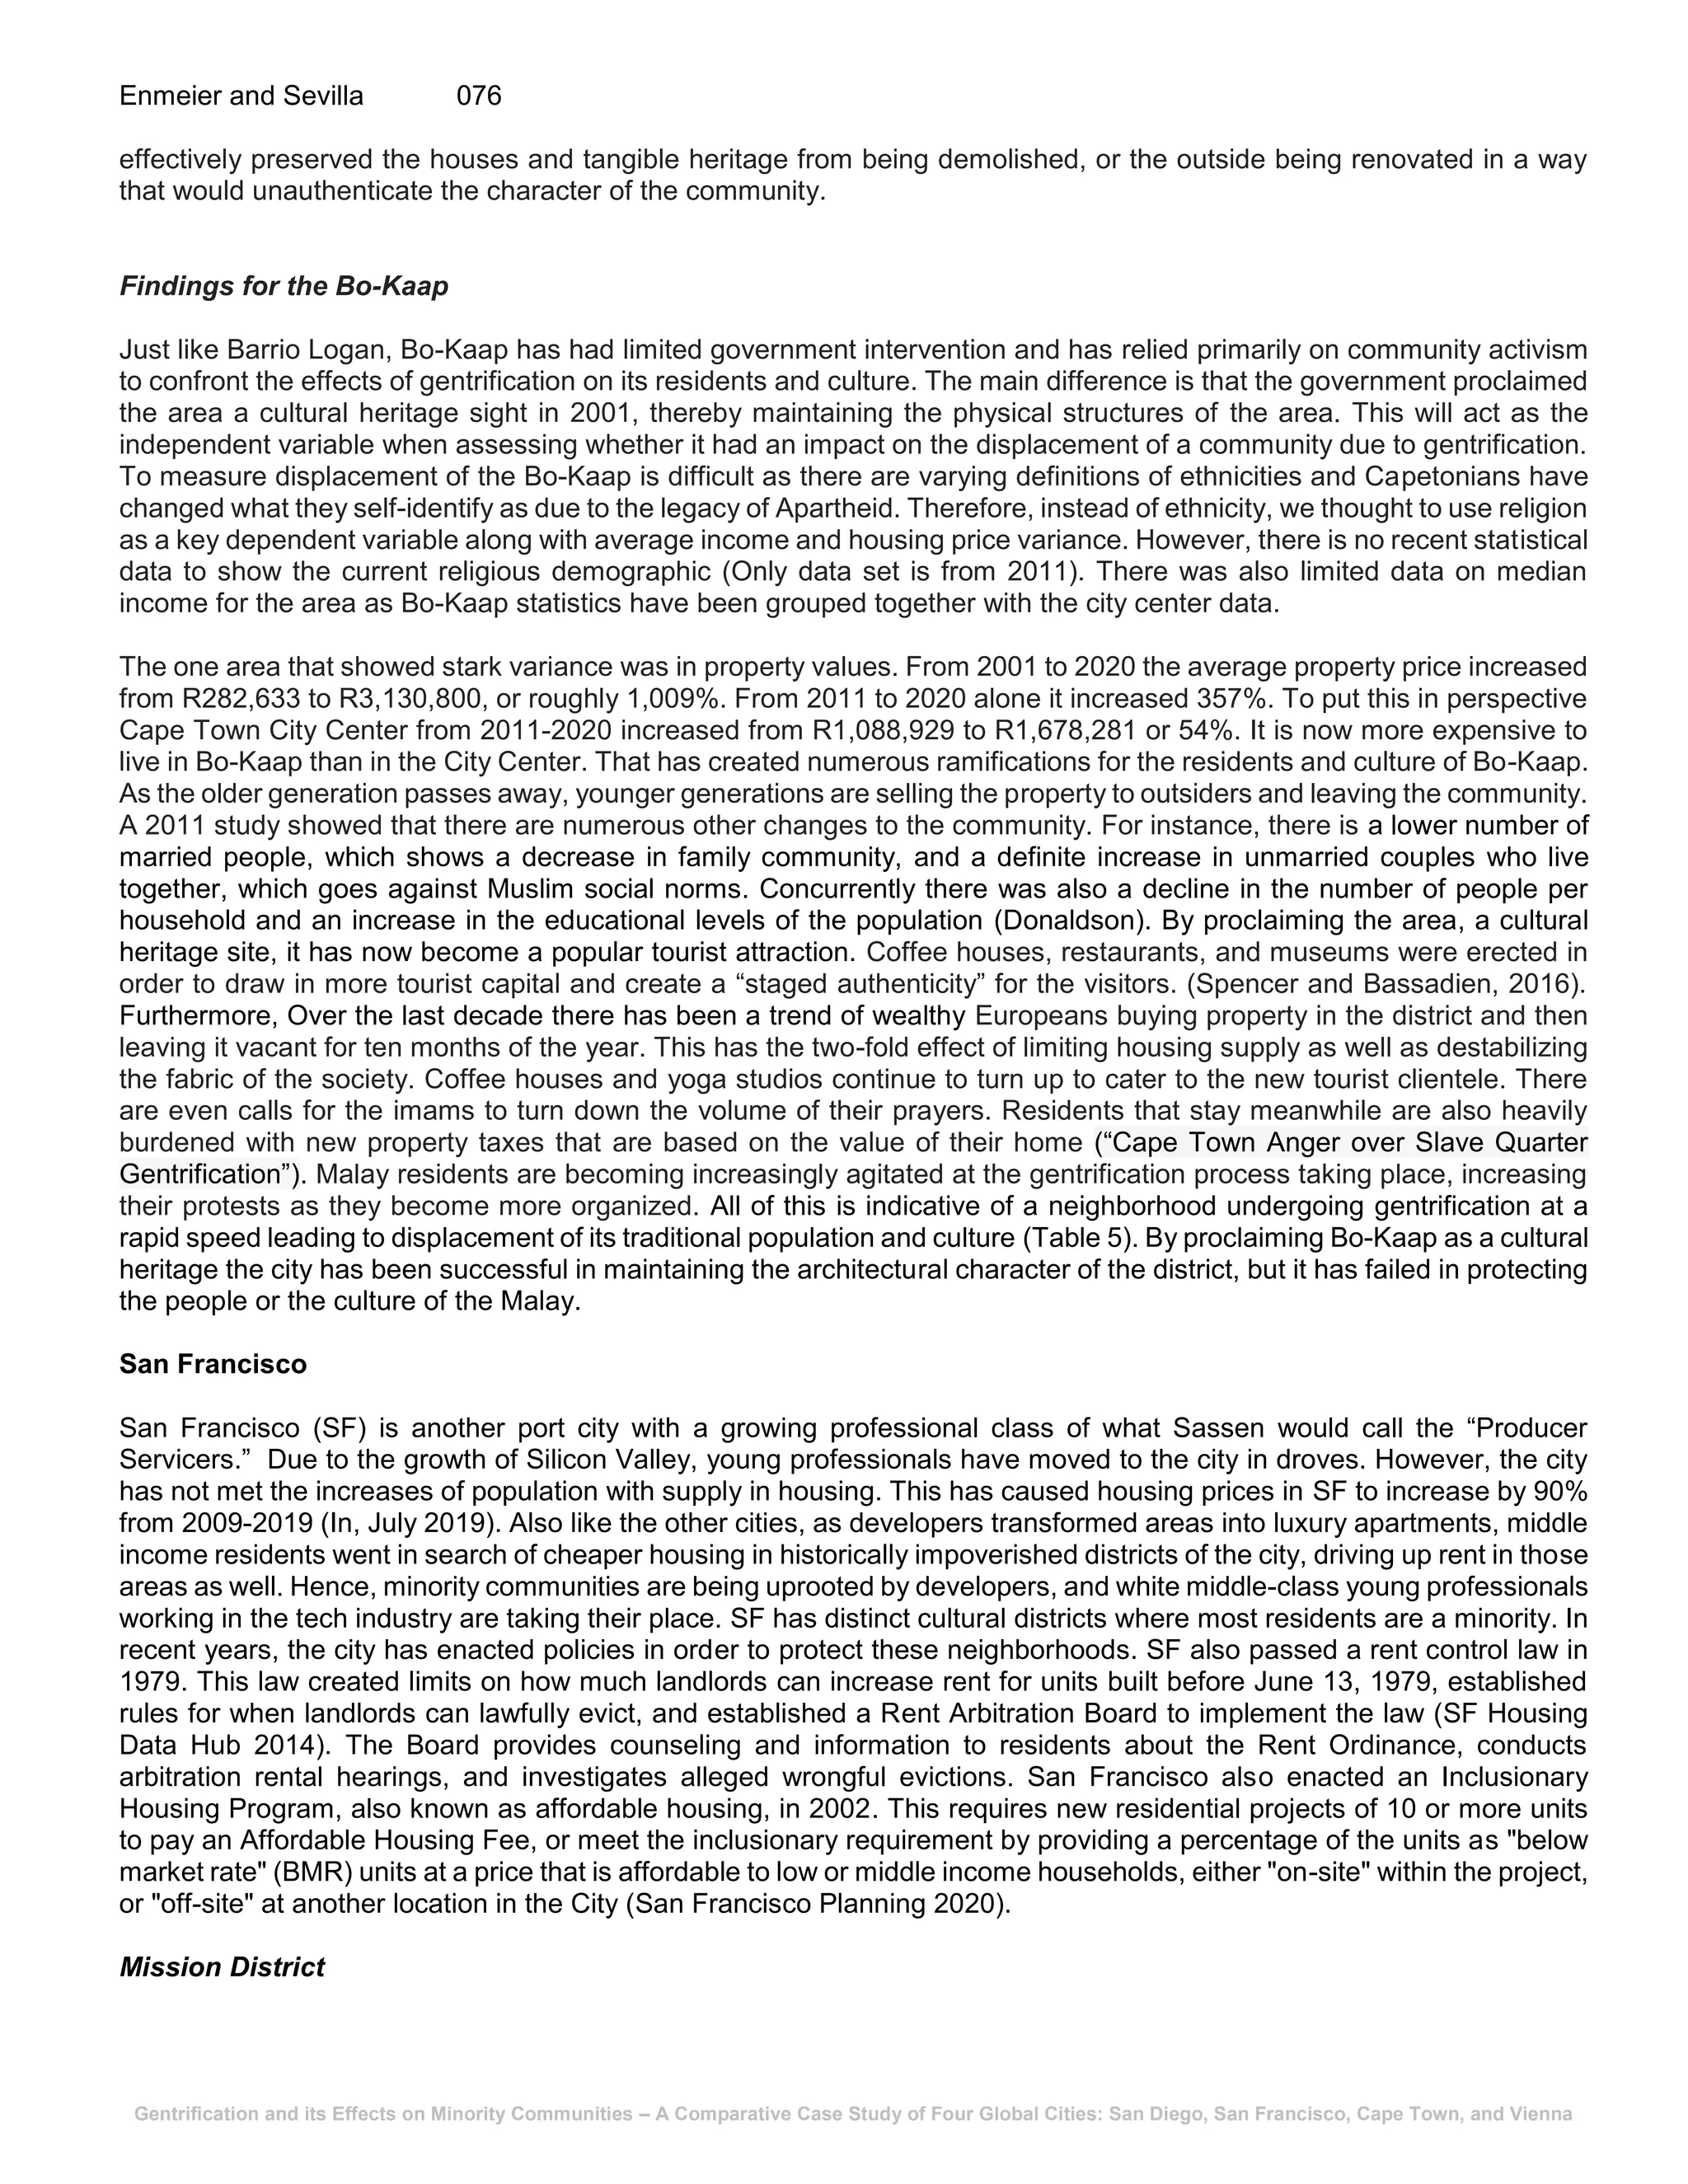
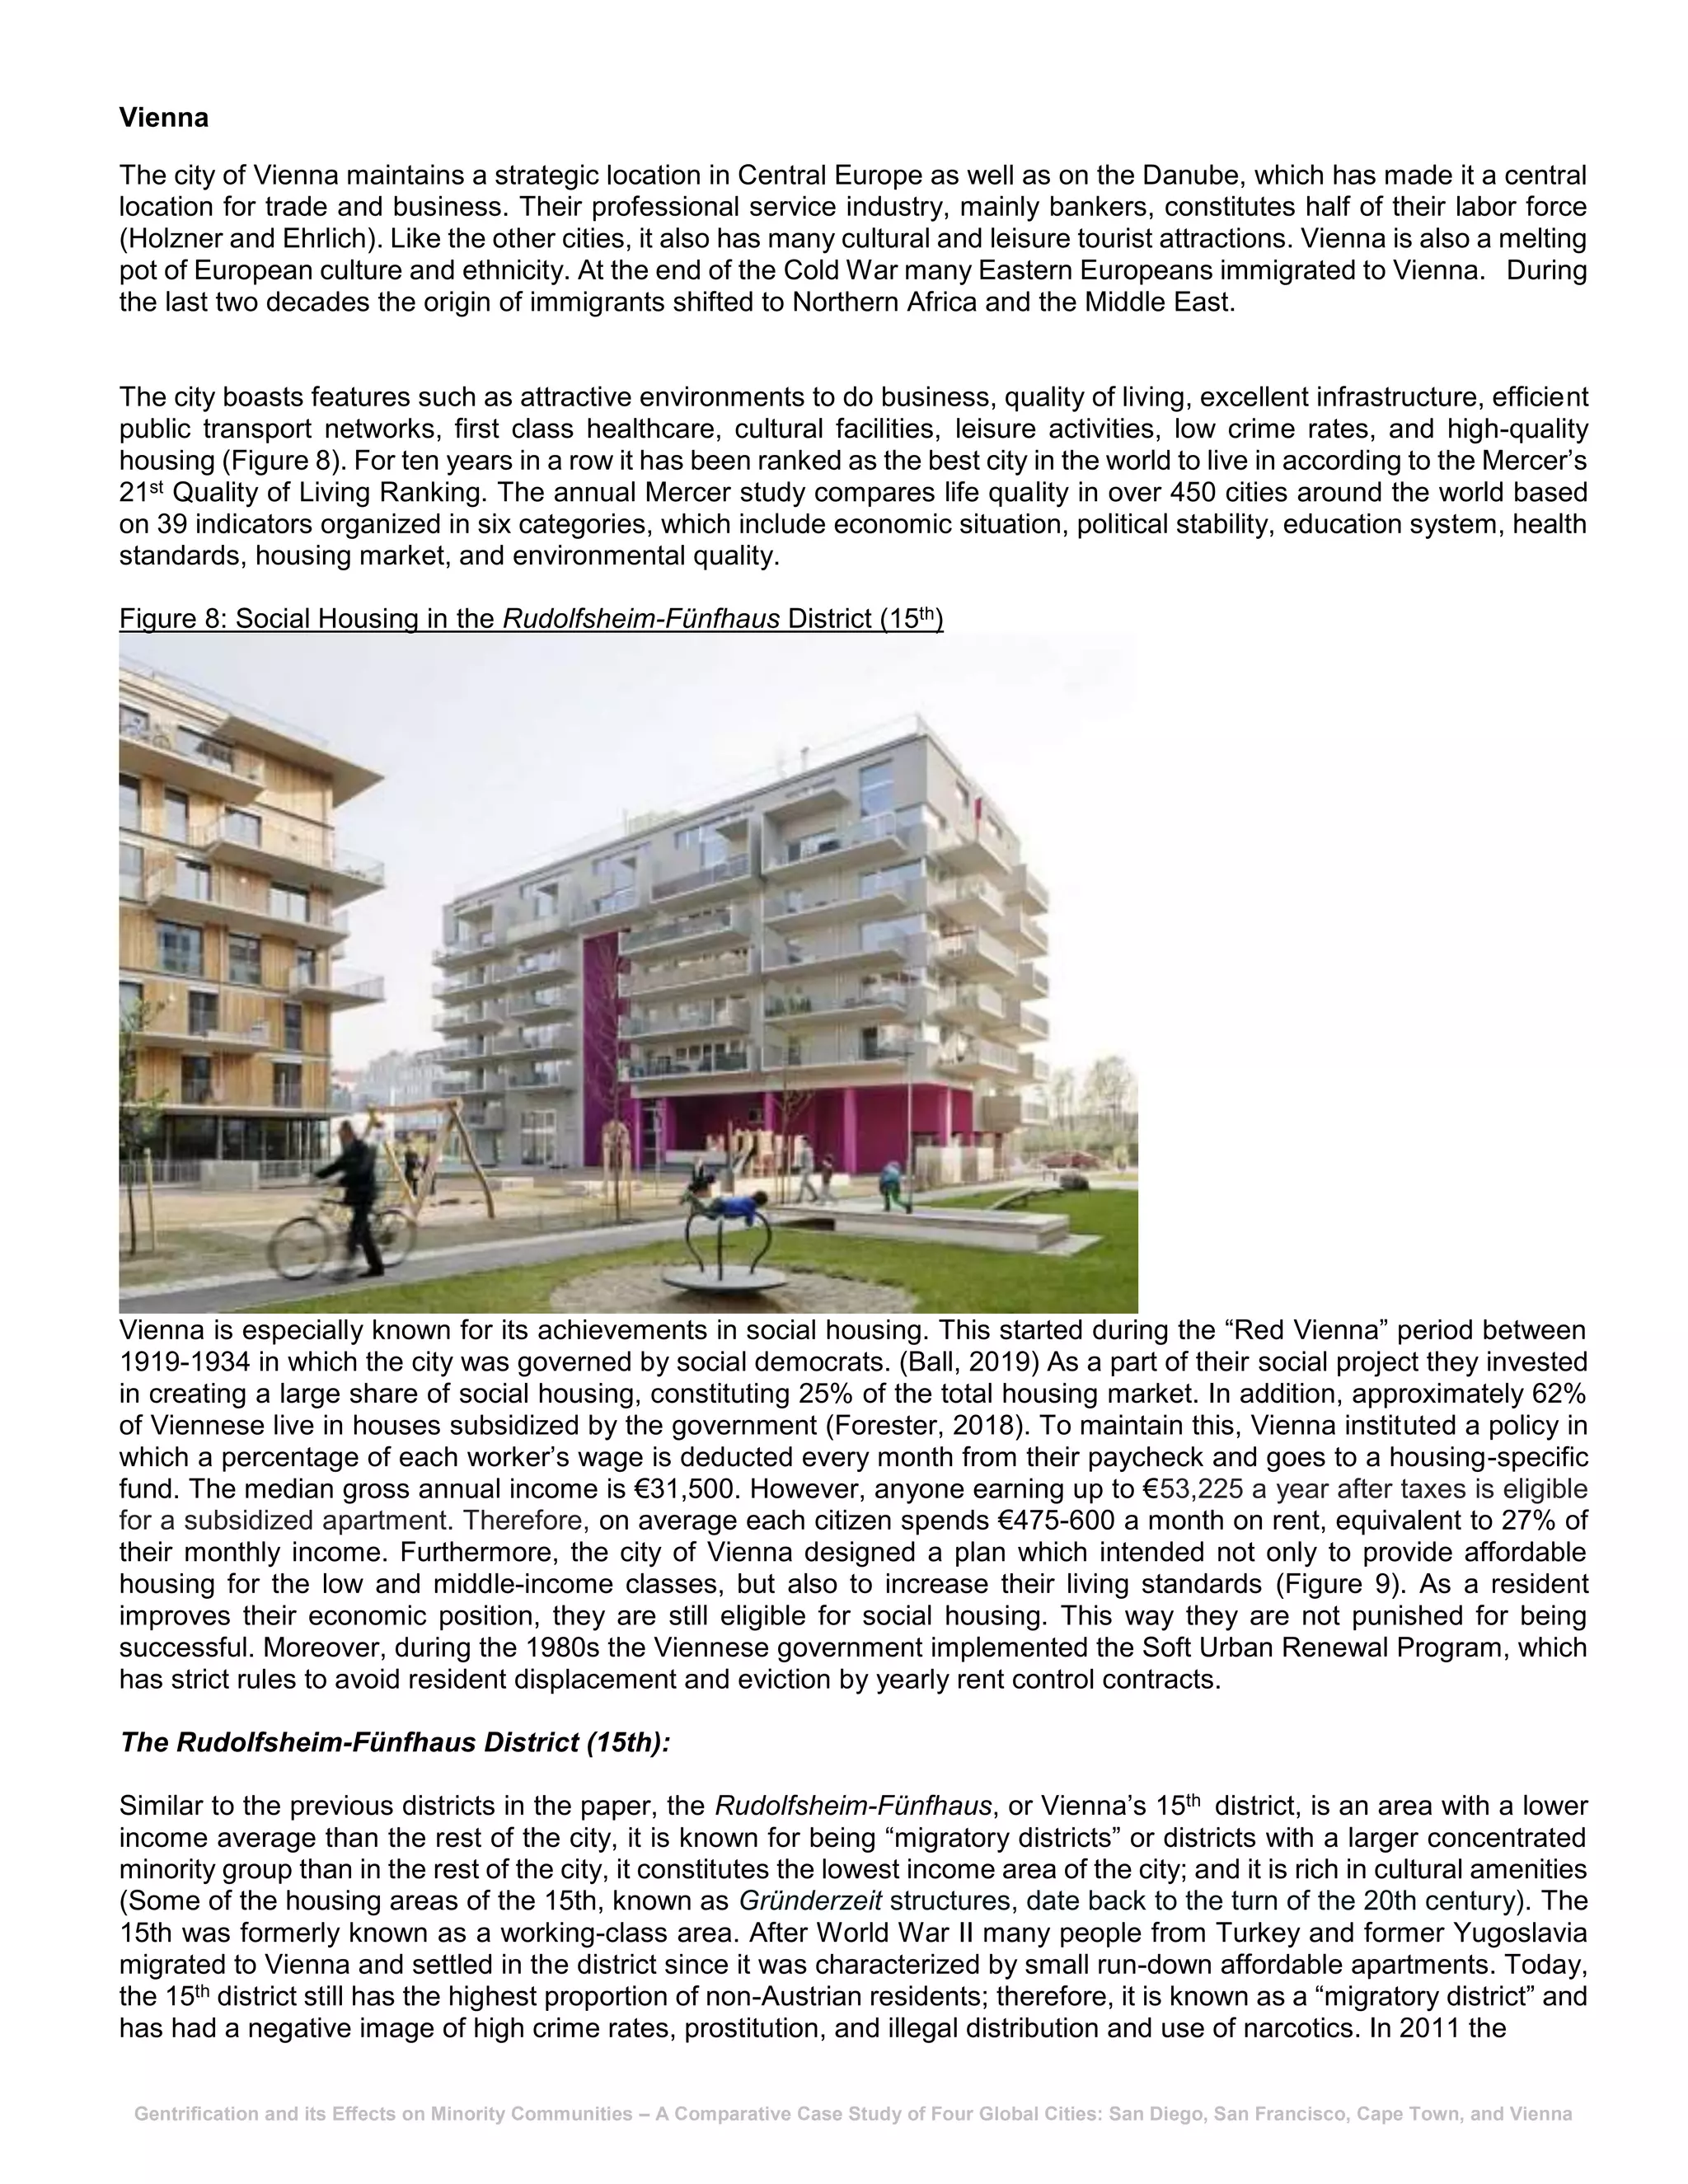
This paper conducts a comparative analysis of gentrification's impacts on minority communities in four global cities: San Diego, San Francisco, Cape Town, and Vienna, highlighting the displacement of these populations resulting from rising property values. It evaluates how different city policies, particularly those promoting social housing and cultural inclusion, can mitigate the adverse effects of gentrification. The study seeks to identify effective strategies to balance urban development with the preservation of established communities and cultures.


