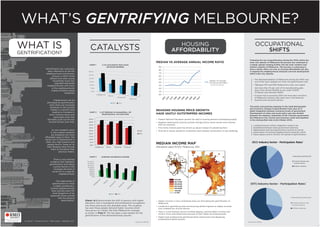
1. Charts 1 & 2 demonstrate the shift of persons with higher
education and in managerial and professional occupations
into these previously less desirable areas. This coupling
has seen these people demand higher incomes which
have grown at a faster rate than Melbourne’s average,
as shown in Chart 3. This has been a real catalyst for the
gentrification of the aforementioned suburbs.
• Fastest National Population growth has lead to housing demand outstripping supply.
• Negative Gearing and Land tax policies strongly favour home owners and minimise
their tax exposure.
• First Home Owners grant has driven up values instead of subsidising them.
• Only 5% of money loaned for investment went towards construction of new dwellings.
REASONS HOUSING PRICE GROWTH
HAVE VASTLY OUTSTRIPPED INCOMES
• Higher incomes in more centralised areas are stimulating the gentrification of
Melbourne.
• Landlords in gentrifying areas are favouring skilled migrants on higher incomes
over unskilled low income earners.
• There is a link between persons holding degrees, earning higher incomes and
living in more centralised areas because of their higher purchasing power.
• Higher level professionals gentrifying these central areas and displacing
unskilled/less skilled workers.
HOUSING
AFFORDABILITY
MEDIAN INCOME MAP*
(Residents aged 25-65). Melbourne, 2011.
*
* Sourced from ABS data
Following the rise of gentrification during the 1970s within the
inner city suburbs of Melbourne the process has continued at
a steady spread creeping further into the inner northern and
western suburbs of Melbourne. This process is continuing to
have a drastic effect not only on housing affordability but also
in shaping the neighbourhood character and new development
within inner-city suburbs.
The policy and planning response to the rapid demographic
and economic changes of gentrification have seen an in
depth integration between numerous levels of government.
Development of urban and social policy was also divided
between the statutory authorities of the Victorian government,
the Melbourne City Council and numerous small municipalities
in the metropolitan area (Colic-Peisker 2014).
• The deindustrialisation of Melbourne during the 1970s was
one of the main catalysts for inner-city gentrification and
• “Between 1971 and 2001 Melbourne’s inner core region
lost more than 70 per cent of its manufacturing jobs,
down from almost 118,000 to just under 37,000”
(O’Hanlon and Hamnett 2009).
• A boom had occurred by 2001 and more than one-third
of Melbourne industry jobs were now in the financial,
business and insurance sectors
Looking forward, further integration needs to be
established between state government planning
departments and local government councils to ensure
preservation of existing neighbourhood character within
these regions and to monitor the spread of gentrification.
WHAT’S GENTRIFYING MELBOURNE?
CATALYSTS OCCUPATIONAL
SHIFTS
Gentrification has commonly
been referred to as the the
neighbourhood evolutionary
process in which more
affluent and often young
households move into
upgraded distressed
neighbourhoods with many
of the neighbourhoods
original residents being
displaced.
Displacement can be
stimulated by gentrification
when there are increased
demands on the housing
market in a specific area
leading to increases in
rents, housing values and
associated costs that
ultimately push out the low
income earners over time.
As new residents move
in, the original residents
are displaced into more
affordable areas to them. The
social cost of displacement is
often very high however and
people tend to ‘hang on’ to
their lifestyles often forcing
them to live below their
previous means.
There is very minimal
evidence that highlights
gentrification even being
a prime factors in the
increases the level of
social mix in a specific
neighbourhood.
The relationship of
gentrification to crime
is highly problematic.
Central neighbourhoods
have typically been the
most dangerous of all,
especially those scarred
with the physical
deterioration.
WHAT IS
GENTRIFICATION?
CHART 1*
CHART 3*
CHART 2*
% OF PERSONS IN MANAGERIAL OR
PROFESSIONAL OCCUPATIONS
% OF OCCUPANTS WHO HAVE
BACHLOR DEGREES
AVERAGE HOUSEHOLD INCOME
*2013
* Sourced from Grattan Institute 2013
* Sourced from ABS data
School of Property, Construction
and Project Management Kai Recht | Cameron Hord | Matt Leardi | Stephen Land
MEDIAN VS AVERAGE ANNUAL INCOME RATIO
Median VS Average
Annual Income Ratio
* Sourced from ABS data
*