Downloaded 165 times

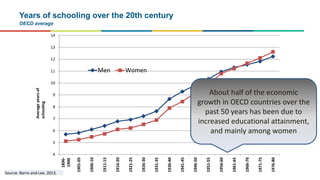
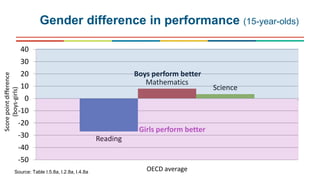
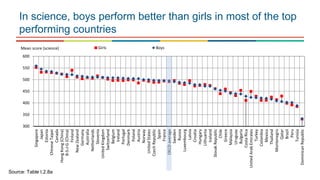
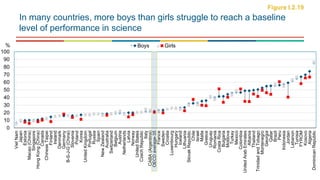
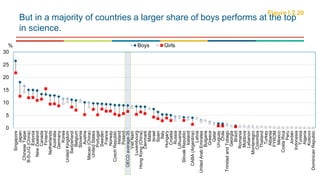
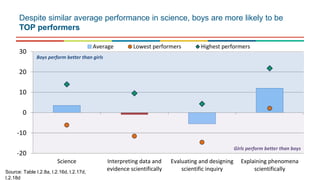

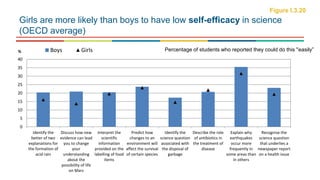
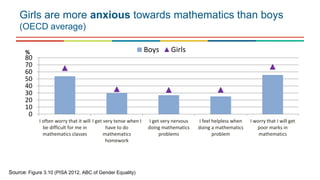
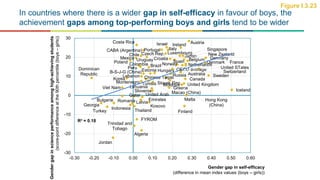
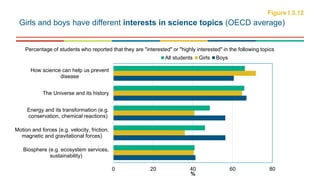
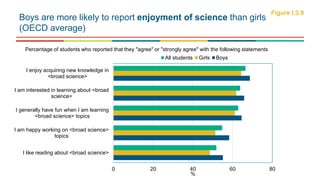


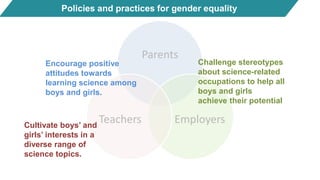

The document analyzes gender differences in educational attainment and performance, highlighting that the educational gender gap was effectively closed in the industrialized world by the 1960s. It reveals that while girls are more likely to report low self-efficacy in science and experience anxiety towards mathematics, boys tend to perform better in science, particularly at higher achievement levels. Furthermore, it emphasizes the need for targeted efforts from parents, teachers, and employers to address these disparities and inspire careers in STEM fields among both genders.


