Downloaded 269 times

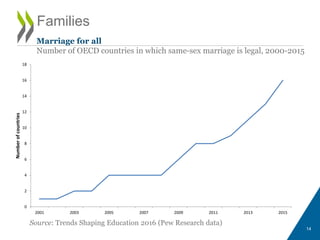
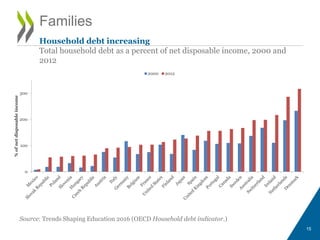
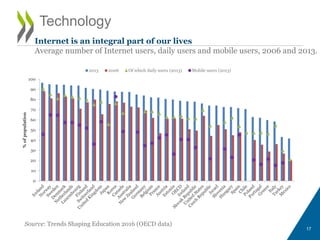

The document outlines trends shaping education in 2016, focusing on globalisation, the changing role of nation-states, urbanization, family dynamics, and technological advancements. It emphasizes the importance of data that is robust and internationally comparable, without providing policy prescriptions. Highlights include economic disparities, demographic shifts, and the impact of technology on society.


