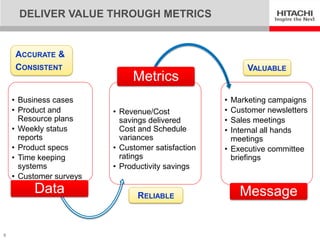
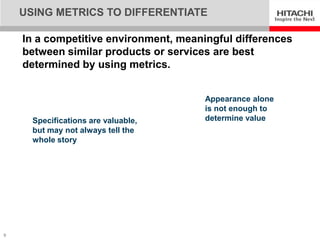
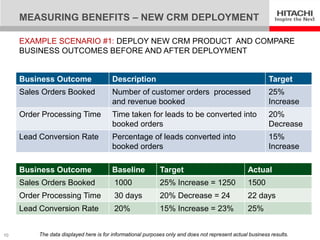
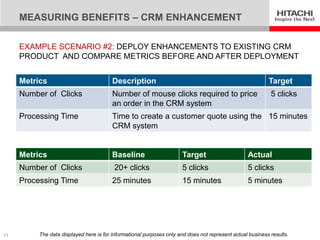
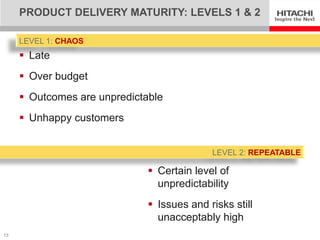
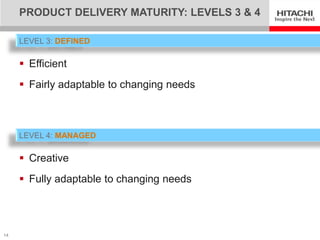
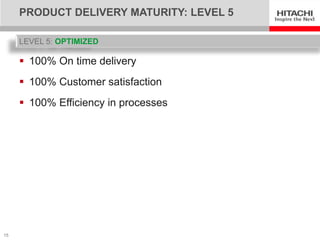
BENEFITS REALIZATION:
THE COMPETITIVE
ADVANTAGE
    PRASHANTH NAIDU
    AUGUST 1, 2012
1                       © 2011 Hitachi Data Systems. All rights reserved.
INTRODUCING HITACHI DATA SYSTEMS

                                                 Ranked # 140 for Innovation in 2010


        Formed in 1989 as a subsidiary of Hitachi, Ltd. (NYSE: HIT)
        Direct and indirect sales in 100+ countries and regions
        5,000+ employees, worldwide
        Focus: Information technologies, services, & solutions
        Recognized industry leader


                         Excellence in Customer Service Awards


2
PHILOSOPHY ON GOALS AND PRIORITIES

    Life Example


    School
              Job


    Work Example

                                           Corporate Success


                    Schedule

             ROI

    Cost

3
PORTFOLIO MANAGEMENT IS STRATEGIC


                          Strategic       Benefits
     Governance:         Alignment       Measurement
      Business council                                    Governance:
                                           Are we          Executive
     Tools: Portfolio,     Are we
                           doing the       getting         Council
      Business case
                              right       measurable      Tools: Value
                            things?        value?          maps, Program
                                                           metrics


                            Are we          Are we
                          doing them        getting      Governance:
     Governance:          the right
      Release                             them done?      Project Steering
                             way?                         Committee
      Management
      Council             Architecture    Project        Tools: Status
     Tools: Project      and Approvals   Efficiency      reports, Project
      gate checklist                                      time system


4
PORTFOLIO MANAGEMENT IS PROCESS


           1. New
           Request
                                            2. Proposal


                                                          Collect
                                                          Metrics

                      3. Council Approval


    4. Investments
                                              6. Closed
    In Flight


                     5. Steering
5                    Committee Review
GOVERNANCE MODEL IS KEY


                    Review business cases;     Set priorities and
                     approve/reject projects     guidelines; approve or
                    Funding: external spend     reject projects
    Strategic        for projects               Funding: cross functional      Benefits
    Alignment       Members: business unit      and large investments       Measurement
                     leaders                    Members: executives
                    Meets: Monthly             Meets: Quarterly


                   Business                    Executive
                   Council                     Council


                      Review gates and           Review project health
                       deliverables                and new projects
                      Members: project           Funding: internal
    Architecture       managers, support           initiatives                 Project
    Approvals          staff, architects          Members: department       Efficiency
                      Meets: Weekly               heads
                                                  Meets: Weekly
                   Release
                                               Steering
                   Management
                                               Committee
                   Committee
6
FOCUS ON MEASUREABLE RESULTS


          Executive Directive
           Ensure all investments document measurable benefits
           Present all approved investments to the Executive Council


               Benefits Quantified
                 Revenue Growth ($)           Revenue Impact ($)
                 Cost Savings ($)             Cost Avoidance ($)
                                               Productivity Savings ($)


          Benefits Measurement
             Metrics designed to measure benefits after deployment
             Ownership and frequency defined for metrics collection
             Benefit measurements compared against business case
             Results reported back to executives and stakeholders
7
DELIVER VALUE THROUGH METRICS


    ACCURATE &
    CONSISTENT                                           VALUABLE
                              Metrics
    • Business cases                               • Marketing campaigns
    • Product and        • Revenue/Cost            • Customer newsletters
      Resource plans       savings delivered       • Sales meetings
    • Weekly status        Cost and Schedule       • Internal all hands
      reports              variances                 meetings
    • Product specs      • Customer satisfaction   • Executive committee
    • Time keeping         ratings                   briefings
      systems            • Productivity savings
    • Customer surveys
         Data                  RELIABLE                Message

8
USING METRICS TO DIFFERENTIATE

    In a competitive environment, meaningful differences
    between similar products or services are best
    determined by using metrics.


                                       Appearance alone
                                       is not enough to
      Specifications are valuable,     determine value
      but may not always tell the
      whole story


9
MEASURING BENEFITS – NEW CRM DEPLOYMENT

     EXAMPLE SCENARIO #1: DEPLOY NEW CRM PRODUCT AND COMPARE
     BUSINESS OUTCOMES BEFORE AND AFTER DEPLOYMENT


     Business Outcome                    Description                                                       Target
     Sales Orders Booked                 Number of customer orders processed                               25%
                                         and revenue booked                                                Increase
     Order Processing Time               Time taken for leads to be converted into                         20%
                                         booked orders                                                     Decrease
     Lead Conversion Rate                Percentage of leads converted into                                15%
                                         booked orders                                                     Increase

     Business Outcome                    Baseline            Target                               Actual
     Sales Orders Booked                 1000                25% Increase = 1250                  1500
     Order Processing Time               30 days             20% Decrease = 24                    22 days
     Lead Conversion Rate                20%                 15% Increase = 23%                   25%


10        The data displayed here is for informational purposes only and does not represent actual business results.
MEASURING BENEFITS – CRM ENHANCEMENT

     EXAMPLE SCENARIO #2: DEPLOY ENHANCEMENTS TO EXISTING CRM
     PRODUCT AND COMPARE METRICS BEFORE AND AFTER DEPLOYMENT


     Metrics                             Description                                                       Target
     Number of Clicks                    Number of mouse clicks required to price                           5 clicks
                                         an order in the CRM system
     Processing Time                     Time to create a customer quote using the 15 minutes
                                         CRM system


     Metrics                             Baseline                     Target                      Actual
     Number of Clicks                    20+ clicks                   5 clicks                    5 clicks
     Processing Time                     25 minutes                   15 minutes                  5 minutes


11        The data displayed here is for informational purposes only and does not represent actual business results.
MOBILE APPLICATION: VALUE MAP


                                       Faster Response to     Increased Customer
                                       Customer Inquiries         Satisfaction
                Real-time Access to
                 Sales Information

                                       Increased Sales Rep     Increased Booked
                                       Productivity Savings          Orders

 Sales Mobile
 App Released

                                        Reduced Calls for       Decreased Sales
                                       Sales Support Center      Support Cost

                New Sales Capability
                     Created
                                                              Increased Innovation
                                         Maximize Use of
                                        Mobile Technology
                                                                Increased Brand
                                                                  Recognition


12
PRODUCT DELIVERY MATURITY: LEVELS 1 & 2

     LEVEL 1: CHAOS
      Late
      Over budget
      Outcomes are unpredictable
      Unhappy customers


                                            LEVEL 2: REPEATABLE

                               Certain level of
                                unpredictability
                               Issues and risks still
                                unacceptably high
13
PRODUCT DELIVERY MATURITY: LEVELS 3 & 4

     LEVEL 3: DEFINED

      Efficient
      Fairly adaptable to changing needs


     LEVEL 4: MANAGED

      Creative
      Fully adaptable to changing needs


14
PRODUCT DELIVERY MATURITY: LEVEL 5

     LEVEL 5: OPTIMIZED

      100% On time delivery
      100% Customer satisfaction
      100% Efficiency in processes


15
IN CLOSING…


      If you try to please everyone, you will fail!
      Keep things simple – the more complicated it gets, the
       less adoption we see
      Follow the 80/20 rule – realize 80% benefit with 20%
       investment


  Learn from the past,                                     Enjoy the
 Set vivid, detailed goals for the future,        Work    journey and
 and live in the only moment of                   Smart     have fun
 time over which you have any control
 …… Now! – Denis Waitley

16

Gaining Competitive Advantage through Benefits Realization

  • 1.
    BENEFITS REALIZATION: THE COMPETITIVE ADVANTAGE PRASHANTH NAIDU AUGUST 1, 2012 1 © 2011 Hitachi Data Systems. All rights reserved.
  • 2.
    INTRODUCING HITACHI DATASYSTEMS Ranked # 140 for Innovation in 2010  Formed in 1989 as a subsidiary of Hitachi, Ltd. (NYSE: HIT)  Direct and indirect sales in 100+ countries and regions  5,000+ employees, worldwide  Focus: Information technologies, services, & solutions  Recognized industry leader Excellence in Customer Service Awards 2
  • 3.
    PHILOSOPHY ON GOALSAND PRIORITIES Life Example School Job Work Example Corporate Success Schedule ROI Cost 3
  • 4.
    PORTFOLIO MANAGEMENT ISSTRATEGIC Strategic Benefits  Governance: Alignment Measurement Business council  Governance: Are we Executive  Tools: Portfolio, Are we doing the getting Council Business case right measurable  Tools: Value things? value? maps, Program metrics Are we Are we doing them getting  Governance:  Governance: the right Release them done? Project Steering way? Committee Management Council Architecture Project  Tools: Status  Tools: Project and Approvals Efficiency reports, Project gate checklist time system 4
  • 5.
    PORTFOLIO MANAGEMENT ISPROCESS 1. New Request 2. Proposal Collect Metrics 3. Council Approval 4. Investments 6. Closed In Flight 5. Steering 5 Committee Review
  • 6.
    GOVERNANCE MODEL ISKEY  Review business cases;  Set priorities and approve/reject projects guidelines; approve or  Funding: external spend reject projects Strategic for projects  Funding: cross functional Benefits Alignment  Members: business unit and large investments Measurement leaders  Members: executives  Meets: Monthly  Meets: Quarterly Business Executive Council Council  Review gates and  Review project health deliverables and new projects  Members: project  Funding: internal Architecture managers, support initiatives Project Approvals staff, architects  Members: department Efficiency  Meets: Weekly heads  Meets: Weekly Release Steering Management Committee Committee 6
  • 7.
    FOCUS ON MEASUREABLERESULTS Executive Directive  Ensure all investments document measurable benefits  Present all approved investments to the Executive Council Benefits Quantified  Revenue Growth ($)  Revenue Impact ($)  Cost Savings ($)  Cost Avoidance ($)  Productivity Savings ($) Benefits Measurement  Metrics designed to measure benefits after deployment  Ownership and frequency defined for metrics collection  Benefit measurements compared against business case  Results reported back to executives and stakeholders 7
  • 8.
    DELIVER VALUE THROUGHMETRICS ACCURATE & CONSISTENT VALUABLE Metrics • Business cases • Marketing campaigns • Product and • Revenue/Cost • Customer newsletters Resource plans savings delivered • Sales meetings • Weekly status Cost and Schedule • Internal all hands reports variances meetings • Product specs • Customer satisfaction • Executive committee • Time keeping ratings briefings systems • Productivity savings • Customer surveys Data RELIABLE Message 8
  • 9.
    USING METRICS TODIFFERENTIATE In a competitive environment, meaningful differences between similar products or services are best determined by using metrics. Appearance alone is not enough to Specifications are valuable, determine value but may not always tell the whole story 9
  • 10.
    MEASURING BENEFITS –NEW CRM DEPLOYMENT EXAMPLE SCENARIO #1: DEPLOY NEW CRM PRODUCT AND COMPARE BUSINESS OUTCOMES BEFORE AND AFTER DEPLOYMENT Business Outcome Description Target Sales Orders Booked Number of customer orders processed 25% and revenue booked Increase Order Processing Time Time taken for leads to be converted into 20% booked orders Decrease Lead Conversion Rate Percentage of leads converted into 15% booked orders Increase Business Outcome Baseline Target Actual Sales Orders Booked 1000 25% Increase = 1250 1500 Order Processing Time 30 days 20% Decrease = 24 22 days Lead Conversion Rate 20% 15% Increase = 23% 25% 10 The data displayed here is for informational purposes only and does not represent actual business results.
  • 11.
    MEASURING BENEFITS –CRM ENHANCEMENT EXAMPLE SCENARIO #2: DEPLOY ENHANCEMENTS TO EXISTING CRM PRODUCT AND COMPARE METRICS BEFORE AND AFTER DEPLOYMENT Metrics Description Target Number of Clicks Number of mouse clicks required to price 5 clicks an order in the CRM system Processing Time Time to create a customer quote using the 15 minutes CRM system Metrics Baseline Target Actual Number of Clicks 20+ clicks 5 clicks 5 clicks Processing Time 25 minutes 15 minutes 5 minutes 11 The data displayed here is for informational purposes only and does not represent actual business results.
  • 12.
    MOBILE APPLICATION: VALUEMAP Faster Response to Increased Customer Customer Inquiries Satisfaction Real-time Access to Sales Information Increased Sales Rep Increased Booked Productivity Savings Orders Sales Mobile App Released Reduced Calls for Decreased Sales Sales Support Center Support Cost New Sales Capability Created Increased Innovation Maximize Use of Mobile Technology Increased Brand Recognition 12
  • 13.
    PRODUCT DELIVERY MATURITY:LEVELS 1 & 2 LEVEL 1: CHAOS  Late  Over budget  Outcomes are unpredictable  Unhappy customers LEVEL 2: REPEATABLE  Certain level of unpredictability  Issues and risks still unacceptably high 13
  • 14.
    PRODUCT DELIVERY MATURITY:LEVELS 3 & 4 LEVEL 3: DEFINED  Efficient  Fairly adaptable to changing needs LEVEL 4: MANAGED  Creative  Fully adaptable to changing needs 14
  • 15.
    PRODUCT DELIVERY MATURITY:LEVEL 5 LEVEL 5: OPTIMIZED  100% On time delivery  100% Customer satisfaction  100% Efficiency in processes 15
  • 16.
    IN CLOSING…  If you try to please everyone, you will fail!  Keep things simple – the more complicated it gets, the less adoption we see  Follow the 80/20 rule – realize 80% benefit with 20% investment Learn from the past, Enjoy the Set vivid, detailed goals for the future, Work journey and and live in the only moment of Smart have fun time over which you have any control …… Now! – Denis Waitley 16