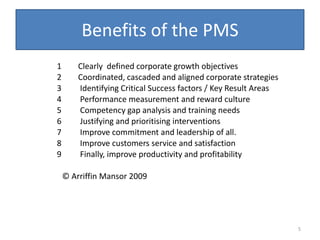
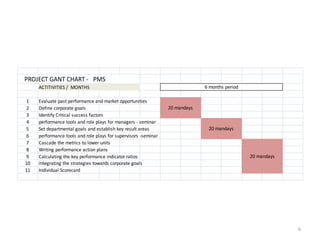
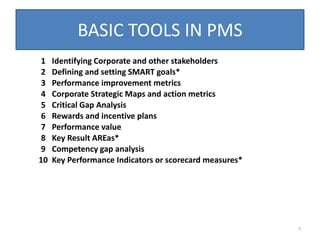
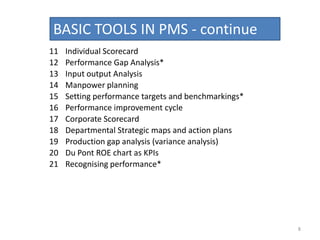
Installing the performance
management system in MOCCIS
         Arriffin Mansor
              ©2009


                               1
Contents of this proposal
• What is performance management system
  and its benefits.
• The PMS development steps and its Gantt
  Chart.
• What you get with the PMS we install
  – Corporate planning
  – Performance planning
  – Performance appraisal

                                            2
Contents - continue
• What other benefits
  – Individual performance card
  – Compensation based on performance
  – Improvement in Training Management
• Who are we?
• Our unique selling proposition
• Our proposed fee


                                         3
What is PMS
• A system of participative management where
  efficiency measures are installed at all
  management levels and for all processes in
  the organisation with the ultimate objective of
  getting maximum results.


                                                4
Benefits of the PMS
1       Clearly defined corporate growth objectives
2       Coordinated, cascaded and aligned corporate strategies
3       Identifying Critical Success factors / Key Result Areas
4       Performance measurement and reward culture
5       Competency gap analysis and training needs
6       Justifying and prioritising interventions
7       Improve commitment and leadership of all.
8       Improve customers service and satisfaction
9       Finally, improve productivity and profitability

    © Arriffin Mansor 2009


                                                                  5
PROJECT GANT CHART - PMS
     ACTITIVITIES / MONTHS                                                    6 months period

 1   Evaluate past performance and market opportunities
 2   Define corporate goals                                      20 mandays
 3   Identify Critical success factors
 4   performance tools and role plays for managers - seminar
 5   Set departmental goals and establish key result areas                     20 mandays
 6   performance tools and role plays for supervisors -seminar
 7   Cascade the metrics to lower units
 8   Writing performance action plans
 9   Calculating the key performance indicator ratios                                           20 mandays
10   integrating the strategies towards corporate goals
11   Individual Scorecard


                                                                                                             6
BASIC TOOLS IN PMS
 1   Identifying Corporate and other stakeholders
 2   Defining and setting SMART goals*
 3   Performance improvement metrics
 4   Corporate Strategic Maps and action metrics
 5   Critical Gap Analysis
 6   Rewards and incentive plans
 7   Performance value
 8   Key Result AREas*
 9   Competency gap analysis
10   Key Performance Indicators or scorecard measures*


                                                         7
BASIC TOOLS IN PMS - continue
11   Individual Scorecard
12   Performance Gap Analysis*
13   Input output Analysis
14   Manpower planning
15   Setting performance targets and benchmarkings*
16   Performance improvement cycle
17   Corporate Scorecard
18   Departmental Strategic maps and action plans
19   Production gap analysis (variance analysis)
20   Du Pont ROE chart as KPIs
21   Recognising performance*


                                                      8
Who are we?
• ABM consult is a firm headed by Dr Arriffin
  Mansor
• He has associate consultants who are involved
  in other consultancy projects plus those
  teaching at various universities and Excel
  College of which he is the chairman.
• Dr Arriffin lectures on performance
  management at public and in house programs.

                                              9
Our unique selling proposition
• Our performance analysis is in simple graphic
  input output analysis.
• 90% of our proposed KPIs are drawn from the
  financial system of the company.
• Our Performance Improvement matrix shall
  be used at all levels in the organisation.
• The Du Pont return on equity template shall
  be used to diagnose for SWOT.

                                                  10
Our unique selling proposition
• We use financial information as a basis of our
  key performance indicators.
• We use excel based templates which could be
  applied by all staff.
• Our input output graphic analysis enable true
  performance analysis.
• Our system installation information is
  uploaded in the internet for easy on line
  reference.
                                                   11
What is corporate planning?
• Setting clear corporate objectives and goals with
  the metric network linking the 4 key departments
• Agreeing on the strategic maps linking the 4 BSC
  perspectives
• Setting the basic strategies in terms of Du Pont
  Return on equity format where marketing,
  working and fixed capital strategies are
  highlighted.
• Resource planning and sourcing
                                                  12
What is performance planning
•   Setting objective and goals for all working unit
•   Identifying key result areas
•   Identifying key performance indicators
•   Identifying the right stakeholders.
•   Establishing performance targets
•   Implement the performance action plans


                                                   13
What is Performance Appraisal
• Monitoring and recording performance
• Evaluate and analyse performance gaps
• Key Performance Indicators as performance
  measures
• Identify true performance and justify
  intervention costs
• Recognise and reward performance


                                              14
Strategy Map: Capture a Cause Effect
   Relationship from the Bottom Up
 Stakeholder


                                                                                   More rapid and
                                              Improved Returns on
                                                                                  accessible services
                                                  Investments
 Internal Process


                      Economic Model              Reduce Re-Activities thru             Establish Web Based
                          Process                         ABC/M                             Self Services
& Growth
Learning


                             Expand Global                           Leadership                           Knowledge
                             Facility Reach                         Development                          Management
        Investments


                          Facilities and Fixed                                              IT Infrastructure
                                  Assets                      Human Capital


                                                                                                                      15
Key Benefits of Strategy Maps

• Articulates how the organization creates value for its constituents and
  legitimizing authority
• Displays key priorities and relationships between outcomes (the "what") and
  performance enablers or drivers (the "how")
• Provides a clear view of "how I fit in" for sub-organizations, teams, and
  individuals
• "Cascading the scorecard throughout the organization, and clearly mapping
  the various units and functions back to the organization or agency-wide map
  is critical to leveraging and ensuring alignment"


                                                                           16
Extend the Map into Measurements,
                                   Targets, key result areas and Initiatives


                            Strategy Map
Stakeholder


                                                          Detailed statement          How success in       The level of      Key action
                      Faster Service Access               of what is critical to       achieving the     performance or      programs
                                                              successfully            strategy will be       rate of        required to
                                                             achieving the            measured and        improvement         achieve
                                                                strategy                  tracked            needed          objectives
                    Self Service
                    Applications
Internal Process


                                                           Objective
                                                                                        Measure               Target          Initiative
                                       Lean Processes      Description
                                                        Eliminate waste,           Number of Reworks     2 per setup per   Lean / Six Sigma
                                                        reworks, and other                               month each
                   Process and Value                    errors in our                                    Outlet Office
                     Map Analysis                       processes


                              Web Enable
L&G


                              Technologies
  Investments


                                         Invest in IT
Alignment of Scorecard Components

 Make sure the components of your scorecard fit together. We want to create a tight
                  model for driving execution of your strategy.

  Goal /          Key Result        Measurement            Target           Initiative
 Objective          Areas

                Profit Margin            Key
               Asset Turnover        Performance
                                                                            Increase
                                     Indicators =       ROE = 40%
               Equity Multiplier                                            leverage
                                      Return on
Maximizes
                                        Equity
Return on
Equity
                                                                          Outsourcing
                                                                           to reduce
                                                                             costs


                                                                                      18
Examples of Measurements by Perspective

Stakeholder / Customer                          Internal Processes
 • Current customer satisfaction level          • Number of unscheduled maintenance calls
 • Improvement in customer satisfaction         • Production time lost because of maintenance
 • Customer retention rate                        problems
 • Frequency of customer contact by customer    • Percentage of equipment maintained on schedule
   service                                      • Average number of monthly unscheduled outages
 • Average time to resolve a customer inquiry   • Mean time between failures
 • Number of customer complaints


Learning and Growth                             Investments
 •   Percentage employee absenteeism              •   % of facility assets fully funded for upgrading
 •   Hours of absenteeism                         •   % of IT infrastructure investments approved
 •   Job posting response rate                    •   # of new hire positions authorized for filling
 •   Personnel turnover rate                      •   % of required contracts awarded and in place
 •   Ratio of acceptances to offers
 •   Time to fill vacancy


                                                                                                        19
Types of Measurements

Measure Type                   Definition                                  Example
                   Intermediate outcomes that predicts or
  Leading                                                            Employee turnover rate
                    drive bottom-line performance results

                Bottom-line performance results resulting
  Lagging                                                          Employee satisfaction rating
                           from actions taken

                Amount of Investments, assets, equipment,
    Input                                                               Number of cashiers
                   labor hours, or budget dollars used

                 Units of a product or service rendered - a
   Output                                                      Number of Value Meal orders fulfilled
                              measure of yield

                  Resulting effect (benefit) of the use or
  Outcome                                                          Customer satisfaction rating
                         application of an output

 Objective /       Empirical indicators of performance                      Wait time
 Quantitative
 Subjective /     Perceptions and evaluations of major        Customer complaints received as a % of
 Qualitative          customers and stakeholders                     total customers served

                                                                                                       20
The Measurement Pyramid

                                             Goal
Strategic/GPRA Goals
End-Outcomes                              Outcome
                                         Performance
                                          Measures
Longer-Term Intermediate                   Program
Outcomes
                                Program Performance Measures

Shorter-Term                       Program Components
Intermediate
Outcomes                   Program Component Performance Measures
& Outputs

Outputs                                   Activities
& Inputs
                                 Activity Performance Measures
                                                                    21
Some Tools for Determining
    What to Measure
                     Program Logic Model

          Process/                   Intermediate           End
Inputs     System       Output         Outcomes           Outcome


                                                Process Flow
Causal Analysis
                                                    Prototype
                                                     Product

              Desired
              Outcome              Acceptable                   Not Acceptable
                                                     Results
                                                                       Back to
                                 To Market             Of
                                                                      Laboratory
                                                     Testing


                                                                                 22
Corporate Goals
                       Sa le s
               $       1,689,429,000

                 Cost of Goods
               Sold + Ex tra Ta x e s       Ne t Profits
               $       384,153,000          Afte r Ta x e s
                                        $      358,612,000        Ne t Profit
                     Ope ra ting                                   Ma rgin
 Income              Ex pe nse s                                   21.23%
Sta te me nt   $         731,891,000                              NI/SALES
                                              Sa le s                                       Re turn on
                     Inte re st         $    1,689,429,000                                 Tota l Asse ts
                     Ex pe nse                                                                (ROA)
               $         13,641,000                                                          26.17%
                                                                                           NPM X TAT
                       Ta x e s
               $         201,132,000          Sa le s
                                        $    1,689,429,000       Tota l Asse t
                                                                  Turnove r
                                                                    1.23                                      Re turn on
                      Curre nt                                   SALES/TA                                    Equity (ROE)
                      Asse ts                                                                                  33.96%
               $        709,360,000         Tota l Asse ts                                                   ROA X FLM
                                        $    1,370,157,000
                     Ne t Fix e d
                   Asse ts & Othe r                             Stockholde rs'
               $          660,797,000                              Equity
 Ba la nce                                                    $   1,055,920,000            Fina ncia l
  She e t             Curre nt                                                             Le ve ra ge
                     Lia bilitie s                                                       Multiplie r (FLM)
               $         265,661,000           Tota l                                          1.30
                                             Lia bilitie s     Tota l Lia bilitie s       TA/EQUITY
                    Long Te rm          $      314,237,000     & Stockholde rs'
                      De bt                                     Equity = Tota l
               $          3,270,000                                  Asse ts
                                          Stockholde rs       $   1,370,157,000
                       Othe r                Equity
                     Lia bilitie s      $   1,055,920,000
               $           45,306,000


                                                                                      Du pont ROE Chart
                                                                                                                            23
How to Set Targets
•   Past performance trends per historical data.
•   Performance levels of similar organizational units at a
    comparable level that facilitates benchmarking.
•   Best practices across the agency, the public sector or the
    private sector. Must be at a pre-existing high level of
    performance before you use this approach.
•   For newly launched services, may have to establish a
    baseline per a prototype test and extend out from this
    point forward.
•   For major strategic shifts, may have to set directly per the
    plan itself without regard for hard data.


                                                                   24
Checklist for Setting Targets

• Targets match up with measurements, one to one.
• Targets require improving current levels of performance.
• Targets are a stretch, but achievable: they may require
  improvements to existing processes.
• Targets are quantifiable so that the target communicates if
  the expected performance was met.
• Long-term targets are established before short-term targets.
• Financial/Budget related targets are established before non-
  financial targets.


                                                                 25
Our services include
• Providing training services for all managment
  and staff on the proposed PMS.
• Helping the CEO in preparing the performance
  corporate plans.
• Coach and guide managers and staff to
  prepare their own performance cards.
• Coach and guide managers and staff in
  performance evaluation.

                                              26
PERFORMANCE MEETINGS

(Boss subordinate meetings and relationship)
1. Begin with goal setting with performance action plans
2. Progress with performance monitoring and
   coaching
3. End with performance analysis, evaluation and
   appraisal
4. Recognition and reinforcement with rewards and
   promotion


                                                       27
FORMS USED IN PMS
     (assist practitioners in the application of the PMS)
1    Writing objectives on smart - stackholders
2    Key Result Areas - how to identify the right
3    Key Performance Indicators - chose the right KPIs
4    The 4 phases of the value chain
5    Performance Targets / standards / Past achievement
6    Gap Analysis - to separate the impact of volume and efficiency
7    Performance Planning meeting
8    Performance Review meeting
9    Strategic Map and Action Metrics for supervisors and managers.
10   Improvement metrix
11   TNA through cause effect ralationship of the 4 perspective
12   Marketing matrix
13   Production matrix           to be filled by the respective departmental
14   Finance Matrix                                   staff
15   HR Matrix
16   Individual scorecard - Managers
17   Individual scorecard - Supervisors
18   Individual scorecard - Staff
                                                                               28
     © Arriffin Mansor 2009
PERFORMANCE ANALYSIS


                       29
24 hours communication
          with our consultants
• Our handphone is open 24 hours
• Our gmail is available 24 hours
• Written group discussions through
  yahoogroups on line real time
• Written groups discussions where video and
  photographs are displayed through ning
  groups.
• Our blogspot internet reference materials
                                               30
Our Reading materials available
         at blogspot
    1 The importance of performance measures
    2 The corporate performance structures
    3 Performance perspectives metrics
    4 Cascading the metrics
    5 Input output analysis
    6 The key performance indicators
    7 The key departmental metrics


                                               31
PMS basic tools
• Writing clear performance objectives and
  goals
• Identifying key result areas
• Setting challenging performance targets
• Choosing the right key performance indicators
• Evaluate performance precisely for
  recognition and improvement.
• Participation and teamwork is the culture
                                              32
Performance Management is a System
           where ..........
• Performance planning are more quantified
  and proper measures put in place.
• Participation and commitment are the
  attitude and culture of the organisation.
• Key attention areas are identified and
  forcused.
• Performance reviews and appraisal are
  objective.
• Performance improvement is continuous.
                                              33
PERFORMANCE MANAGEMENT

• Setting Clear
                                Measures           • Performance gap
  Objectives and goals                               analysis
                           • CHoosing suitable
• Identifying key result     key performance       • Recognising and
  Areas                      indicators              measuring
                                                     performance
                           • Setting performance
                             targets
       Planning                                          Evaluate


                                                                       34
The PMS has 5 key activities
            corporate performance and
                  strategy review


       Workshop on basic performance tools


       Cascading goals and Strategic Mapping


        Performance planning for each staff


        Performance Appraisal for each staff


                                               35
Critical Gaps


                                                                             New Corporate
                Evaluation
                                                                               Directions


                                                                                              Smart Goals
Action Plans
                                                                                              and Targets

                                          Performance
                                         Improvement


     Targets and                     © Arriffin Mansor 012-2786282                       Key Result
    benchmarkings                                                                          Areas


                             Strategic
                                                              Etablish KPI
                             Mapping
Performance Improvement

                                   Business
                                   objectives     Critical
                                                  Success
              Change
                                                  Factors

                             design strategic
                            programs

Performance                                              Key Result
  Actuals                                                  Areas


               Strategic                         Performance
              initiatives                         Indicators

                                   Performance
                                    standards
                                                                      37
Benefits of PMS
• Management by objective
• Continous improvement attitude and culture
• Best practices, problem solving and
  innovative solutions
• Leadership development with learning,
  training, coaching and mentoring.
• Objective appraisal and fair reward
  management.
                                               38
The staff shall learn the following:-
• Able to understand and write his own
  performance card
• Able to appraise own before discussing with
  the boss
• Able to participate in setting own goals and
  objectives
• Participate in searching for the right key result
  areas and solutions.
• Linking his performance with that of his boss
                                                  39
Our proposed fee structure
 – Seminar Fees RM3,500 x 2 days x 1 time =
   RM7,000
 – Corporate Planning 10 days x RM2,500 =
   RM25,000
 – Performance planning 10 days x RM2,500 =
   RM25,000
 – Performance Appraisal 10 days x RM2,500 =
   RM25,000
 – TOTAL= RM82,000

                                               40
Thank you for giving us the
   opportunity to serve your
          organisation.
Dr Arriffin could be contactable
         at 012-2786282
      arriffin@gmail.com

                                   41

Install pms in moccis - a proposal

  • 1.
    Installing the performance managementsystem in MOCCIS Arriffin Mansor ©2009 1
  • 2.
    Contents of thisproposal • What is performance management system and its benefits. • The PMS development steps and its Gantt Chart. • What you get with the PMS we install – Corporate planning – Performance planning – Performance appraisal 2
  • 3.
    Contents - continue •What other benefits – Individual performance card – Compensation based on performance – Improvement in Training Management • Who are we? • Our unique selling proposition • Our proposed fee 3
  • 4.
    What is PMS •A system of participative management where efficiency measures are installed at all management levels and for all processes in the organisation with the ultimate objective of getting maximum results. 4
  • 5.
    Benefits of thePMS 1 Clearly defined corporate growth objectives 2 Coordinated, cascaded and aligned corporate strategies 3 Identifying Critical Success factors / Key Result Areas 4 Performance measurement and reward culture 5 Competency gap analysis and training needs 6 Justifying and prioritising interventions 7 Improve commitment and leadership of all. 8 Improve customers service and satisfaction 9 Finally, improve productivity and profitability © Arriffin Mansor 2009 5
  • 6.
    PROJECT GANT CHART- PMS ACTITIVITIES / MONTHS 6 months period 1 Evaluate past performance and market opportunities 2 Define corporate goals 20 mandays 3 Identify Critical success factors 4 performance tools and role plays for managers - seminar 5 Set departmental goals and establish key result areas 20 mandays 6 performance tools and role plays for supervisors -seminar 7 Cascade the metrics to lower units 8 Writing performance action plans 9 Calculating the key performance indicator ratios 20 mandays 10 integrating the strategies towards corporate goals 11 Individual Scorecard 6
  • 7.
    BASIC TOOLS INPMS 1 Identifying Corporate and other stakeholders 2 Defining and setting SMART goals* 3 Performance improvement metrics 4 Corporate Strategic Maps and action metrics 5 Critical Gap Analysis 6 Rewards and incentive plans 7 Performance value 8 Key Result AREas* 9 Competency gap analysis 10 Key Performance Indicators or scorecard measures* 7
  • 8.
    BASIC TOOLS INPMS - continue 11 Individual Scorecard 12 Performance Gap Analysis* 13 Input output Analysis 14 Manpower planning 15 Setting performance targets and benchmarkings* 16 Performance improvement cycle 17 Corporate Scorecard 18 Departmental Strategic maps and action plans 19 Production gap analysis (variance analysis) 20 Du Pont ROE chart as KPIs 21 Recognising performance* 8
  • 9.
    Who are we? •ABM consult is a firm headed by Dr Arriffin Mansor • He has associate consultants who are involved in other consultancy projects plus those teaching at various universities and Excel College of which he is the chairman. • Dr Arriffin lectures on performance management at public and in house programs. 9
  • 10.
    Our unique sellingproposition • Our performance analysis is in simple graphic input output analysis. • 90% of our proposed KPIs are drawn from the financial system of the company. • Our Performance Improvement matrix shall be used at all levels in the organisation. • The Du Pont return on equity template shall be used to diagnose for SWOT. 10
  • 11.
    Our unique sellingproposition • We use financial information as a basis of our key performance indicators. • We use excel based templates which could be applied by all staff. • Our input output graphic analysis enable true performance analysis. • Our system installation information is uploaded in the internet for easy on line reference. 11
  • 12.
    What is corporateplanning? • Setting clear corporate objectives and goals with the metric network linking the 4 key departments • Agreeing on the strategic maps linking the 4 BSC perspectives • Setting the basic strategies in terms of Du Pont Return on equity format where marketing, working and fixed capital strategies are highlighted. • Resource planning and sourcing 12
  • 13.
    What is performanceplanning • Setting objective and goals for all working unit • Identifying key result areas • Identifying key performance indicators • Identifying the right stakeholders. • Establishing performance targets • Implement the performance action plans 13
  • 14.
    What is PerformanceAppraisal • Monitoring and recording performance • Evaluate and analyse performance gaps • Key Performance Indicators as performance measures • Identify true performance and justify intervention costs • Recognise and reward performance 14
  • 15.
    Strategy Map: Capturea Cause Effect Relationship from the Bottom Up Stakeholder More rapid and Improved Returns on accessible services Investments Internal Process Economic Model Reduce Re-Activities thru Establish Web Based Process ABC/M Self Services & Growth Learning Expand Global Leadership Knowledge Facility Reach Development Management Investments Facilities and Fixed IT Infrastructure Assets Human Capital 15
  • 16.
    Key Benefits ofStrategy Maps • Articulates how the organization creates value for its constituents and legitimizing authority • Displays key priorities and relationships between outcomes (the "what") and performance enablers or drivers (the "how") • Provides a clear view of "how I fit in" for sub-organizations, teams, and individuals • "Cascading the scorecard throughout the organization, and clearly mapping the various units and functions back to the organization or agency-wide map is critical to leveraging and ensuring alignment" 16
  • 17.
    Extend the Mapinto Measurements, Targets, key result areas and Initiatives Strategy Map Stakeholder Detailed statement How success in The level of Key action Faster Service Access of what is critical to achieving the performance or programs successfully strategy will be rate of required to achieving the measured and improvement achieve strategy tracked needed objectives Self Service Applications Internal Process Objective Measure Target Initiative Lean Processes Description Eliminate waste, Number of Reworks 2 per setup per Lean / Six Sigma reworks, and other month each Process and Value errors in our Outlet Office Map Analysis processes Web Enable L&G Technologies Investments Invest in IT
  • 18.
    Alignment of ScorecardComponents Make sure the components of your scorecard fit together. We want to create a tight model for driving execution of your strategy. Goal / Key Result Measurement Target Initiative Objective Areas Profit Margin Key Asset Turnover Performance Increase Indicators = ROE = 40% Equity Multiplier leverage Return on Maximizes Equity Return on Equity Outsourcing to reduce costs 18
  • 19.
    Examples of Measurementsby Perspective Stakeholder / Customer Internal Processes • Current customer satisfaction level • Number of unscheduled maintenance calls • Improvement in customer satisfaction • Production time lost because of maintenance • Customer retention rate problems • Frequency of customer contact by customer • Percentage of equipment maintained on schedule service • Average number of monthly unscheduled outages • Average time to resolve a customer inquiry • Mean time between failures • Number of customer complaints Learning and Growth Investments • Percentage employee absenteeism • % of facility assets fully funded for upgrading • Hours of absenteeism • % of IT infrastructure investments approved • Job posting response rate • # of new hire positions authorized for filling • Personnel turnover rate • % of required contracts awarded and in place • Ratio of acceptances to offers • Time to fill vacancy 19
  • 20.
    Types of Measurements MeasureType Definition Example Intermediate outcomes that predicts or Leading Employee turnover rate drive bottom-line performance results Bottom-line performance results resulting Lagging Employee satisfaction rating from actions taken Amount of Investments, assets, equipment, Input Number of cashiers labor hours, or budget dollars used Units of a product or service rendered - a Output Number of Value Meal orders fulfilled measure of yield Resulting effect (benefit) of the use or Outcome Customer satisfaction rating application of an output Objective / Empirical indicators of performance Wait time Quantitative Subjective / Perceptions and evaluations of major Customer complaints received as a % of Qualitative customers and stakeholders total customers served 20
  • 21.
    The Measurement Pyramid Goal Strategic/GPRA Goals End-Outcomes Outcome Performance Measures Longer-Term Intermediate Program Outcomes Program Performance Measures Shorter-Term Program Components Intermediate Outcomes Program Component Performance Measures & Outputs Outputs Activities & Inputs Activity Performance Measures 21
  • 22.
    Some Tools forDetermining What to Measure Program Logic Model Process/ Intermediate End Inputs System Output Outcomes Outcome Process Flow Causal Analysis Prototype Product Desired Outcome Acceptable Not Acceptable Results Back to To Market Of Laboratory Testing 22
  • 23.
    Corporate Goals Sa le s $ 1,689,429,000 Cost of Goods Sold + Ex tra Ta x e s Ne t Profits $ 384,153,000 Afte r Ta x e s $ 358,612,000 Ne t Profit Ope ra ting Ma rgin Income Ex pe nse s 21.23% Sta te me nt $ 731,891,000 NI/SALES Sa le s Re turn on Inte re st $ 1,689,429,000 Tota l Asse ts Ex pe nse (ROA) $ 13,641,000 26.17% NPM X TAT Ta x e s $ 201,132,000 Sa le s $ 1,689,429,000 Tota l Asse t Turnove r 1.23 Re turn on Curre nt SALES/TA Equity (ROE) Asse ts 33.96% $ 709,360,000 Tota l Asse ts ROA X FLM $ 1,370,157,000 Ne t Fix e d Asse ts & Othe r Stockholde rs' $ 660,797,000 Equity Ba la nce $ 1,055,920,000 Fina ncia l She e t Curre nt Le ve ra ge Lia bilitie s Multiplie r (FLM) $ 265,661,000 Tota l 1.30 Lia bilitie s Tota l Lia bilitie s TA/EQUITY Long Te rm $ 314,237,000 & Stockholde rs' De bt Equity = Tota l $ 3,270,000 Asse ts Stockholde rs $ 1,370,157,000 Othe r Equity Lia bilitie s $ 1,055,920,000 $ 45,306,000 Du pont ROE Chart 23
  • 24.
    How to SetTargets • Past performance trends per historical data. • Performance levels of similar organizational units at a comparable level that facilitates benchmarking. • Best practices across the agency, the public sector or the private sector. Must be at a pre-existing high level of performance before you use this approach. • For newly launched services, may have to establish a baseline per a prototype test and extend out from this point forward. • For major strategic shifts, may have to set directly per the plan itself without regard for hard data. 24
  • 25.
    Checklist for SettingTargets • Targets match up with measurements, one to one. • Targets require improving current levels of performance. • Targets are a stretch, but achievable: they may require improvements to existing processes. • Targets are quantifiable so that the target communicates if the expected performance was met. • Long-term targets are established before short-term targets. • Financial/Budget related targets are established before non- financial targets. 25
  • 26.
    Our services include •Providing training services for all managment and staff on the proposed PMS. • Helping the CEO in preparing the performance corporate plans. • Coach and guide managers and staff to prepare their own performance cards. • Coach and guide managers and staff in performance evaluation. 26
  • 27.
    PERFORMANCE MEETINGS (Boss subordinatemeetings and relationship) 1. Begin with goal setting with performance action plans 2. Progress with performance monitoring and coaching 3. End with performance analysis, evaluation and appraisal 4. Recognition and reinforcement with rewards and promotion 27
  • 28.
    FORMS USED INPMS (assist practitioners in the application of the PMS) 1 Writing objectives on smart - stackholders 2 Key Result Areas - how to identify the right 3 Key Performance Indicators - chose the right KPIs 4 The 4 phases of the value chain 5 Performance Targets / standards / Past achievement 6 Gap Analysis - to separate the impact of volume and efficiency 7 Performance Planning meeting 8 Performance Review meeting 9 Strategic Map and Action Metrics for supervisors and managers. 10 Improvement metrix 11 TNA through cause effect ralationship of the 4 perspective 12 Marketing matrix 13 Production matrix to be filled by the respective departmental 14 Finance Matrix staff 15 HR Matrix 16 Individual scorecard - Managers 17 Individual scorecard - Supervisors 18 Individual scorecard - Staff 28 © Arriffin Mansor 2009
  • 29.
  • 30.
    24 hours communication with our consultants • Our handphone is open 24 hours • Our gmail is available 24 hours • Written group discussions through yahoogroups on line real time • Written groups discussions where video and photographs are displayed through ning groups. • Our blogspot internet reference materials 30
  • 31.
    Our Reading materialsavailable at blogspot 1 The importance of performance measures 2 The corporate performance structures 3 Performance perspectives metrics 4 Cascading the metrics 5 Input output analysis 6 The key performance indicators 7 The key departmental metrics 31
  • 32.
    PMS basic tools •Writing clear performance objectives and goals • Identifying key result areas • Setting challenging performance targets • Choosing the right key performance indicators • Evaluate performance precisely for recognition and improvement. • Participation and teamwork is the culture 32
  • 33.
    Performance Management isa System where .......... • Performance planning are more quantified and proper measures put in place. • Participation and commitment are the attitude and culture of the organisation. • Key attention areas are identified and forcused. • Performance reviews and appraisal are objective. • Performance improvement is continuous. 33
  • 34.
    PERFORMANCE MANAGEMENT • SettingClear Measures • Performance gap Objectives and goals analysis • CHoosing suitable • Identifying key result key performance • Recognising and Areas indicators measuring performance • Setting performance targets Planning Evaluate 34
  • 35.
    The PMS has5 key activities corporate performance and strategy review Workshop on basic performance tools Cascading goals and Strategic Mapping Performance planning for each staff Performance Appraisal for each staff 35
  • 36.
    Critical Gaps New Corporate Evaluation Directions Smart Goals Action Plans and Targets Performance Improvement Targets and © Arriffin Mansor 012-2786282 Key Result benchmarkings Areas Strategic Etablish KPI Mapping
  • 37.
    Performance Improvement Business objectives Critical Success Change Factors  design strategic programs Performance Key Result Actuals Areas Strategic Performance initiatives Indicators Performance standards 37
  • 38.
    Benefits of PMS •Management by objective • Continous improvement attitude and culture • Best practices, problem solving and innovative solutions • Leadership development with learning, training, coaching and mentoring. • Objective appraisal and fair reward management. 38
  • 39.
    The staff shalllearn the following:- • Able to understand and write his own performance card • Able to appraise own before discussing with the boss • Able to participate in setting own goals and objectives • Participate in searching for the right key result areas and solutions. • Linking his performance with that of his boss 39
  • 40.
    Our proposed feestructure – Seminar Fees RM3,500 x 2 days x 1 time = RM7,000 – Corporate Planning 10 days x RM2,500 = RM25,000 – Performance planning 10 days x RM2,500 = RM25,000 – Performance Appraisal 10 days x RM2,500 = RM25,000 – TOTAL= RM82,000 40
  • 41.
    Thank you forgiving us the opportunity to serve your organisation. Dr Arriffin could be contactable at 012-2786282 arriffin@gmail.com 41