Download to read offline
![IOSR Journal of Computer Engineering (IOSRJCE)
ISSN: 2278-0661 Volume 4, Issue 5 (Sep.-Oct. 2012), PP 40-49
www.iosrjournals.org
www.iosrjournals.org 40 | Page
A Novel PSNR-B Approach for Evaluating the Quality of
De-blocked Images
Trinadh Tadala1
, Sri E.Venkata Narayana2
1,2
Dept. Of Electronics and communication engineering, University College of Engineering, JNTUK, Kakinada,
East Godavari Dist, Andhra Pradesh, India.
Abstract: JPEG Compression is the most prevalent technique or method for images codecs. But it suffers from
blocking artifacts. In this paper a comparison of the perceptual quality of deblocked images based on various
quality assessments metric is done. A proposed PSNR including blocking effect factor was used instead of
PSNR. Another quality assessment metric SSIM was used which produces results largely in accordance with
PSNR-B. We show the simulation results, which prove PSNR-B produces objective judgments. The efficiency of
deblocking algorithms was studied.
Keywords: Deblocked images, blocking artifacts, quality assessment, quality metric
I. INTRODUCTION
Many practical and commercial systems use digital image compression when it is required to transmit
or store the image over limited resources. JPEG compression is the most popular image compression standard
among all the members of lossy compression standards family. JPEG image coding is based on block based
discrete cosine transform. BDCT coding has been successfully used in image and video compression
applications due to its energy compacting property and relative ease of implementation. After segmenting an
image in to blocks of size N×N, the blocks are independently DCT transformed, quantized, coded and
transmitted. One of the most noticeable degradation of the block transform coding is the “blocking artifact”.
These artifacts appear as a regular pattern of visible block boundaries. This degradation is the result of course
quantization of the coefficients and of the independent processing of the blocks which does not take in to
account the existing correlations among adjacent block pixels [12]. In order to achieve high compression rates
using BTC with visually acceptable results, a procedure known as deblocking is done in order to eliminate
blocking artifacts.
In this paper a research has done on quality assessment of deblocked images by estimating various
quality metrics and the effect of quantization step of the measured quality of deblocked image is studied.
Simulations are done using quality metrics such as peak signal-to-noise ratio (PSNR), structural similarity index
(SSIM) and PSNR-B. PSNR-B is a new quality metric which includes PSNR by a blocking factor. By going
through simulation results, it is shown that PSNR-B correlates well with the SSIM index and subjective quality
and its performance is much better than the PSNR.
II. QUALITY ASSESSMENT & DEBLOCKING
To remove blocking effect, several deblocking techniques have been proposed in the literature as post
process mechanisms after JPEG compression, depending on the angle from which the blocking problem is
tackled. If deblocking is viewed as an estimation problem, the simplest solution is probably just to low pass the
blocky JPEG compressed image. More sophisticated methods involve iterative methods such as projection on
convex sets [3, 4] and constrained least squares [4, 5] In this paper we use deblocking algorithms including
lowpass filtering and projection on to convex sets. The efficiency of these algorithms can be analyzed by
introducing a proposed method in the following section.
In this project We consider the two reference models class of quality assessment (QA) methods that are
full-reference (FR) QA, which compares the test (distorted) image with a reference (original) image., the
distorted images will ostensibly suffer from blocking artifacts or from the residual artifacts.
III. PROPOSED METHOD
Deblocking operation is performed in order to reduce blocking artifacts. Deblocking operation can be
achieved by using various deblocking algorithms, employing deblocking filters. The effects of deblocking
filters can be analyzed by introducing a change in distortion concept.
The deblocking operation results in the enhancement of image quality in some areas, while degrading in other
areas.](https://image.slidesharecdn.com/g0454049-131001011751-phpapp02/85/A-Novel-PSNR-B-Approach-for-Evaluating-the-Quality-of-De-blocked-Images-1-320.jpg)
![IOSR Journal of Computer Engineering (IOSRJCE)
ISSN: 2278-0661 Volume 4, Issue 5 (Sep.-Oct. 2012), PP 40-49
www.iosrjournals.org
www.iosrjournals.org 40 | Page
A Novel PSNR-B Approach for Evaluating the Quality of
De-blocked Images
Trinadh Tadala1
, Sri E.Venkata Narayana2
1,2
Dept. Of Electronics and communication engineering, University College of Engineering, JNTUK, Kakinada,
East Godavari Dist, Andhra Pradesh, India.
Abstract: JPEG Compression is the most prevalent technique or method for images codecs. But it suffers from
blocking artifacts. In this paper a comparison of the perceptual quality of deblocked images based on various
quality assessments metric is done. A proposed PSNR including blocking effect factor was used instead of
PSNR. Another quality assessment metric SSIM was used which produces results largely in accordance with
PSNR-B. We show the simulation results, which prove PSNR-B produces objective judgments. The efficiency of
deblocking algorithms was studied.
Keywords: Deblocked images, blocking artifacts, quality assessment, quality metric
I. INTRODUCTION
Many practical and commercial systems use digital image compression when it is required to transmit
or store the image over limited resources. JPEG compression is the most popular image compression standard
among all the members of lossy compression standards family. JPEG image coding is based on block based
discrete cosine transform. BDCT coding has been successfully used in image and video compression
applications due to its energy compacting property and relative ease of implementation. After segmenting an
image in to blocks of size N×N, the blocks are independently DCT transformed, quantized, coded and
transmitted. One of the most noticeable degradation of the block transform coding is the “blocking artifact”.
These artifacts appear as a regular pattern of visible block boundaries. This degradation is the result of course
quantization of the coefficients and of the independent processing of the blocks which does not take in to
account the existing correlations among adjacent block pixels [12]. In order to achieve high compression rates
using BTC with visually acceptable results, a procedure known as deblocking is done in order to eliminate
blocking artifacts.
In this paper a research has done on quality assessment of deblocked images by estimating various
quality metrics and the effect of quantization step of the measured quality of deblocked image is studied.
Simulations are done using quality metrics such as peak signal-to-noise ratio (PSNR), structural similarity index
(SSIM) and PSNR-B. PSNR-B is a new quality metric which includes PSNR by a blocking factor. By going
through simulation results, it is shown that PSNR-B correlates well with the SSIM index and subjective quality
and its performance is much better than the PSNR.
II. QUALITY ASSESSMENT & DEBLOCKING
To remove blocking effect, several deblocking techniques have been proposed in the literature as post
process mechanisms after JPEG compression, depending on the angle from which the blocking problem is
tackled. If deblocking is viewed as an estimation problem, the simplest solution is probably just to low pass the
blocky JPEG compressed image. More sophisticated methods involve iterative methods such as projection on
convex sets [3, 4] and constrained least squares [4, 5] In this paper we use deblocking algorithms including
lowpass filtering and projection on to convex sets. The efficiency of these algorithms can be analyzed by
introducing a proposed method in the following section.
In this project We consider the two reference models class of quality assessment (QA) methods that are
full-reference (FR) QA, which compares the test (distorted) image with a reference (original) image., the
distorted images will ostensibly suffer from blocking artifacts or from the residual artifacts.
III. PROPOSED METHOD
Deblocking operation is performed in order to reduce blocking artifacts. Deblocking operation can be
achieved by using various deblocking algorithms, employing deblocking filters. The effects of deblocking
filters can be analyzed by introducing a change in distortion concept.
The deblocking operation results in the enhancement of image quality in some areas, while degrading in other
areas.](https://image.slidesharecdn.com/g0454049-131001011751-phpapp02/75/A-Novel-PSNR-B-Approach-for-Evaluating-the-Quality-of-De-blocked-Images-1-2048.jpg)
![A Novel PSNR-B Approach For Evaluating The Quality Of De-blocked Images
www.iosrjournals.org 41 | Page
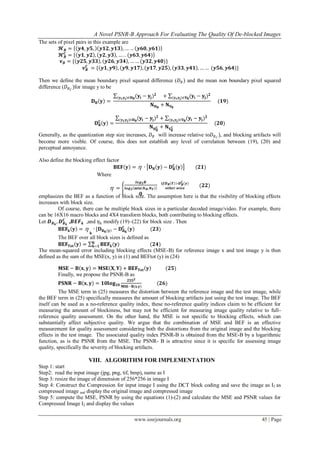
Fig 1 Block diagram showing JPEG compression
Let X be the reference image and Y be the test image (decoded image) distorted by quantization errors
and Y ̃ be the deblocked image as shown in figure1. Let f represent the
Deblocking operation and is given by Y ̃ =f(Y). Let the quality metric between X and Y be M(X,Y). For the
given image Y, the main aim of deblocking operation f is to maximize M(X,f(Y)).
IV. ESTIMATION OF QUALITY METRICS
To Measure the quality degradation of an available distorted image with reference to the original
image, a class of quality assessment metrics called full reference (FR) are considered. Full reference metrics
perform distortion measures having full access to the original image. The quality assessment metrics are
estimated as follows
A. Peak signal to noise ratio
The simplest and most widely used FR QA metrics are the peak signal-to-noise ratio (PSNR) and the
mean-squared error (MSE) [1], [3].
It is most easily defined via the mean squared error (MSE) which for two m×n monochrome images I and K
where one of the images is considered a noisy approximation of the other is defined as
Let x and y represent the vectors of reference and test image signals, respectively. Let e be the vector of error
signal between x and y. If the number of pixels in an image is N
𝐌𝐒𝐄 𝐱, 𝐲 =
𝟏
𝐍
𝐞𝐢
𝟐
=
𝟏
𝐍
𝐱𝐢 − 𝐲𝐢
𝟐
𝐍
𝐢=𝟏
𝐍
𝐢=𝟏
𝟏
The PSNR is defined as:
𝐏𝐒𝐍𝐑 𝐱, 𝐲 = 𝟏𝟎𝐥𝐨𝐠 𝟏𝟎
𝟐𝟓𝟓 𝟐
𝐌𝐒𝐄 𝐱, 𝐲
𝟐
B. Structural similarity index metrics
A product of three aspects of similarity is measured: luminance, contrast, and structure. The structural
similarity (SSIM) metric aims to measure quality by capturing the similarity of images. The luminance
comparison function L(x, y) for reference image x and test image y is defined as
𝐥 𝐱, 𝐲 =
𝟐𝛍 𝐱 𝛍 𝐲 + 𝐂 𝟏
𝛍 𝐱
𝟐 + 𝛍 𝐲
𝟐 + 𝐂 𝟏
(𝟑)
Where 𝜇 𝑥 and 𝜇 𝑦 are the mean values of x and y , respectively ,and C1 is a stabilizing constant.
The contrast comparison function C(x, y) is defined similarly as
𝐂 𝐱, 𝐲 =
𝟐𝛔 𝐱 𝛔 𝐲 + 𝐂 𝟐
𝛔 𝐱
𝟐 + 𝛔 𝐲
𝟐 + 𝐂 𝟐
(𝟒)
Where 𝜎𝑥and𝜎𝑦 are the standard deviation of x and y , respectively, and C2 is a stabilizing constant.
The structure comparison functions S(x, y) is defined as
𝐒 𝐱, 𝐲 =
𝛔 𝐱𝐲 + 𝐂 𝟑
𝛔 𝐱 𝛔 𝐲 + 𝐂 𝟑
(𝟓)
Where 𝜎𝑥𝑦 is the correlation between x and y and C3 is also a constant that provides stability.
The SSIM index is obtained by combining the three comparison functions
𝐒𝐒𝐈𝐌 𝐱, 𝐲 = [𝐥 𝐱, 𝐲 ] 𝛂
∙ [𝐂 𝐱, 𝐲 ] 𝛃
∙ [𝐒 𝐱, 𝐲 ] 𝛄
(𝟔)
The parameters are set as
𝛂 = 𝛃 = 𝛄 = 𝟏 And C3=C2/2
𝐒𝐒𝐈𝐌 𝐱, 𝐲 =
𝟐𝛍 𝐱 𝛍 𝐲 + 𝐂 𝟏 (𝟐𝛔 𝐱𝐲 + 𝐂 𝟐)
𝛍 𝐱
𝟐 + 𝛍 𝐲
𝟐 + 𝐂 𝟏 (𝛍 𝐱
𝟐 + 𝛍 𝐲
𝟐 + 𝐂 𝟐)
(𝟕)
Local SSIM statistics are estimated using a symmetric Gaussian weighting function. The mean SSIM
index pools the spatial SSIM values to evaluate the overall image quality.
𝐒𝐒𝐈𝐌 𝐱, 𝐲 =
𝟏
𝐌
𝐒𝐒𝐈𝐌(𝐱𝐣. 𝐲𝐣)
𝐌
𝐣=𝟏
(𝟖)
Where M is the number of local windows over the image, and 𝑥𝑗 and 𝑦𝑗 are image patches covered by the jth
window.
Encoder Decoder deblocking
operation
x
Channel
y ỹ](https://image.slidesharecdn.com/g0454049-131001011751-phpapp02/85/A-Novel-PSNR-B-Approach-for-Evaluating-the-Quality-of-De-blocked-Images-2-320.jpg)
![A Novel PSNR-B Approach For Evaluating The Quality Of De-blocked Images
www.iosrjournals.org 46 | Page
Step6: By using the Gaussian noise using k value compute the ssim_index by the equations (3)-(8) and display
the values of mean and ssim for I2
Step 6: Compute the PSNR-B by using the equations (19)-(26) the PSNR-B is calculated for the image I2 and
display the values
Step 7: Computing the MSE, PSNR, SSIM, PSNR-B are the quality metrics of the calculating image x
De-blocked images:
Step 8: using low pass filter compute the image g and display the image of the image I2 named as g. and
calculating the quality metrics for the image g and display the values
Pocs:
Step 9: By initialize the factor value =1 and delta_est = [1:2] compute the pocs named the image as y, resize the
result image to 256*256 and calculating the quality metrics for the image y and display the values of y
Step10: Compute the median filter (3*3) and (7*7) for the image I2 and display the results of I2
Difference Images:
Step11: By using the equations (12)-(14) the difference images for I2 , reshape and display the image d
step12: repeat the step11 for d1, d2 and display the images d1, d2.
Step13: compute the performance analysis and plot the graphs
Step 14: stop.
IX. SIMULATION RESULTS ON DEBLOCKED IMAGES
This section presents simulation results on quality assessment of deblocked images. Images are
compressed using DCT block coding as JPEG. In JPEG, quantization is applied using a different quantization
step size for each DCT coefficient, as defined by a quantization table. Here, we apply the same quantization
step size for all DCT coefficients, to more directly investigate the effects of quantization step size on image
quality. Quantization step sizes of 5, 10, 20, 40, 80, 120, and 160 were used in the simulations to investigate the
effects of quantization step size. Deblocking was applied on the decoded images for comparison
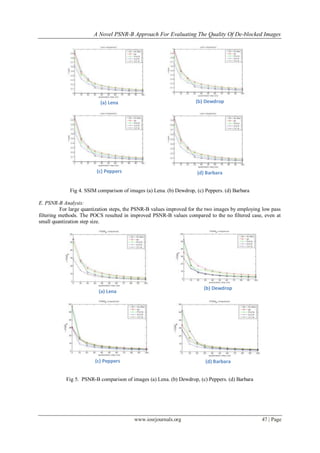
C. PSNR Analysis:
Figure 3 shows that when the quantization step size was large (Δ≥ 80), the 3×3 filter, 7×7filter and
POCS methods resulted in higher PSNR than the no filter case on both the images. All the deblocking methods
produced lower PSNR when the quantization step size was small (Δ≤ 30)
(a) Lena (b) Dewdrop
(c) Peppers (d) Barbara
Fig 3. PSNR comparison of images (a) Lena. (b) Dewdrop, (c) Peppers. (d) Barbara
D. SSIM Analysis:
Figure 4 show that when the quantization step was large (Δ≥80), on the two images, all the filtered
methods resulted in larger SSIM values. The 3×3 and 7×7 low pass filters resulted in lower SSIM values than
the low filter case when the quantization step size was small (Δ≤30).](https://image.slidesharecdn.com/g0454049-131001011751-phpapp02/85/A-Novel-PSNR-B-Approach-for-Evaluating-the-Quality-of-De-blocked-Images-7-320.jpg)
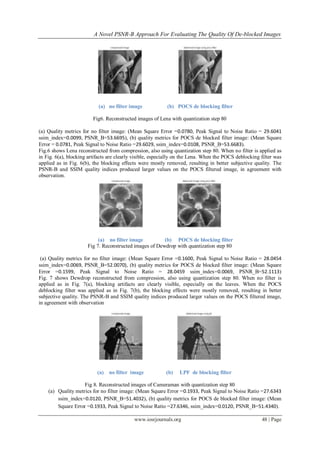
![A Novel PSNR-B Approach For Evaluating The Quality Of De-blocked Images
www.iosrjournals.org 49 | Page
Fig. 8 shows Cameraman reconstructed from compression, also using quantization step 80. When no filter is
applied as in Fig. 8(a), blocking artifacts are clearly visible, especially on the Cameraman. When the LPF
deblocking filter was applied as in Fig. 8(b), the blocking effects were greatly removed, resulting in better
subjective quality. The PSNR-B and SSIM quality indices produced larger values on the POCS filtered image,
in agreement with observation.
X. CONCLUSION
We have tested our algorithm on few natural images. Those sample images are shown in above figure.
We have found that the better quality metric is obtained at quality factor 70 for JPEG compression. This
Analysis will brings out a new trend in the quality metrics of the image and proves to be efficient than the
conversional metrics.
References
[1] S.S Channappayya, A.C.Bovik, and R.W.Heath, Jr, “Design of linear equalizers optimized for the structural similarity index,”
IEEE Trans. Image Process., vol.17, no.6, pp.857-872, Jun.2008.
[2] Z.Wang, A.C.Bovik, H.R.Sheikh, and E.P.Simoncelli, “Image quality assessment: From error visibility to structural similarity,”
IEEE Trans. Image Process., vol.13, no.4, pp.600-612, Apr.2004.
[3] A.Zakhor , “Iterative procedure for reduction of blocking effects in transform image coding,” IEEE Trans. Circuits Syst. Video
Technol., vol.2,no.1 , pp.91-95,Mar.1992.
[4] .Yang, N.P.Galatsanos, and A.K.Katsaggelos, “Projection-based spatially adaptive reconstruction of block- transform compressed
images,” IEEE Trans. Image Process., vol.4, no.7, pp.896-908, Jul.1995.
[5] Y.Yang, N.P.Galatsanos, and A.K.Katsaggelos, “Regularized reconstruction to reduce blocking artifacts of block discrete cosine
transform compressed images,” IEEE Trans. Circuits Syst. Video Technol., vol.3, no.6, pp.421-432, Dec.1993.
[6] H.Paek, R.C.Kim, and S.U.Lee, “On the POCS-based post processing technique to reduce the blocking artifacts in transform coded
images,” IEEE Trans. Circuits Syst. Video Technol., vol.8, no.3, pp.358-367,Jun.1998.
[7] S.H.Park, and D.S.Kim, “Theory of projection onto narrow quantization constraint set and its applications,” IEEE Trans. Image
Process., vol.8, no.10, pp.1361-1373, Oct.1999.
[8] Z.Wang, A.C.Bovik, and E.P.Simoncelli, “Multi-scale structural similarity for image quality assessment,” in Proc. IEEE Asilomar
Conf.Signal Syst. Comput.,No v.2003.
[9] A.C.Bovik, and H.R.Sheikh,”Image information and visual quality,” IEEE Trans. Image Process., vol.15, no.2, pp.430-444,
Feb.2006.
[10] A.C.Bovik, and H.R.Sheikh, “A statistical evaluation of recent full reference image quality assessment algorithms,” IEEE Trans.
Image Process., vol.15, no.11, pp.3441-3452, Nov.2006.
[11] Z.Wang, and A.C.Bovik, “A Universal image quality Index,” IEEE Trans. Signal Process.Lett., vol.9, no.3, pp.81-84, Mar.2002.
[12] S.Liu, and A.C.Bovik, “Efficient DCT-domain blind measurement and reduction of blocking artifacts,” IEEE Trans. Circuits Syst.
Video Technol., vol.12, no.12, pp.1139-1149, Dec.2002.
[13] B.Girod, “What’s wrong with mean-squared error,” in Digital images and human vision, A.B.Watson, ED. Cambridge, MA: MIT
Press, 1993, pp.207-220.
[14] Z.Wang, and A.C.Bovik,” Blind measurement of blocking artifacts in images,” in Proc.IEEE Int.Conf.Image Process., Vancouver,
Canada, Oct.2000.pp.981-984.
[15] Y.Jeong, I.Kim, and H.Kang,” Practical projection based postprocessing of block coded images with fast convergence rate,” IEEE
Trans. Circuits Syt. Video Technol., vol.10, no.4, pp.617-623, Jun.2000.
XI. ABOUT AUTHORS PROFILE
Trinadh Tadala graduated from Lenora college of Engineering,
Rampachodavaram in Electronics And Communication Engineering (ECE)
Stream From JNTUK, Now pursuing Masters in Computers And
Communication (C&C) Stream from University college of Engineering,
JNTUK, Kakinada, Andhra Pradesh, India.
Sri E.Venkata Narayana completed B.E and M.E in first class from Andhra
University, Visakhapatnam. He has been in teaching since 1985. Presently he is
working as Asst. Professor in Dept. of ECE, JNTU college of Engineering
Kakinada. He published more than 45 papers in national and international
conferences and journals.
.](https://image.slidesharecdn.com/g0454049-131001011751-phpapp02/85/A-Novel-PSNR-B-Approach-for-Evaluating-the-Quality-of-De-blocked-Images-10-320.jpg)

This document discusses evaluating the quality of deblocked images using different quality assessment metrics. It proposes a new metric called PSNR-B that includes a blocking effect factor in PSNR calculations. The document compares PSNR-B to PSNR and SSIM metrics. It studies the effect of quantization step size on measured image quality and analyzes how deblocking algorithms like lowpass filtering can reduce blocking artifacts but also introduce new distortions. Simulation results show PSNR-B correlates better than PSNR with subjective quality judgments of deblocked images.