Download to read offline

![EAS statistics in knee region
Mass of the primary cosmic ray vs energy measured in different experiments
[CCOU02]
The scatter plot of the average logarithm of the nuclear
mass number of the primary cosmic rays versus energy
clearly shows the need for more input from accelerators.](https://image.slidesharecdn.com/gkornakoveasmultivariateanalysis-100213144118-phpapp01/85/G-Kornakov-E-A-Smultivariate-Analysis-4-320.jpg)
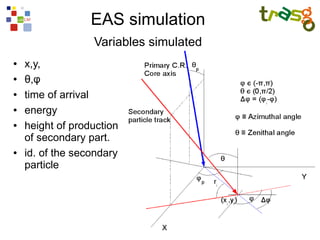
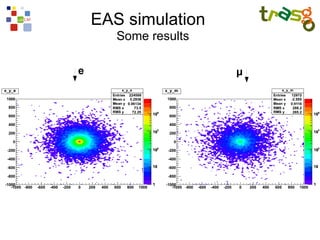
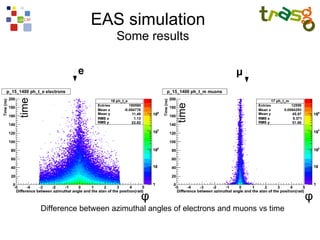
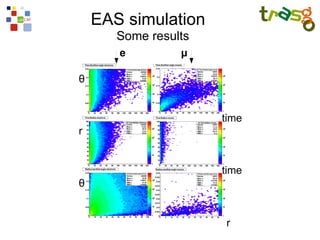
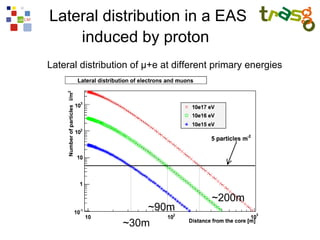
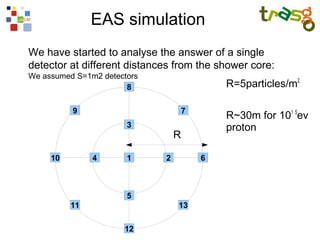
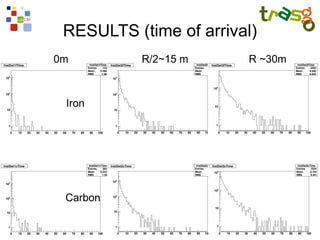
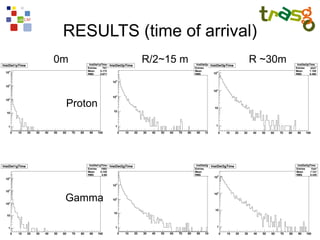
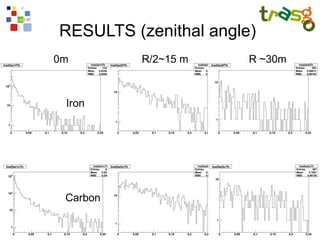
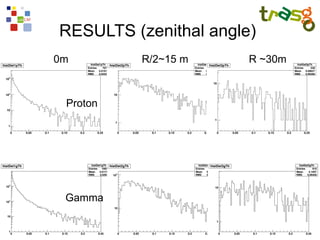
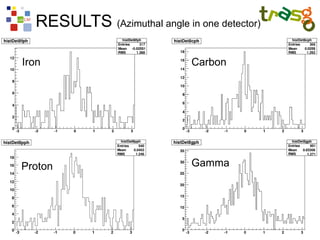

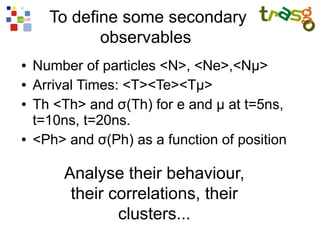


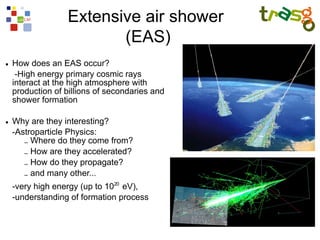
The document summarizes a simulation of extensive air showers (EAS) using the AIRES code. Key points: 1) Simulations were run for primaries of protons, carbon, iron, and gamma rays with energies of 1015 eV in the "knee" region to study EAS characteristics. 2) Variables like energy, arrival time, production height, and identity of secondaries were recorded. Results showed differences in lateral distribution and time profiles between primaries. 3) Further analysis of observables like particle counts, arrival times, and azimuthal/zenith angles at different distances from the core is planned to better understand correlations with primary properties. Multivariate analysis techniques may help reveal hidden


![[L'angolo del PhD] Alessandro Palma - XXII Ciclo - 2009](https://cdn.slidesharecdn.com/ss_thumbnails/palmasem2009-110224030932-phpapp01-thumbnail.jpg?width=640&height=640&fit=bounds)


![Getting Started with Apache Spark: Big Data Made Simple [Free Meetup]](https://cdn.slidesharecdn.com/ss_thumbnails/apachesparkgettingstarted-260203175547-8361bcc3-thumbnail.jpg?width=640&height=640&fit=bounds)


