The document discusses the use of fuzzy logic in SCADA systems to optimize electric power networks within smart grids, aimed at improving data reliability and fault detection. It outlines the implementation of fuzzy logic with 81 rule bases to enhance system performance and achieve a validation rate of 97.53%. The study highlights advancements in Indonesia's electricity distribution challenges and the importance of smart grid technology for future developments.
![International Journal of Research in Engineering and Science (IJRES)
ISSN (Online): 2320-9364, ISSN (Print): 2320-9356
www.ijres.org Volume 5 Issue 1 ǁ January. 2017 ǁ PP.22-26
www.ijres.org 22 | Page
Fuzzy Logic Method in SCADA to Optimize Network Electric
Power Smart Grid
Wasum1
, SholehHadi Pramono2
, Rahmadwati3
Department of Electrical Engineering, University ofBrawijaya, Indonesia
Abstract: Smart grid is one of the solutions in terms of distribution of electricity to make it more effective and
reliable. One of the main functions of the smart grid is to provide an important role in maintaining the reliability
of electricity supply. Some sections in the smart grid include existing equipment at the site and the central
computer. In order to convey the data from the site plant to the central computer, it needs a smart grid
instrument controllers like SCADA. SCADA has a role to monitor, control, and communicate in two-ways
between equipment on the site plant and the central computer. In SCADA systems, we often experience
difficulty in obtaining data such as uncertainty of data and non-precision data. Then a method to overcome it is
needed. In this study, Fuzzy Logic is used to detect network conditions toward the aspects of loading and the
interference of overcurrent. Using four input variables with three and four linguistic value and four output
variable with two linguistic value has resulted in eighty one rule base. Identification of faults was conducted by
how big the DC voltage and the current. Once validated by SCADA systems and the use of Fuzzy Logic, we
obtained 97.53% of the perfection of the system.
Keywords: Fault, Fuzzy Logic, SCADA, Smart grid
I. INTRODUCTION
The needs of electricity in Indonesia has increased every year. It was proved by the increase in the
average growth of 8.6% from 216.8 TWh (Tera Watt Hour) to 457.0 TWh throughout 2016 and 2025. To meet
it, the Indonesian government has tried to build and renew generation facilities, rearrange the transmission
network, and rearrange the distribution network. The obstacle of the government's efforts includes limited
electricity supply due to differences in geographic location so that the electricity weren’t fulfilled. The power
supply in Indonesia is currently using interconnection system that is used by all major islands, while small
islands are still using the isolated system and has reached the electrification ratio up to 88.3% [1].
In recent years, Indonesia is building an interconnection system. It is proven by the efforts of the
government to operate a new power plant, add plant reliability, improve the reliability of the transmission
system, strengthen the transformer in the substation, increase the recovery of electricity supply during faults and
open up the possibility of a hybrid solar power and hybrid thermal power station. The Government's efforts are
aimed to anticipate growth in customer demand, maintain continuity of power supply and maintain, steady
voltage in accordance with the needs and automation of network operation of electricity[2].
Based on the above elaboration, in 2011 Gao and Redfern tried to provide solution by creating a more
effective and reliable electrical distribution. In that study, smart grid system was used. This system had used
smart devices, modern communication systems and reliable management system[3]. Other advantages of this
system were to have a large capacity in monitoring data generated by an integrated, data analysis for supporting
decision, increased security, effectiveness in communication, to meet customer demand and reduce energy
consumption and costs.
Based on the research conducted by Gao and Redfern, Borlase (2013) tried to provide a solution by
creating a control instrument in the smart grid. The instrument was a Supervisory Control and Data Acquisition
(SCADA) [4]. This system referred to a system or combination of systems that and collect data from various
sensors which were located in the site plant. Then they sent the data to a central computer which was then used
to view, manage and control devices in the site plant. Broadly speaking, SCADA installed in the central
computer with SCADA software in it, the appearance of the Graphical User Interface (GUI), front-end data
acquisition equipment, presenting data and information in real-time, intelligent alarm processing, can use thin
clients and web-based clients, using one or more Remote Terminal Unit (RTU) and using a communication
system. Utilization of SCADA systems in the power network aims to obtain data in real-time on the site plant as
it is in the power plants, substations transmission and distribution, feeder distribution, and other devices, giving
orders to the equipment located at the site of the plant with response time ranges between 1-5 seconds.
When we pay attention on its components, SCADA consists of two components, field devices such as
RTU, and central computer. RTU is a microprocessor device which transfers the telemetry data to the central
computer. RTU is located in the plant site. The main functions of RTU are interfacing input/output, collecting
data, presenting data to a central computer, and manipulating the data before it is sent to the central computer.](https://image.slidesharecdn.com/d5112226-170713052934/85/Fuzzy-Logic-Method-in-SCADA-to-Optimize-Network-Electric-Power-Smart-Grid-1-320.jpg)
![Fuzzy Logic Method in SCADA to Optimize Network Electric Power Smart Grid
www.ijres.org 23 | Page
Meanwhile, the central computer is a computer system that is responsive to the circumstances which occur in
the RTU. In large SCADA system, central computer serves to reduce double data, distribute software, and
record events which occur on each device.
According to the research conducted by Gouzhen et al in 2009, SCADA systems were used for
monitoring, controlling, and two-way communication between the central computer and the photovoltaic power
plant. There were two basic studies in this research. They were a match between the conditions at the plant site
in the central computer and a server configuration SCADA[5].
Every complex system definitely will have some risks. Some risks that occur in the SCADA are the
breakdown of communication between the central computer and the device at the site plant, the unstable data
transmission, and the damage to system which causes faults[6].
SCADA systems often have difficulty in obtaining data from the RTU. Some of the difficulties are the
amount of noise, the uncertainty of data, and the ambiguous data obtained in the SCADA system. To overcome
this, Kumar et al are using Fuzzy Logic. Because Fuzzy Logic is able to cope with the uncertainty and non-
precision data received from the RTU to the central computer. In this methods there is membership function and
rule base that can be adapted to the needs [7]-[8].
Based on the explanation above, this research focuses on the use of Fuzzy Logic in SCADA which is
used to detect faults that occur on the network due to fault of overcurrent and load.
II. MATERIALS
In the SCADA system, the quality of the measurement depends on the transducer and converter,
telemetered to control systems via communication links. One of the components in SCADA located at the site of
plant is RTU in which there are inputs and outputs such as analogue-to-digital converters, digital-to-analogue
converters, analog inputs, digital inputs and digital outputs and communication ports in it.
The data used in this research is data types such as voltages and currents generated by the devices on
site plant and the voltage and current received by the central computer, fault, response time which occurs during
and after faults as well as length of transmission media used.
III. METHOD
3.1. Measurement
For measurement, the data was obtained from the following ways: First, by using the data changes to
large voltages and currents generated by the devices on site plant so that voltage and current received central
computer will adjust magnitude. Second, by using multiple nodes as a source of voltage and current and form a
network, then between the node, a fault was created. It will affect the delivery of data and information to the
central computer. Third, doing the analysis using fuzzy logic by doing data collection first and then process
them to obtain the rule for any condition of input results. Then the data will be saved and will be used by Fuzzy
Logic in determining the output to obtain optimum use of resources and load usage.
3.2. System Scheme
In this study, a scheme of the system as shown in Figure 1 is used.
PC Gateway Hub/SwitchEth
Analog Input
Eth
Digital Input /
Digital Output
Eth
Central Computer
Site
PV #1
1
2
2
PV #2
PV #n
1
2
1
1
2 Status
Metering
Figure 1. System Scheme
Based on Figure 1, it was concluded that: First, PC Gateway is a unit which displays and stores data
generated by the site plant section. Second, PC Gateway will provide data and information in the SCADA
system. Third, status and control of existing equipment at the site plant will be read by a sensor device that has a
digital input and digital output. Fourth, the measurement will be addressed by tools which have inputs analog
sensor. Fifth, the source voltage and current are generated by photovoltaic (VP).
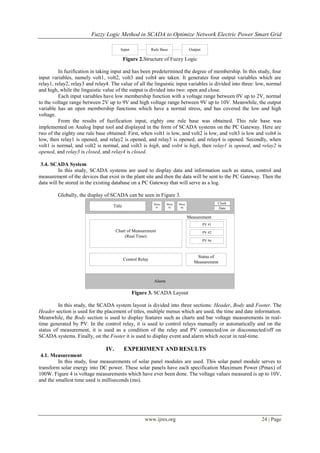
3.3. Fuzzy Logic
In this study, the method of Fuzzy Logic used can be seen in Figure 2.](https://image.slidesharecdn.com/d5112226-170713052934/85/Fuzzy-Logic-Method-in-SCADA-to-Optimize-Network-Electric-Power-Smart-Grid-2-320.jpg)
![Fuzzy Logic Method in SCADA to Optimize Network Electric Power Smart Grid
www.ijres.org 26 | Page
No Description
Cable
Length
Response
Time
1 UTP cable is disconnected between the Gateway PC
and Hub / Switch
1m 0,1ms
2 UTP cable is disconnected between Hub/Switch with
Analog Input module and Digital Input module.
2m 0,2ms
3 Negative cable is disconnected between Analog Input
module and PV #1
5m 0,5ms
4 Cable is disconnected between Digital Input module
and the PV #2
5m 0,4ms
5 UTP cable is disconnected between the PC Gateway
and Analog Input module which is connected directly
3m 0,2ms
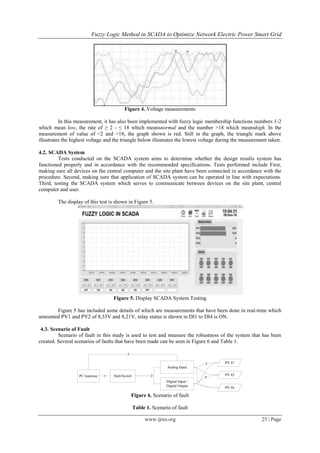
V. CONCLUSION
The use of Fuzzy Logic was conducted to determine the membership functions of the four input and
four output voltage magnitude condition of the relay. Membership function has obtained eighty-one rule base.
The calculation of Fuzzy Logic has been implemented in Analog Input module and into the SCADA system.
Once validated between SCADA systems and the use of Fuzzy Logic, then we obtained 97.53% of the
perfection of the system or two of the 81 rule base to be evaluated.
ACKNOWLEDGEMENTS
We would like to express many thanks to the Electrical Engineering University of Brawijaya which has
supported our research.
REFERENCES
[1]. Perusahaan Listrik Negara, Rencana Usaha PenyediaanTenagaListrik (RUPTL) PT. PLN (Persero) Tahun
2016-2025, (Jakarta : Perusahaan Listrik Negara, 2016).
[2]. Perusahaan Listrik Negara, Statistik PLN 2014, (Jakarta : Perusahaan Listrik Negara, 2015).
[3]. Gao, C, and Redfern, M.A., A Review of Voltage Control in Smart Grid and Smart Metering Technologies
on Distribution Networks. 46th
International Universities Power Engineering Conference. Germany. 2011.
[4]. Borlase S., Smart Grid: Infrastructure, Technology, and Solutions, (Boca Raton: CRC Press, 2013).
[5]. Guozhen H, Tao C, Changsong C, and Shanxu D. Solution for SCADA System Configuration Reliability
in Photovoltaic Power Plant, IEEE, IPEMC, 2009, 2482-2485.
[6]. Hamoud G, Chen RL, and Bradley I, Risk Assessment of Power System SCADA, 2003, 758-764.
[7]. Kumar P, Jamil M, Thomas MS, and Moinuddin, Fuzzy Approach to Fault Classification for Transmission
Line Protection. IEEE. TENCON, 1999, 1046-1050.
[8]. Naba A., BelajarCepat Fuzzy Logic Menggunakan MATLAB, (Yogyakarta :Andi Publisher, 2008).](https://image.slidesharecdn.com/d5112226-170713052934/85/Fuzzy-Logic-Method-in-SCADA-to-Optimize-Network-Electric-Power-Smart-Grid-5-320.jpg)


