
Recommended
Recommended
More Related Content
What's hot
What's hot (20)
Similar to Injection Analysis of Hera And Betano New Power Plants At the Interconnection System in Edtl of Timor Leste
Similar to Injection Analysis of Hera And Betano New Power Plants At the Interconnection System in Edtl of Timor Leste (20)
More from IJRESJOURNAL
More from IJRESJOURNAL (20)
Recently uploaded
Recently uploaded (20)
Injection Analysis of Hera And Betano New Power Plants At the Interconnection System in Edtl of Timor Leste
- 1. International Journal of Research in Engineering and Science (IJRES) ISSN (Online): 2320-9364, ISSN (Print): 2320-9356 www.ijres.org Volume 5 Issue 8 ǁ August. 2017 ǁ PP. 74-86 www.ijres.org 74 | Page Injection Analysis of Hera And Betano New Power Plants At the Interconnection System in Edtl of Timor Leste * Francisco Salsinha Martins1 ,Hadi Suyono2 , Wijono3 1 Student of Electrical Engineering Master Program, Brawijaya University 2 Lecturer of Electrical Engineering Master Program, Brawijaya University Corresponding author:* Francisco Salsinha Martins ABSTRACT: Electricity system in Timor Leste is supplied from small scale Diesel Power Plants (DPP) which are distributed at each district that not interconnected, as the consequences, electric continuity at some districts are disturbed so caused power outage. To overcome the matters, the steps taken by Timor Leste government by establishing 2 units of centered DPP with total capacity of 250 MW at Dili District of 120 MW and at BetanoDistrict of 130 MW. The new power plant will be injected at the electricity system of Timor Leste through transmission line of 150 kV. The new power plant injection will cause the power flow and system stability of Timor Leste entirely. Steady state analysis done including the power flow analysis before and after injection of DPP of Hera and Betano so can be seen the voltage profile change and the decrease of electric power losses. Beside the steady state analysis, also done the power system stability analysis to know whether the system can operate normally after short circuit disturbance of three phases before and after new DPP injection. The steady state analysis showed that the system voltage condition before injection of DPP of Hera and Betano experience decrease of -13% from the sending voltage, and the active power losses of 6.8%. After DPP of Hera and Betano injection the decrease only -6% and active power losses can be minimized become 5.3%. The results of power system stability showed the rotor angle stability, frequency and voltage stability during disturbance occurrence become more stable after injection with recovery time faster if compared with before injection of new power plant. Keywords: Steady State, dynamic stability, new powerplant, Hera DPP injection, Betano DPP injection. I. INTRODUCTION Timor Leste is a new state with republic form, mostly with mountainous area in 15.410 km2 with population of 1.143.667 people distributed in 13 district(provinces) and Dili as it capital. Electric energy needs in Timor Leste since 2002 of independence to 2011increases continuously. The availability of power plant unable to fulfill the electricity consumer so needs electric power plant with higher capacity. Electricity system in Timor Leste since 2002to 2011 has Diesel Power Plant (DPP) with middle distribution system 20 kV separated between one district with other districts. The operational cost become high and only able to operate between 6 to 8 hours and 12 hours in a day. DPP capacity in 13 districts since the lowest capacity of 200 kW at Viqueque district to the highest capacity of 36.532 kW at Dili. While the load capacity for each district, since 99 kW (district of Liquica); 125 kW (district of Ainaro); 200 kW (district of Oecusse); 236 kW (district of Viqueque); 300 kW (district of Aileu); 319 kW (district of Manatuto); 420 kW (district of Betano); 668 kW (district of Ermera); 680 kW (district of Lospalos); 681 kW (district of Baucau); 1025 kW (district of Maliana); and 22.314 kW (district of Dili). At several districts experience power supply shortage from each power plant, such as Aileu district of 20%, Betano of 3%, Lospalos of 65%, and Viqueque of 15% (EDTL, 2009). To fulfill the electric power supply shortage and the electric power distribution to the remote areas, the Timor Leste government in 2009 established high capacity diesel power plant of Hera in Dili district with capacity of 120 MW and Betano DPP at Betano district of 130 MW. The DPP will be injected at the electric system of Timor Leste through the transmission line 150 kV and 9 substations, that is Dili substation, Liquica substation, Maliana substation, Suai substation, Betano substation, Manatutu substation, Baucau substation, Lospalossubstation and Viqueque substation. With the interconnection system of 150 kV, then the power plant with distribution line of 20 kV which is separated one another is replaced with the interconnection system through 150kV transmission line in Timor Leste. The injection of new power plant (DPP of Hera and Betano) at the Timor Leste Electricity system will cause the change of power flow in the current system, and will influence the stability of entire system. Analysis of the new power plant injection toward the electricity need to do to get the best strategy in maintaining the system to operate synchronously during disturbance occurrence. Power flow analysis is needed to do to determine the best injection location and improve the voltage profile, so impact to the power losses decrease. Beside steady state analysis, dynamic analysis in the form of voltage stability, frequency, rotor angle stability before and after injection need to do to know the system performance during disturbance occurred.
- 2. Injection Analysis of Hera And Betano New Power Plants At the Interconnectio… www.ijres.org 75 | Page II. ANALYSIS OF POWER FLOW Power flow analysis is done to get information about power flow and system voltage in the steady state. The information is needed to evaluate the power system performance and analyzing the generating or loading condition. The analysis also needs power flow information in the normal or emergency condition (Cekdin, 2007). The power flow problem including the calculation of voltage, active power or reactive power profiles at various bus at the electric power grid at normal condition. In the power flow analysis, the buses are grouped into three classification, that is: a. Slack bus or swing bus or reference bus. The magnitude known in slack bus is Vand δ (phase angle). During power flow calculation, V and δwill constant. Slack bus serve to fulfill the power shortage (losses or load) entirely, because the line losses can not be known before the calculation is finished. b. Voltage controlled bus or generator bus At the voltage controlled bus or generator bus, the P and V have been known. c. Load bus At load bus the P and Q have been known At each bus there are 4 units, that is - Real or active power (P). - Reactive power (Q). - Scalar value of voltage V . - Phase angle of voltage (δ). At each bus only two quantities that are determined while the both other quantities are the results of calculation. The determined quantities are: a. Slack bus; scalar value V and phase angle δ. b. Voltage controlled bus; real power P and scalar value of voltage V . c. Load bus; real power P and reactive power Q. Slack bus served to supply the real power shortage and reactive power at system. III. POWER SYSTEM STABILITY Power system stability in general is divided into two categories, steady state stability and transient stability. Steady state stability is the power system ability back to normal operation after small and slow disturbance, such as the gradual power change. While transient stability is the power system ability to normal condition after great disturbance such as the loss of generation, loss of big load or short circuit. (Saadat, 2009). 1. Stability of rotor angle Rotor angle stability refer to the machine ability from interconnected power system to still in synchronous condition after disturbance. It is depend on ability to maintain the balance between electromagnetic torsion and mechanical torsion at synchronous machine in the system. The instability that can increase the swing angle in several rotor causes synchronization losses with the other generators. 2. Frequency stability Frequency stability refer to power system ability to maintain stable frequency follow the system upset that produce imbalance between generator and load. It depends on the ability to maintain balance between generator and load, with minimum unintentional load loss. Instability occurred able in the form of frequency swing that is leading that cause tripping of generating unit or load unit. 3. Voltage stability Voltage stability refer to the power system ability to maintain the stable voltage in all buses in the system after disturbance from initial operation. It depends on the system ability to maintain the load need and power system availability. The stability form is influenced by load characteristic, continuous control, and discrete control that is given in short time. The concept is useful in responding the small system change. With appropriate assumption, the system equation can be linearized for analysis so enable the sensitivity calculation that is useful in identifying the influencing factors. However, the linearization unable to explain the non linear effect such as tap changer (deadband, discrete tap steps, and time delays) IV. RESULTS AND DISCUSSION 1. Steady State analysis Power flow analysis before injection showed that from six feeders at Dili district, three feeders, that is feeder 1, feeder 2, feeder 6 at several buses experienced voltage decrease with out of standard determined
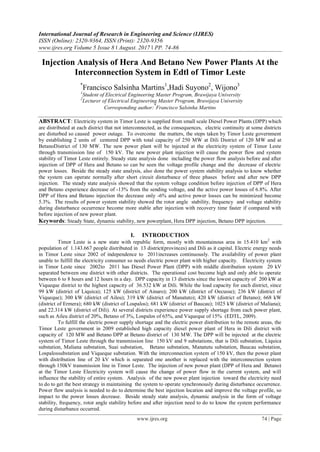
- 3. Injection Analysis of Hera And Betano New Power Plants At the Interconnectio… www.ijres.org 76 | Page voltage of +5% and -10%. It was caused by feeder 1, feeder 2 and feeder 6 are the longest feeder, the served load is high compared with other three feeders. (feeder 3, feeder 4 and feeder 5). (a) (b) (c) Figure 1. Graphs of system voltage at (a) feeder 1, (b) feeder 2, (c) feeder 6 befor injection of Hera &Betano DPP Figure 1. (a) above showed that at feeder 1 there are 6 buses experienced voltage decreased, at bus 98, bus 100, bus 101, bus 103, bus 456 and bus 457. Bus experienced highest decrease at bus 101 of V = 17,836 kV or -11%. Figure 1. (b) showed that at feeder 2 there are 33 buses that experienced voltage decrease, that is at bus 278, bus 313 to bus 315, bus 318, bus 319, bus 322, bus 323, bus 326, bus 328 to bus 332, bus 338, bus 340, bus 342 to bus 345, bus 350, bus 351, bus 354 to bus 358, bus 364 to bus 369. Bus which experienced highest decrease at bus 369 of V = 17,348 kV or -13%. Figure 1. (c) showed that at feeder 6 there are 6 buseswhich experience voltage decrease, that is at bus 421 to bus 424, bus 432 and bus 433. Bus which experienced the highest voltage decrease at bus 433 of V = 17,931 kV or -10 %. The power flow analysis after injection of DPP of Heraand Betano at the 20 kV system in Dili district given in figure 2, figure 3, and figure 4. From the figure, it can be seen that after injection the total power P =250 MW the voltage value at each bus at the feeder 1, feeder 2 and feeder 6 increased. Feeder 1, Bus 98 which initially decrease -10% increase become -7%, bus 100 from -11% increase -7%, bus 101 from -11% increase become -8%, bus 103 from -11% increase become -7%, bus 456 from -11% increase become 7% and bus 457 from -11% increase become -7% as given in table 1.
- 4. Injection Analysis of Hera And Betano New Power Plants At the Interconnectio… www.ijres.org 77 | Page Table 1.Calculation of voltage value before and after new dpp injection at the decreasing voltage bus at feeder 1 Feeder 1 Condition Of System Voltage Before injection of new DPP After injection of new DPP kV % kV % Bus 98 17,98 -10,07 18,65 -6,73 Bus 100 17,89 -10,52 18,56 -7,19 Bus 101 17,83 -10,82 18,49 -7,50 Bus 103 17,85 -10,70 18,52 -7,38 Bus 456 17,89 -10,52 18,56 -7,19 Bus 457 17,89 -10,52 18,56 -7,19 Source: (Data of Simulation results, 2017) Figure 2. Graph of system voltage at feeder 1 before and after injection of Hera and Betano DPP. Feeder2, Bus 278 which initially experienced decrease of -11% increase become -8%, bus 313 from - 10% increase become -7%, bus 314 from -11% increase become -7%, bus 315 from -11% increase become -7%, bus 318 from -10% increase become -7%, bus 319 from -10% increase become -7%, bus 322 from -10% increase become -7%, bus 323 from -10% increase become -7%, bus 326 from-11% increase become -8%, bus 328 from-11% increase become -8%, bus 329 from -11% increase become -8%, bus 330 from -12% increase become -8%, bus 331 from-12% increase become -8%, bus 332 from-12% increase become -9%, bus 338 from - 12% increase become -9%, bus 340 from -12% increase become -9%, bus 342 from-12% increase become -9%, bus 343 from-13% increase become -9%, bus 344 from -13% increase become -9%, 345 from -13% increase become -9%, bus 350 from -13% increase become -9%, bus 351 from -13% increase become -%, bus 354 from - 13% increase become -10%, bus 355 from-13% increase become -10%, bus 356 from -13% increase become - 10%, bus 357 from -13% increase become -10%, bus 358 from -13% increase become -10%, bus 364 from-13% increase become -10%, bus 365 from-13% increase become -10%, bus 366 from -13% increase become -10%, bus 367 from -13% increase become -10%, bus 368 from -13% increase become -10%, bus 369 from -13% increase become -10%, as seen in table 2. Table 2.comparison of voltage value before and after new dpp injection at bus which experience decrease at feeder 2. Feeder 2 Condition Of System Voltage Before injection of new DPP Before injection of new DPP kV % kV % Bus 278 17,798 -11 18,468 -8 Bus 313 17,947 -10 18,621 -7 Bus 314 17,895 -11 18,568 -7 Bus 315 17,845 -11 18,516 -7 Bus 318 17,942 -10 18,616 -7 Bus 319 17,939 -10 18,613 -7 Bus 322 17,943 -10 18,617 -7 Bus 323 17,941 -10 18,615 -7 Bus 326 17,799 -11 18,469 -8 Bus 328 17,756 -11 18,425 -8 Bus 329 17,716 -11 18,383 -8
- 5. Injection Analysis of Hera And Betano New Power Plants At the Interconnectio… www.ijres.org 78 | Page Bus 330 17,677 -12 18,344 -8 Bus 331 17,642 -12 18,307 -8 Bus 332 17,608 -12 18,272 -9 Bus 338 17,608 -12 18,238 -9 Bus 340 17,545 -12 18,208 -9 Bus 342 17,518 -12 18,18 -9 Bus 343 17,493 -13 18,154 -9 Bus 344 17,485 -13 18,146 -9 Bus 345 17,478 -13 18,139 -9 Bus 350 17,46 -13 18,121 -9 Bus 351 17,447 -13 18,107 -9 Bus 354 17,432 -13 18,091 -10 Bus 355 17,417 -13 18,076 -10 Bus 356 17,403 -13 18,061 -10 Bus 357 17,392 -13 18,05 -10 Bus 358 17,382 -13 18,04 -10 Bus 364 17,374 -13 18,031 -10 Bus 365 17,366 -13 18,023 -10 Bus 366 17,359 -13 18,016 -10 Bus 367 17,353 -13 18,01 -10 Bus 368 17,35 -13 18,006 -10 Bus 369 17,348 -13 18,005 -10 Source: (Data of simulation results, 2017) Figure 3.Graph of system voltage at feeder 2 before and after injection of Hera and Betano DPP Feeder 6, Bus 421 which initially experienced voltage decrease of -10% increase become -7%, bus 422 from -10% increase become -7%, bus 423 from-10% increase become -7%, bus 424 from -10% increase become -7%, bus 432 from -10% increase become -7% and bus 433 from -10% increase become -7% as given in Table 3. Table 3.comparison of voltage value before and after injection of new dpp at bus which experience voltage decrease at feeder 6. Feeder 6 Condition Of System Voltage Before injection of new DPP Before injection of new DPP kV % kV % Bus 421 17,989 -10 18,658 -7 Bus 422 17,974 -10 18,643 -7 Bus 423 17,962 -10 18,629 -7 Bus 424 17,95 -10 18,617 -7 Bus 432 17,94 -10 18,607 -7 Bus 433 17,931 -10 18,598 -7 Source: (Data of simulation results, 2017)
- 6. Injection Analysis of Hera And Betano New Power Plants At the Interconnectio… www.ijres.org 79 | Page Figure 4.Graph of voltage system at feeder 6 before and after injection of Heraand PLTD DPP Analysis results of electricity system at Timor Leste of 20 kV before and aster injection of Hera and Betano DPP obtained losses total value that occurred at Dili district of 20 kV, as given in Table 4. Table 4. Losses total comparison at dili district of 20 kv Power flow results and losses Condition Of System Voltage Before injection of new DPP Before injection of new DPP Generation total Active power (MW) 27,235 28,760 Reactive power (MVAR) 4,303 2,184 Loading total Active power (MW) 25,379 27,249 Reactive power (MVAR) 2,076 2,199 Total losses Active power (MW) 1,856 1,510 Reactive power (MVAR) 2,226 0,015 Losses percentage Active power (%) 6,8 % 5,3 % Reactive power (%) 52 % 0,69 % Source: (Data of simulation results, 2017) Table 4.shows the comparison results of losses total for two testing condition. From the table it can be seen that the power losses mostly during the system is not connected yet with Hera and Betano DPP with Plosses = 1,856 MW (6,8%) and Qlosses = 2,226 MVAR (52%). After interconnection with Heraand DPP, losses decreased become Plosses = 1,510 MW (5,3%) and Qlosses = 0,015 MVAR (0,69%). 2. Analysis of Power System Stability a. Faultat Dili Substation - Stability of rotor angle Simulation results of rotor angle before and after Betano DPP injection given in Figure5 and Table 5. Figure5.Comparison of rotor angle stability before and after Betano DPP injection (fault atDili Substation)
- 7. Injection Analysis of Hera And Betano New Power Plants At the Interconnectio… www.ijres.org 80 | Page Figure 5.Showed the rotor angle stability experienced faster oscillation after Betano DPP injection if compared with before injection. The time needed of generator rotor angle to synchronous condition faster after Betano DPP injection. Table 5.Comparision of rotor angle stability before and after Betano DPP injection (fault at Dili Substation) Condition Δinitial(0 ) Δnew(0 ) Trecovery (s) Before DPP injection 0 11,76 15,32 After DPP injection 0 7,27 7,12 - Frequency stability Simulation results of frequency stability before and after Betano DPP injection shown in Figure6 and Table 6. Figure6.Comparision of frequency stability before and after Betano DPP injection (fault at Dili Substation) Graphs of frequency stability comparison before and after Betano DPP injection showed that before disturbance at t=1 second, generator operated at normal frequency 50 Hz. But after disturbance at t=1, the frequency oscillated. The biggest oscillation before Betano DPP injection if compared with after injection, and the recovery time to normal frequency faster if after injection shown in table 6. Table 6.Comparison Of Frequency Stability Before And After Betano Dpp Injection (Fault At Dili Substation) Condition Finitial(Hz) fmax(Hz) Trecovery (s) Before DPP injection 50 50,3 8,47 After DPP injection 50 50,17 5,62 - Voltage stability Simulation results of voltage stability before and after Betano DPP injection shown in Figure 7 and Table 7. Figure 7. Comparison of voltage stability before and after Betano DPP injection (fault Dili Substation) Graphs of voltage stability of before and after Betano DPP injection showed the voltage after injection experience no increase compared to before injection. During disturbance, the biggest decrease occurred before power plant injection. The recovery time faster after Betano DPP injection.
- 8. Injection Analysis of Hera And Betano New Power Plants At the Interconnectio… www.ijres.org 81 | Page table 7. comparison of voltage stability before and after betano dpp injection (fault dili substation) Condition Vinitial(kV) Vdrop (kV) Trecovery (s) Before DPP injection 140,8 32,03 3,64 After DPP injection 140,8 32 3,58 b. Faultat Liquica Substation - Rotor angle stability Simulation results of rotor angle before and after Betano DPP injection shown in Figure 8 and Table 8. Figure 8.Comparison of rotor angle stability before and after Betano DPP injection(fault Liquica Substation) Figure8 showed the rotor angle stability experienced oscillation faster after Betano DPP injection if compared before injection. The recovery time needed for rotor angle back to synchronous condition faster after BetanoDPP injection as given in Table 8. Table 8.Comparison Of Rotor Angle Stability Before And After Betano Dpp Injection (Fault Liquica Substation) Condition Δinitial(0 ) Δnew(0 ) Trecovery (s) Before DPP injection 0 42,98 14,07 After DPP injection 0 52,56 6,03 - Frequency stability Simulation results of frequency stability before and after Betano DPP injection shown in figure9 and Table 9. Figure 9.Comparison of frequency stability before and after Betano DPP injection(fault Liquica Substation)
- 9. Injection Analysis of Hera And Betano New Power Plants At the Interconnectio… www.ijres.org 82 | Page Graph of frequency stability before and after Betano DPP injection showed before disturbance t = 1 second the frequency experienced oscillation. The biggest oscillation occurred before injection if compared with after injection, and the recovery time to normal condition faster after Betano DPP injection, as given in table 9. Table9.Comparision of frequency stability before and after Betano DPP injection (fault Liquica Substation) Condition Finitial(Hz) Fmax(Hz) Trecovery (s) Before DPP injection 50 50,89 9,05 After DPP injection 50 50,52 5,34 - Voltage stability Simulation results of voltage stability before and after Betano DPP injection shown in Figure10 and Table 10. Figure10.Comparison of voltage stability before and after Betano DPP injection (fault Liquica Substation) Graphs of voltage stability comparison before and after Betano DPP injection showed that after injection no increase compared with before injection. During disturbance, the biggest voltage decrease occurred before injection. The recovery time faster after Betano DPP injection. Table 10.Comparison of voltage stability before and after betano dpp injection (fault liquica substation) Condition Vinitial(kV) Vdrop (kV) Trecovery(s) Before DPP injection 140,8 81,97 4,35 After DPP injection 140,8 81,9 3,07 c. Fault Manatuto Substation - Rotor stability angle Simulation results of rotor angle stability before and after Betano DPP injection shown in Figure 11 and Table 11. Figure11.Comparison of rotor angle stability before and after Betano DPP injection (fault ManatutoSubstation) Figure11 showed the rotor angle stability experienced oscillation after DPP injection if compared with before injection. The time needed to back to synchronous condition faster after Betano DPP injection as given in table 11.
- 10. Injection Analysis of Hera And Betano New Power Plants At the Interconnectio… www.ijres.org 83 | Page Table 11comparison Of Rotor Angle Stability Before And After Betano Dpp Injection(Fault Manatuto Substation) Condition δinitial(0 ) δnew(0 ) Trecovery(s) Before DPP injection 0 38,29 17,43 After DPP injection 0 45,82 5,64 - Frequency stability Simulation results of frequency stabilitybefore and after Betano DPP injection shown in Figure 12 and Table 12. Figure 12 .Comparison of frequency stabilitybefore and after Betano DPP injection(fault Mantuto Substation) Graph of frequency stabilitybefore and after Betano DPP injection showed before disturbance at t = 1 second, generator operated at normal frequency of 50 Hz, after disturbance at t = 1 second, the frequency oscillated. The biggest oscillation before Betano DPP injection if compared with the after injection, and recovery time needed faster after Betano DPP injection given in table 12. Table 12.Comparison Of Frequency Stability Before And After Betano Dpp Injection (Fault Manatuto Substation) Condition finitial(Hz) fmax(Hz) Trecovery(s) Before DPP injection 50 50,8 9,08 After DPP injection 50 50,52 5,19 - Voltage stability Simulation results of voltage stabilitybefore and after Betano DPP injection shown in Figure 13 and Table 13. Figure 13. Comparison of voltage stabilitybefore and after Betano DPP injection(fault Manatuto Substation) Graph of voltage stabilitycomparison before and after Betano DPP injection showed the voltage condition after injection no increase compared with before injection. During disturbance, the biggest voltage decrease faster then after Betano DPP injection as given in table 13.
- 11. Injection Analysis of Hera And Betano New Power Plants At the Interconnectio… www.ijres.org 84 | Page Table 13.Comparison Of Voltage Stability Before And After Betano Dpp Injection (Fault Manatuto Substation) Condition Vinitial(kV) Vdrop (kV) trecovery(s) Before DPP injection 140,8 74,86 7,21 After DPP injection 140,8 74,8 4,17 d. Fault Baucau Substation - Rotor angle stability Simulation results of rotor anglestability before and after Betano DPP injection shown in Figure 14 and Table 14. Figure 14.Comparison of rotor anglestability before and after Betano DPP injection(fault Baucau Substation) Figure 14 showed the rotor angleexperienced oscillation faster after Betano DPP injection compared with before DPP injection. The time needed by generator rotor angle to back to synchronous condition faster after Betano DPP injection as shown in Table 14. Table 14.Comparison Of Rotor Angle Stability Before And After Betano Dpp Injection (Fault Baucau Substation) Condition δinitial(0 ) δnew(0 ) Trecovery(s) Before DPP injection 0 44,3 15 After DPP injection 0 55,32 5,41 - Frequency stability Simulation results of frequency stabilitybefore and after Betano DPP injection shown Figure 15 and Table 15. Figure 15.Comparison of frequency stabilitybefore and after Betano DPP injection(fault Baucau Substation) Graph of frequency stabilitycomparison before and after Betano DPP injection showed that before disturbance at t = 1 the generator operated at normal frequency 50 Hz, after disturbance at t = 1 second the frequency experienced oscilation. The biggest oscillation occurred before Betano DPP injection compared with
- 12. Injection Analysis of Hera And Betano New Power Plants At the Interconnectio… www.ijres.org 85 | Page after injection, and recoverytime needed for frequency to back to normal condition faster after Betano DPP injection as shown in Table 15. Table 15.Comparison Of Frequency Stability Before And After Betano Dpp Injection (Fault Baucau Substation) Condition finitial(Hz) fmax(Hz) Trecovery(s) Before DPP injection 50 50,89 9 After DPP injection 50 50,61 5,34 - Voltage stability Simulation results of voltage stabilitybefore and after Betano DPP injection shown in Figure 16 and Table 16. Figure 16.Comparison of voltage stabilitybefore and after Betano DPP injection(fault Baucau Substation) Graph of ofvoltage stabilitycomparison before and after Betano DPP injection showed voltage condition after injection no increase compared with before injection. During disturbance, the biggest voltage decrease occurred before generator injection. Voltage recovery time faster after Betano DPP injection as shown in Table 16. Table 16.Comparison of voltage stability before and after betano dpp injection (fault baucau substation) Condition Vinitial(kV) Vdrop(kV) trecovery(s) Before DPP injection 140,8 98,45 5 After DPP injection 140,8 98,4 3,12 V. Closing Based on simulation results and analysis done then it can be concluded as follows: a. Analysis results before Hera and Betano DPP injection, showed voltage condition at several feeders, that is feeder 1, feeder 2 and feeder 6 (Dili District) under the determined standard operation, in range between - 10,82% to -13% fromthe sending voltage. The biggest active power losses of 6,8% and reactive powerlosses of 52%. b. Analysis results after injection of Hera and Betano DPP injection showed the impact of power injection by Hera and Betano DPP toward system, that is the maximum voltage decrease occurred in range between -6% to -10%. Active powerlosses can be minimized up to 5,3% and Reactive powerlosses can be minimized up to 0,69%. c. Analysis results of power system stability showed the rotor angle stability, frequency stability, and voltage stabilityat the electricity of Timor Leste become more stable after Betano DPP with recovery time after three phases disturbance faster then before injection. Literatures [1]. Bisen, P dan Shrivastava, A. 2013. Comparison between SVC and STATCOM FACTS Devices for Power System Stability Enhancement.International Journal on Emerging Technologies., 4(2), pages.101- 109. [2]. Cekdin, C. 2007. Electricity Power System, Example of Problems and Solution by using MATLAB.Publisher ANDI.Yogyakarta.
- 13. Injection Analysis of Hera And Betano New Power Plants At the Interconnectio… www.ijres.org 86 | Page [3]. Chaudhary, A dan Jaswal, R.A. 2014. Transient Stability Improvement of Multi Machine Power System Using Static VAR Compensator.International Journal of Electronic and Electrical Vol. 7, No. 2, pp. 109- 114 [4]. Electricidade de Timor-Leste (EDTL). 2015. Data of Timor Leste Electricity SYstem. [5]. Electricidade de Timor-Leste (EDTL). 2009. Data of Timor Leste Electricity SYstem. [6]. Ministry of ESDM of R.I. 2007. Regulation of Power System of Java- Madura- Bali.Ministerial Regulation.No. 03. Jakarta. [7]. Kundurdkk. 2004. Definition and Classification of Power System Stability. IEEE Transactions On Power System, Vol. 19, No. 2, pp. 1387-1401. [8]. Kundur, Praba. 1994. Power System Stability and Control. McGraw-Hill Inc. New York [9]. Kumara, D. T, Penangsang, Ontoseno, Aryani, N. K. 2016. Transient Stability Analysis at Transmission System of North Sumatra of 150 kV – 275 kV with Solar Power Plant Addition of Batang Toru 4 x 125 MW. Engineering Journal of ITS Vol. 5, No.2, pp. B202-B26 [10]. Saadat, H. 1999. Power System Analysis.McGRAW-Hill International Editions. [11]. Surusa, P.E.F, Suyono, H, Wijono. 2016. Steady State and Dynamic Analysis at The Power Plant System of Gorontalo. Electrical Current Journal of Indonesia (JAEI) Vol. 2, No. 1, pp. 9-14. [12]. Suyono, H, Zainuddin, M. 2015. Injection Impact of Photovoltaic Distributed Generation (PVDG) on Power Distribution System Stability. Applied Mechanic and Materials Vol. 75, pp. 403-408. *Francisco Salsinha Martins " Injection Analysis of Hera And Betano New Power Plants At the Interconnection System in Edtl of Timor Leste " International Journal of Research in Engineering and Science (IJRES) 05.08 (2017): 74-86.