This document is a seminar report submitted by Dhiraj Machhindra Bhalerao to North Maharashtra University in partial fulfillment of the requirements for a Bachelor of Engineering degree in Electrical Engineering. The seminar topic is "POWER SYSTEM AUTOMATION". The report includes a certificate from the seminar guide, a declaration by the author, acknowledgements, an abstract, and multiple chapters on topics related to power system automation including literature review, components of a power system, automation, and the status of automation in India.
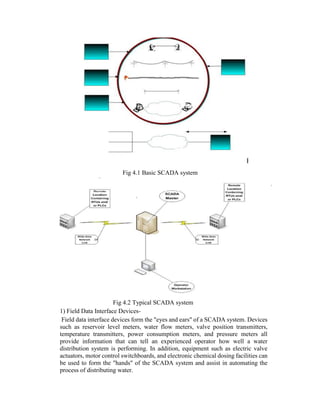
![Automating electrical distributions systems by implementing a supervisory control
and data acquisition (SCADA) system is the one of the most cost-effective solutions
for improving reliability, increasing utilization and cutting costs.
2.3 Status of automation in the India-
Electric utilities, all around the world, have realized the problems associated with
vertically integrated electric power systems and therefore they are moving towards
unbundled model of generation companies(GENCOs), transmission companies
(TRANSCOs), distribution companies (DISCOs), and energy service companies
(ESCOs). In the past, all electric power distribution-related functions could be
transparently coordinated along the complete supply chain. In the future, many
distribution companies will manage third-party contacts by delivering bulk power
from GENCOs and TRANSCOs to meters owned by ESCOs. At the same time,
many state regulatory commissions are considering the viability of retail wheeling
(small generators connected to the distribution system selling electricity directly to
consumers). In addition to planning and operating difficulties, retail wheeling asks
distribution systems to perform the functions for which they were not designed. In
view of the above, on-line information, remote control and efficient management
system are required for power distribution utilities. Considering the extensive size
of the network, these tasks can be efficiently achieved through the intervention of
information technology utilizing the available high- speed computer and
communication technology. This system of monitoring and control of electric
power distribution networks is also called as “Distribution Automation (DA)”
system. The Institute of Electrical and Electronic Engineers (IEEE) has defined
Distribution Automation System (DAS) as a system that enables an electric utility
to remotely monitor, coordinate and operate distribution components, in a real-time
mode from remote locations. The distribution automation system is based on an
integrated technology, which involves collecting data and analyzing information to
make control decisions, implementing the appropriate control decisions in the field,
and also verifying that the desired result is achieved. The location, from where
control decisions are initiated, is generally called Distribution Control Centre
(DCC).
At present, power utilities have realized the need for full scale distribution
automation to achieve on-line system information and remote control system. This
is required in order to fully accomplish the restricting (GENCOs, TRANSCOs,
DISCOs, and ESCOs) of the power system to the level of retail wheeling [1, 5]. On
the other hand, the main motivation for accepting the distribution automation in
developing countries such as India is to improve operating efficiency of distribution
system. This indicates worldwide interest for distribution automation at present.
Looking at the interest of power utilities for distribution automation, academic
institutions are now taking interest to introduce courses and R& D activities in the
field of DA in the regular academic curriculum. A list of possible research areas
and activities for future is also proposed for power distribution automation.[2]](https://image.slidesharecdn.com/dhirajpowersystemautomation-151106053300-lva1-app6891/85/Dhiraj-power-system-automation-9-320.jpg)
![CHAPTER 3
POWER SYSTEM & AUTOMATION
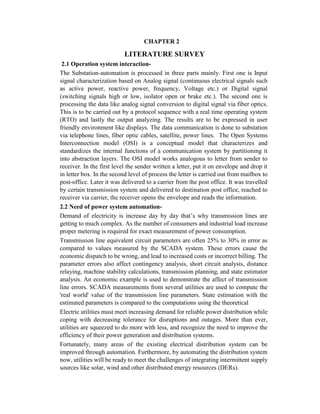
3.1 Power system-
An electric power system is a network of electrical components used to supply,
transmit and use electric power. An example of an electric power system is the
network that supplies a region's homes and industry with power—for sizable
regions, this power system is known as the grid and can be broadly divided into
the generators that supply the power, the transmission system that carries the power
from the generating centres to the load centres and the distribution system that feeds
the power to nearby homes and industries. Smaller power systems are also found in
industry, hospitals, commercial buildings and homes. The majority of these systems
rely upon three-phase AC power—the standard for large-scale power transmission
and distribution across the modern world.
Generating stations, transmission lines and distribution system are the main component
of an electrical system. Generating station and distributed substation are connected
through transmission lines, which also connects one power system to another. A
distribution system connects all the loads in a particular area to the transmission line.[1]
3.2 How does Power reach us?-
Electric power is normally generated at 11-25kV in a power station. To transmit over long
distances, it is then stepped-up to 400kV, 220kV or 132kV as necessary. Power is carried
through a transmission network of high voltage lines. Usually, these lines run into
hundreds of kilometers and deliver the power into a common power pool called the grid.
The grid is connected to load centers (cities) through a sub- transmission network of
normally 33kV (or sometimes 66kV) lines. These lines terminate into a 33kV (or 66kV)
substation, where the voltage is stepped-down to 11kV for power distribution to load
points through a distribution network of lines at 11kV and lower. The power network,
which generally concerns the common man, is the distribution network of 11kV lines or
feeders downstream of the 33kV substation. Each 11kV feeder which emanates from the
33kV substation branches further into several subsidiary 11kV feeders to carry power
close to the load points (localities, industrial areas, villages, etc.,). At these load points, a
transformer further reduces the voltage from 11kV to 415V to provide the last-mile
connection through 415V feeders (also called as Low Tension (LT) feeders) to individual
customers, either at 240V (as single-phase supply) or at 415V (as three- phase supply). A
feeder could be either an overhead line or an underground cable. In urban areas, owing
to the density of customers, the length of an 11kV feeder is generally up to 3 km. On the](https://image.slidesharecdn.com/dhirajpowersystemautomation-151106053300-lva1-app6891/85/Dhiraj-power-system-automation-10-320.jpg)

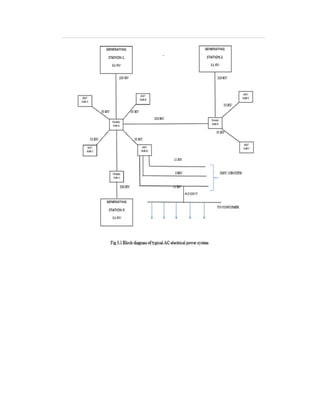
![analysis, what where when why it happened. It is used to improve the efficiency of
the system. Data Communication Normally Communication forms a core for any
system, in Power system Automation Data communication forms core of the power
system Automation. Without communication the local device and protection tasks
can be performed individually. But without data communication there is no mean
to say Power system Automation.[5]](https://image.slidesharecdn.com/dhirajpowersystemautomation-151106053300-lva1-app6891/85/Dhiraj-power-system-automation-15-320.jpg)
![CHAPTER 4
SUPERVISORY CONTROL AND DATA ACQUISITION
(SCADA)
4.1 What is SCADA-
SCADA is an acronym for Supervisory Control and Data Acquisition. SCADA
systems are used to monitor and control a plant or equipment in industries such as
telecommunications, water and waste control, energy, oil and gas refining and
transportation. These systems encompass the transfer of data between a SCADA
central host computer and a number of Remote Terminal Units (RTUs) and/or
Programmable Logic Controllers (PLCs), and the central host and the operator
terminals. A SCADA system gathers information (such as where a leak on a
pipeline has occurred), transfers the information back to a central site, then alerts
the home station that a leak has occurred, carrying out necessary analysis and
control, such as determining if the leak is critical, and displaying the information in
a logical and organized fashion. These systems can be relatively simple, such as one
that monitors environmental conditions of a small office building, or very complex,
such as a system that monitors all the activity in a nuclear power plant or the activity
of a municipal water system. Traditionally, SCADA systems have made use of the
Public Switched Network (PSN) for monitoring purposes. Today many systems are
monitored using the infrastructure of the corporate Local Area Network
(LAN)/Wide Area Network (WAN). Wireless technologies are now being widely
deployed for purposes of monitoring.
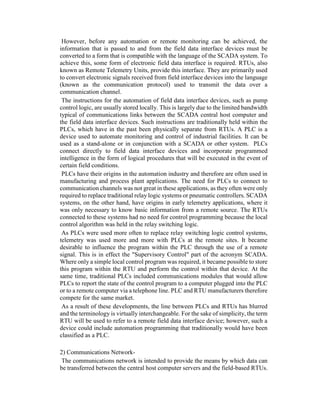
4.2 Components of SCADA-
SCADA systems consist of:
• One or more field data interface devices, usually RTUs, or PLCs, which interface
to field sensing devices and local control switchboxes and valve actuators
• A communications system used to transfer data between field data interface devices
and control units and the computers in the SCADA central host. The system can be
radio, telephone, cable, satellite, etc., or any combination of these.
• A central host computer server or servers (sometimes called a SCADA Center,
master station, or Master Terminal Unit (MTU)
• A collection of standard and/or custom software [sometimes called Human Machine
Interface (HMI) software or Man Machine Interface (MMI) software] systems used
to provide the SCADA central host and operator terminal application, support the
communications system, and monitor and control remotely located field data
interface devices
Figure 4.1 shows a very basic SCADA system, while Figure 4.2 shows a typical
SCADA system. Each of the above system components will be discussed in detail
in the next sections.](https://image.slidesharecdn.com/dhirajpowersystemautomation-151106053300-lva1-app6891/85/Dhiraj-power-system-automation-16-320.jpg)
![provides the graphical user interface which offers site mimic screens, alarm pages,
trend pages, and control functions.
• Operator terminal application: Application that enables users to access information
available on the central host computer application. It is usually a subset of the
software used on the central host computers.
• Communications protocol drivers: Software that is usually based within the central
host and the RTUs, and is required to control the translation and interpretation of
the data between ends of the communications links in the system. The protocol
drivers prepare the data for use either at the field devices or the central host end of
the system.
• Communications network management software: Software required to control the
communications network and to allow the communications networks themselves to
be monitored for performance and failures.
• RTU automation software: Software that allows engineering staff to configure and
maintain the application housed within the RTUs (or PLCs). Most often this
includes the local automation application and any data processing tasks that are
performed within the RTU.
The preceding software products provide the building blocks for the application-
specific software, which must be defined, designed, written, tested, and deployed
for each SCADA system.[3]
4.3 Classification & Working of SCADA in Power system automation-
Power system automation is classified into 2 types-
a) Substation Automation
b) Distribution Automation
a) Substation Automation- Substation automation is not a new concept. Substations
have been equipped to perform automatic re closing, bus sectionalizing, load
transfers, capacitor switching, etc. for many years. In the past, these and other
functions were implemented using a combination of control panels, auxiliary relays,
switches, lights, meters, transducers and extensive wiring and cabling. In many
applications today, this perception is probably because developments in substation
equipment have expanded the potential capabilities of substation. Automation far
beyond that which could previously be reasonably accomplished. The principal
development is generically defined as an Intelligent Electronic Device (IED) which
typically consists of one or more Programmable Logic Controllers and
communications ports; with the ability to transmit data and execute control
commands, and frequently provide a local user interface. Typical examples are
relays, meters, and specialized sensors. Prior to the introduction of Numerical
relays, the protection and control of a very small substation consisting of one
incoming line, one transformer and two feeders would require four large panels
filled with relays, switches and lights. Only one panel is required when Numerical
relays are used. Interestingly, at the same time the space requirements are reduced
by a factor of four, so the installed cost.](https://image.slidesharecdn.com/dhirajpowersystemautomation-151106053300-lva1-app6891/85/Dhiraj-power-system-automation-21-320.jpg)
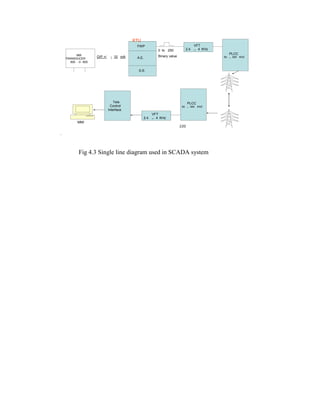
![Similarly the Analog voltage Transducer used for measuring the voltage. If we
required measuring the Reactive power and real power of the line, at this instant
both current and potential transducers are used. The Digital Transducer is used for
observing the status of the circuit breaker and isolator. The digital transducer is
transfer the signal in binary form or 0and 1.If the circuit breaker and isolator is
open, then the value of signal is zero and vice- versa .the signal is transmitted from
transducer to RTU.
The output +/- 10mA is indicates that the SCADA system is bidirectional. The RTU
send a massage to the master unit, after receiving a massage the master unit is send
the acknowledgement signal to the RTU.If due to any reason a massage is not
display in proper manner then this instant the master unit is send the request signal
to RTU. The RTU consist of three unit 1) AE (analog input card), 2) DE (digital
input card) and 3) FWP (frequency width pulse).
The analog input card is collected the analog data like Load current, Voltage,
Reactive power, Real power and Frequency. The digital input card is collected the
digital data like status of circuit breaker and isolator .In RTU this analog and digital
signal is converted into a digital form by protocol.
The width of the pulse is maintained or control by FWP, the frequency width pulse
maintains the pulse at 0 to250 binary value. This binary value is transferred to the
variable frequency telemetry is increases the frequency level from 2.5KHz to
4KHz.It transfer the signal at 4KHz and received a signal at 2.4KHz.This signal is
transferred to the power line carrier communication. The PLCC is a communication
media; its depending on frequency range and the distance between RTU and master
unit. The data is transferred through the protection line of the power system.
The signal is received by PLCC and VFT in Load Dispatch Center after this unit, a
signal is received by Tele control interface, the Tele control interface is converted
the signal in spectrum form. The MMI (man machine interference) is continuously
data on the monitor, which is helpful for the dispatcher to take the decision as per
system requirement.[7]](https://image.slidesharecdn.com/dhirajpowersystemautomation-151106053300-lva1-app6891/85/Dhiraj-power-system-automation-23-320.jpg)