Downloaded 79 times
![STUDIA UNIV. BABES–BOLYAI, INFORMATICA, Volume LII, Number 1, 2007
¸
THE APPLICABILITY OF FUZZY THEORY IN REMOTE
SENSING IMAGE CLASSIFICATION
GABRIELA DROJ
Abstract. In the recent years, the usage of Geographic Information Systems
has been rapidly increasing and it became the main tool for analyzing spatial
data in unprecedented number of fields of activities. The evolution of GIS
led to the necessity of faster and better results. The processing time was
reduced by using more and more advanced and applied mathematical and
computer science knowledge. One of these mathematical theories is fuzzy
logic. The fuzzy logic theory gives the possibility of enhancing spatial data
management with the modeling of uncertainty. The usage of fuzzy theory
has also applicability in processing remote sensing data. In this paper is
presented the applicability of fuzzy set theory to the classification of raster
images
1. Introduction
Geographical Information System (shortly GIS) represents a powerful set of
tools for collecting, storing, retrieving at will, transforming and displaying spatial
data from the real world. GIS extends the limits of Computer Aided Design (CAD)
and Automated Mapping (AM) with the possibility of retrieving geospatial data
at request and with the possibility of “what if” analysis and scenarios.
The difference between a CAD system and a GIS system is given by the pos-
sibility of spatial analysis, where new maps are computed from existing ones by
applying either:
• Spatial Join operation between different geospatial data;
• Spatial aggregation;
• Buffer operations, which increase the size of an object by extending its
boundary;
• Set operations, such as complement, union, and intersection.
Received by the editors: July 2007 .
2000 Mathematics Subject Classification. 68U10, 03E72, 03E75.
1998 CR Categories and Descriptors. I.4.6. [Computing Methodologies]: Image Pro-
cessing and Computer Vision – Segmentation; I.5.3.[Computing Methodologies]: Pattern
Recognition – Clustering F.4.1.[Theory of Computation]: Mathematical Logic and Formal
Languages – Mathematical Logic .
89](https://image.slidesharecdn.com/fuzzyinremoteclassification-studia-100218153944-phpapp01/75/Fuzzy-In-Remote-Classification-1-2048.jpg)
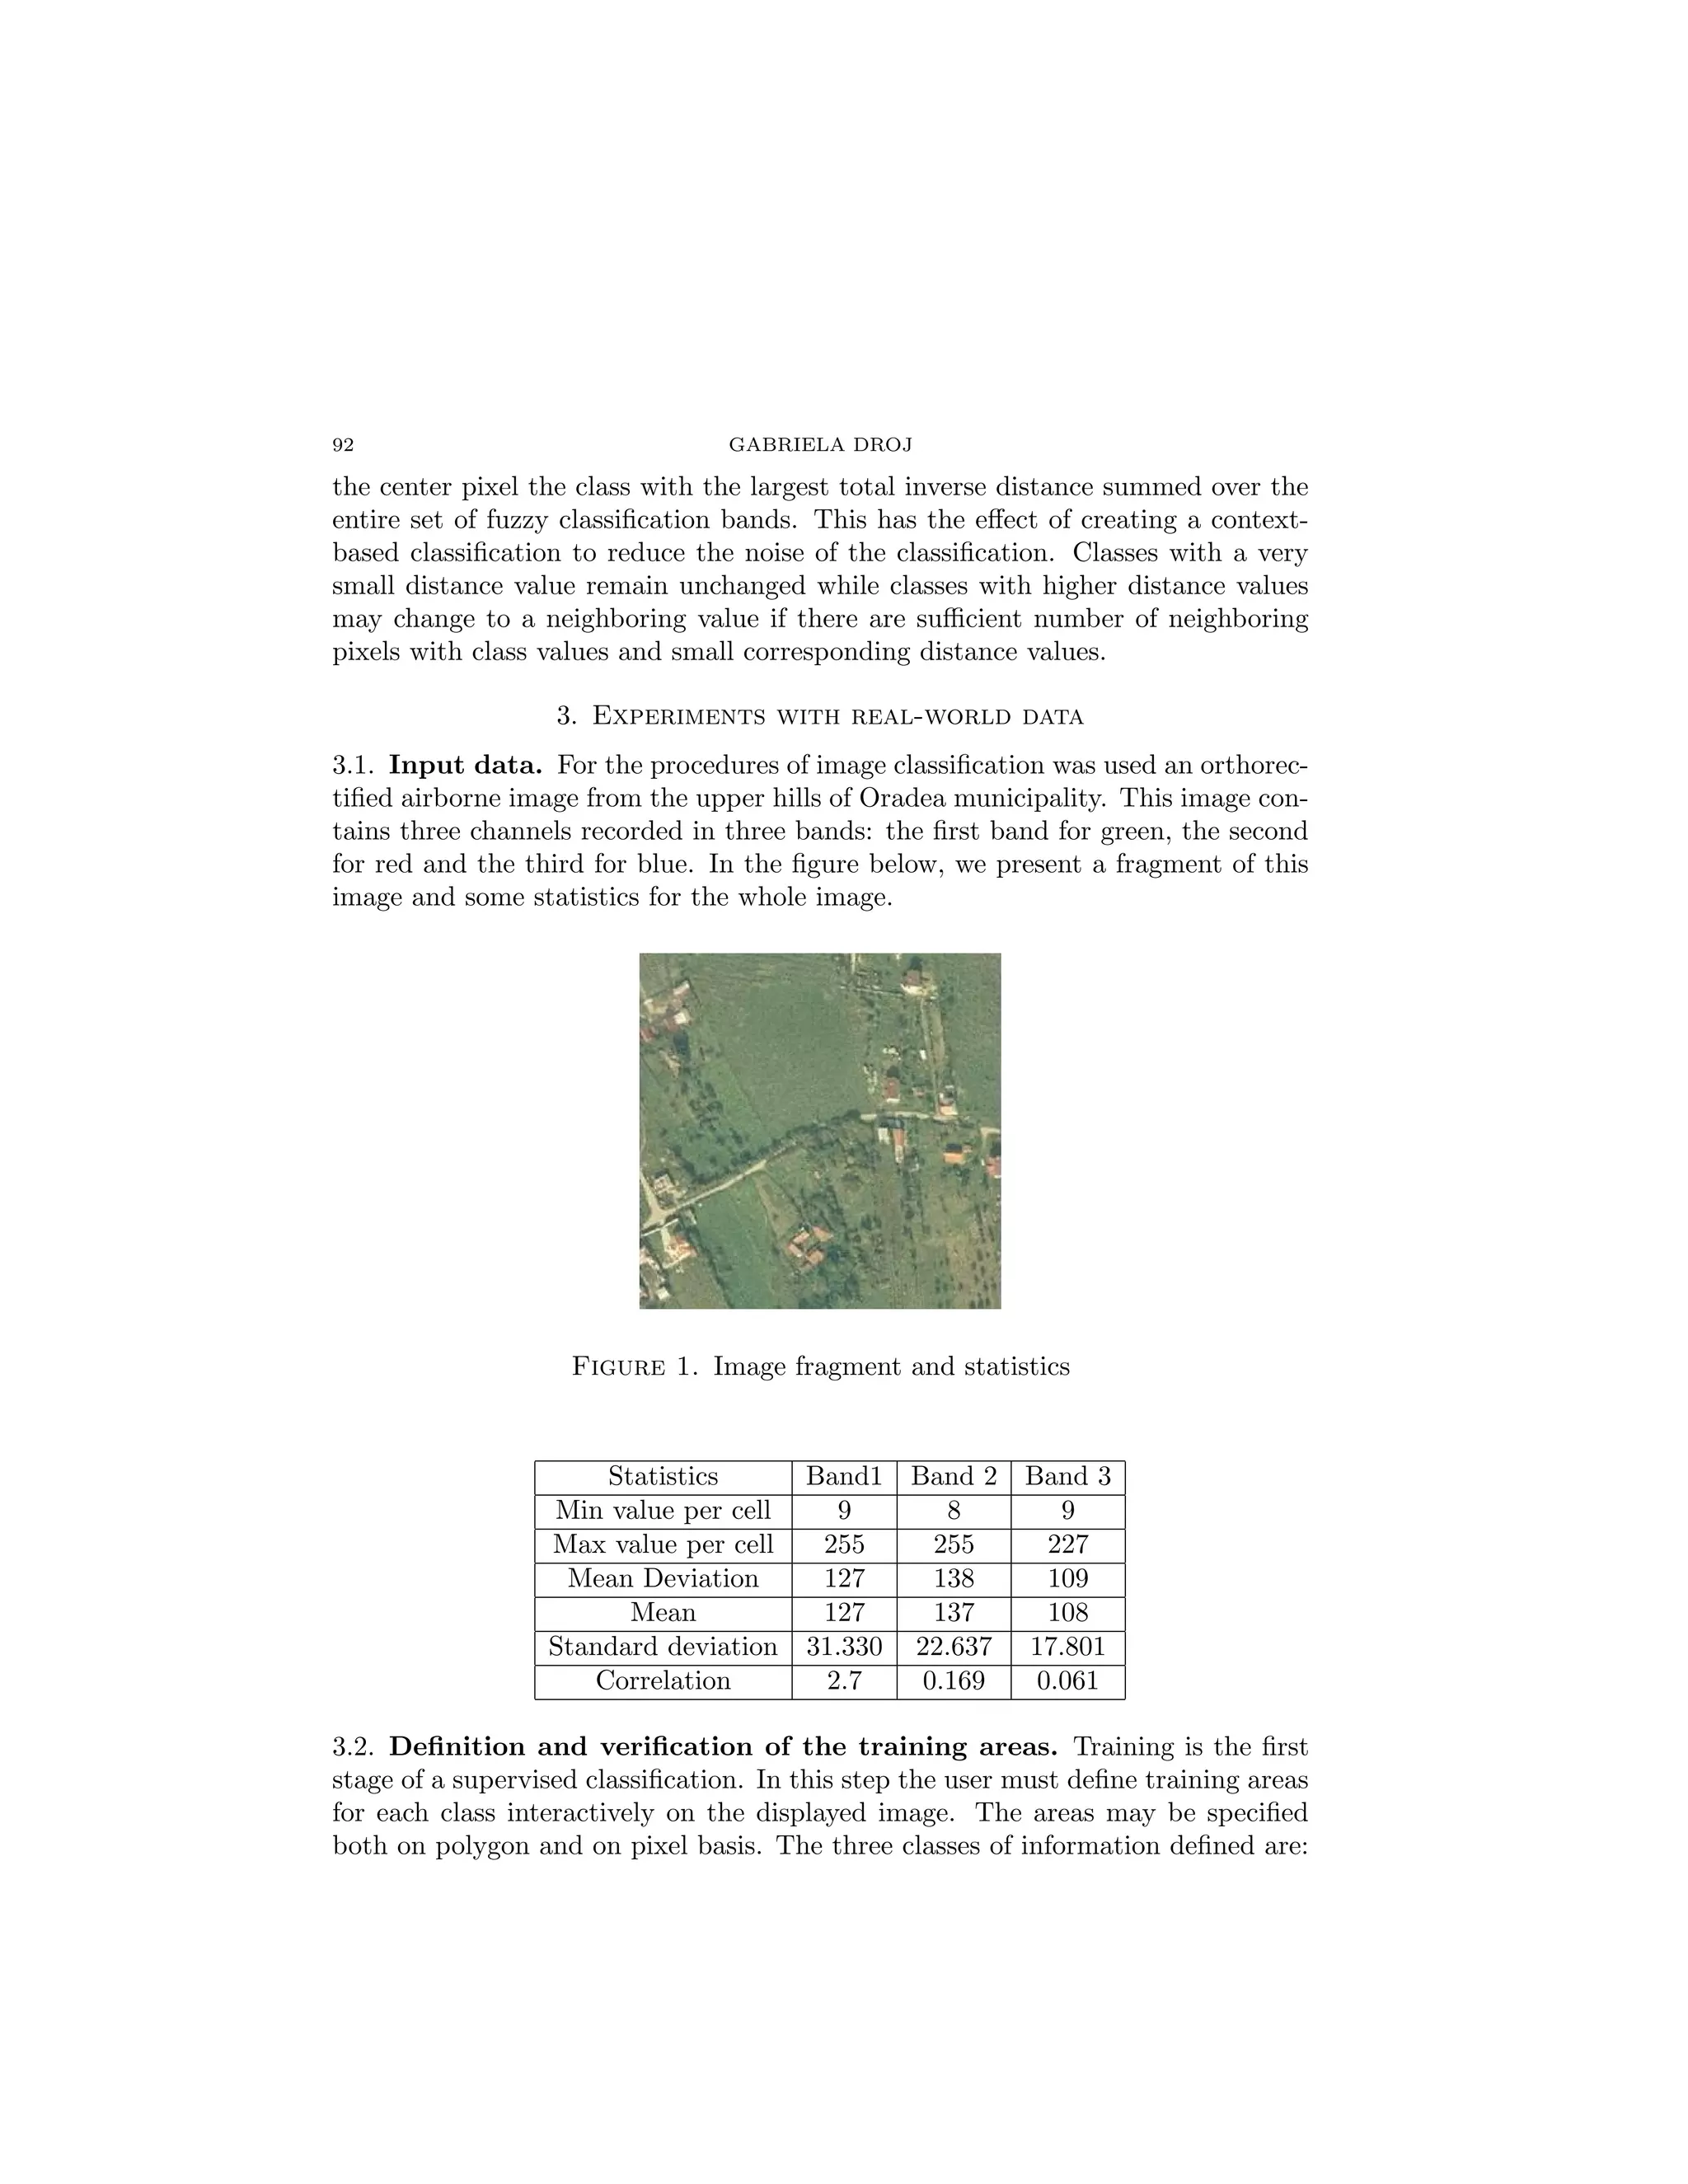
![FUZZY THEORY IN REMOTE SENSING IMAGE CLASSIFICATION 91
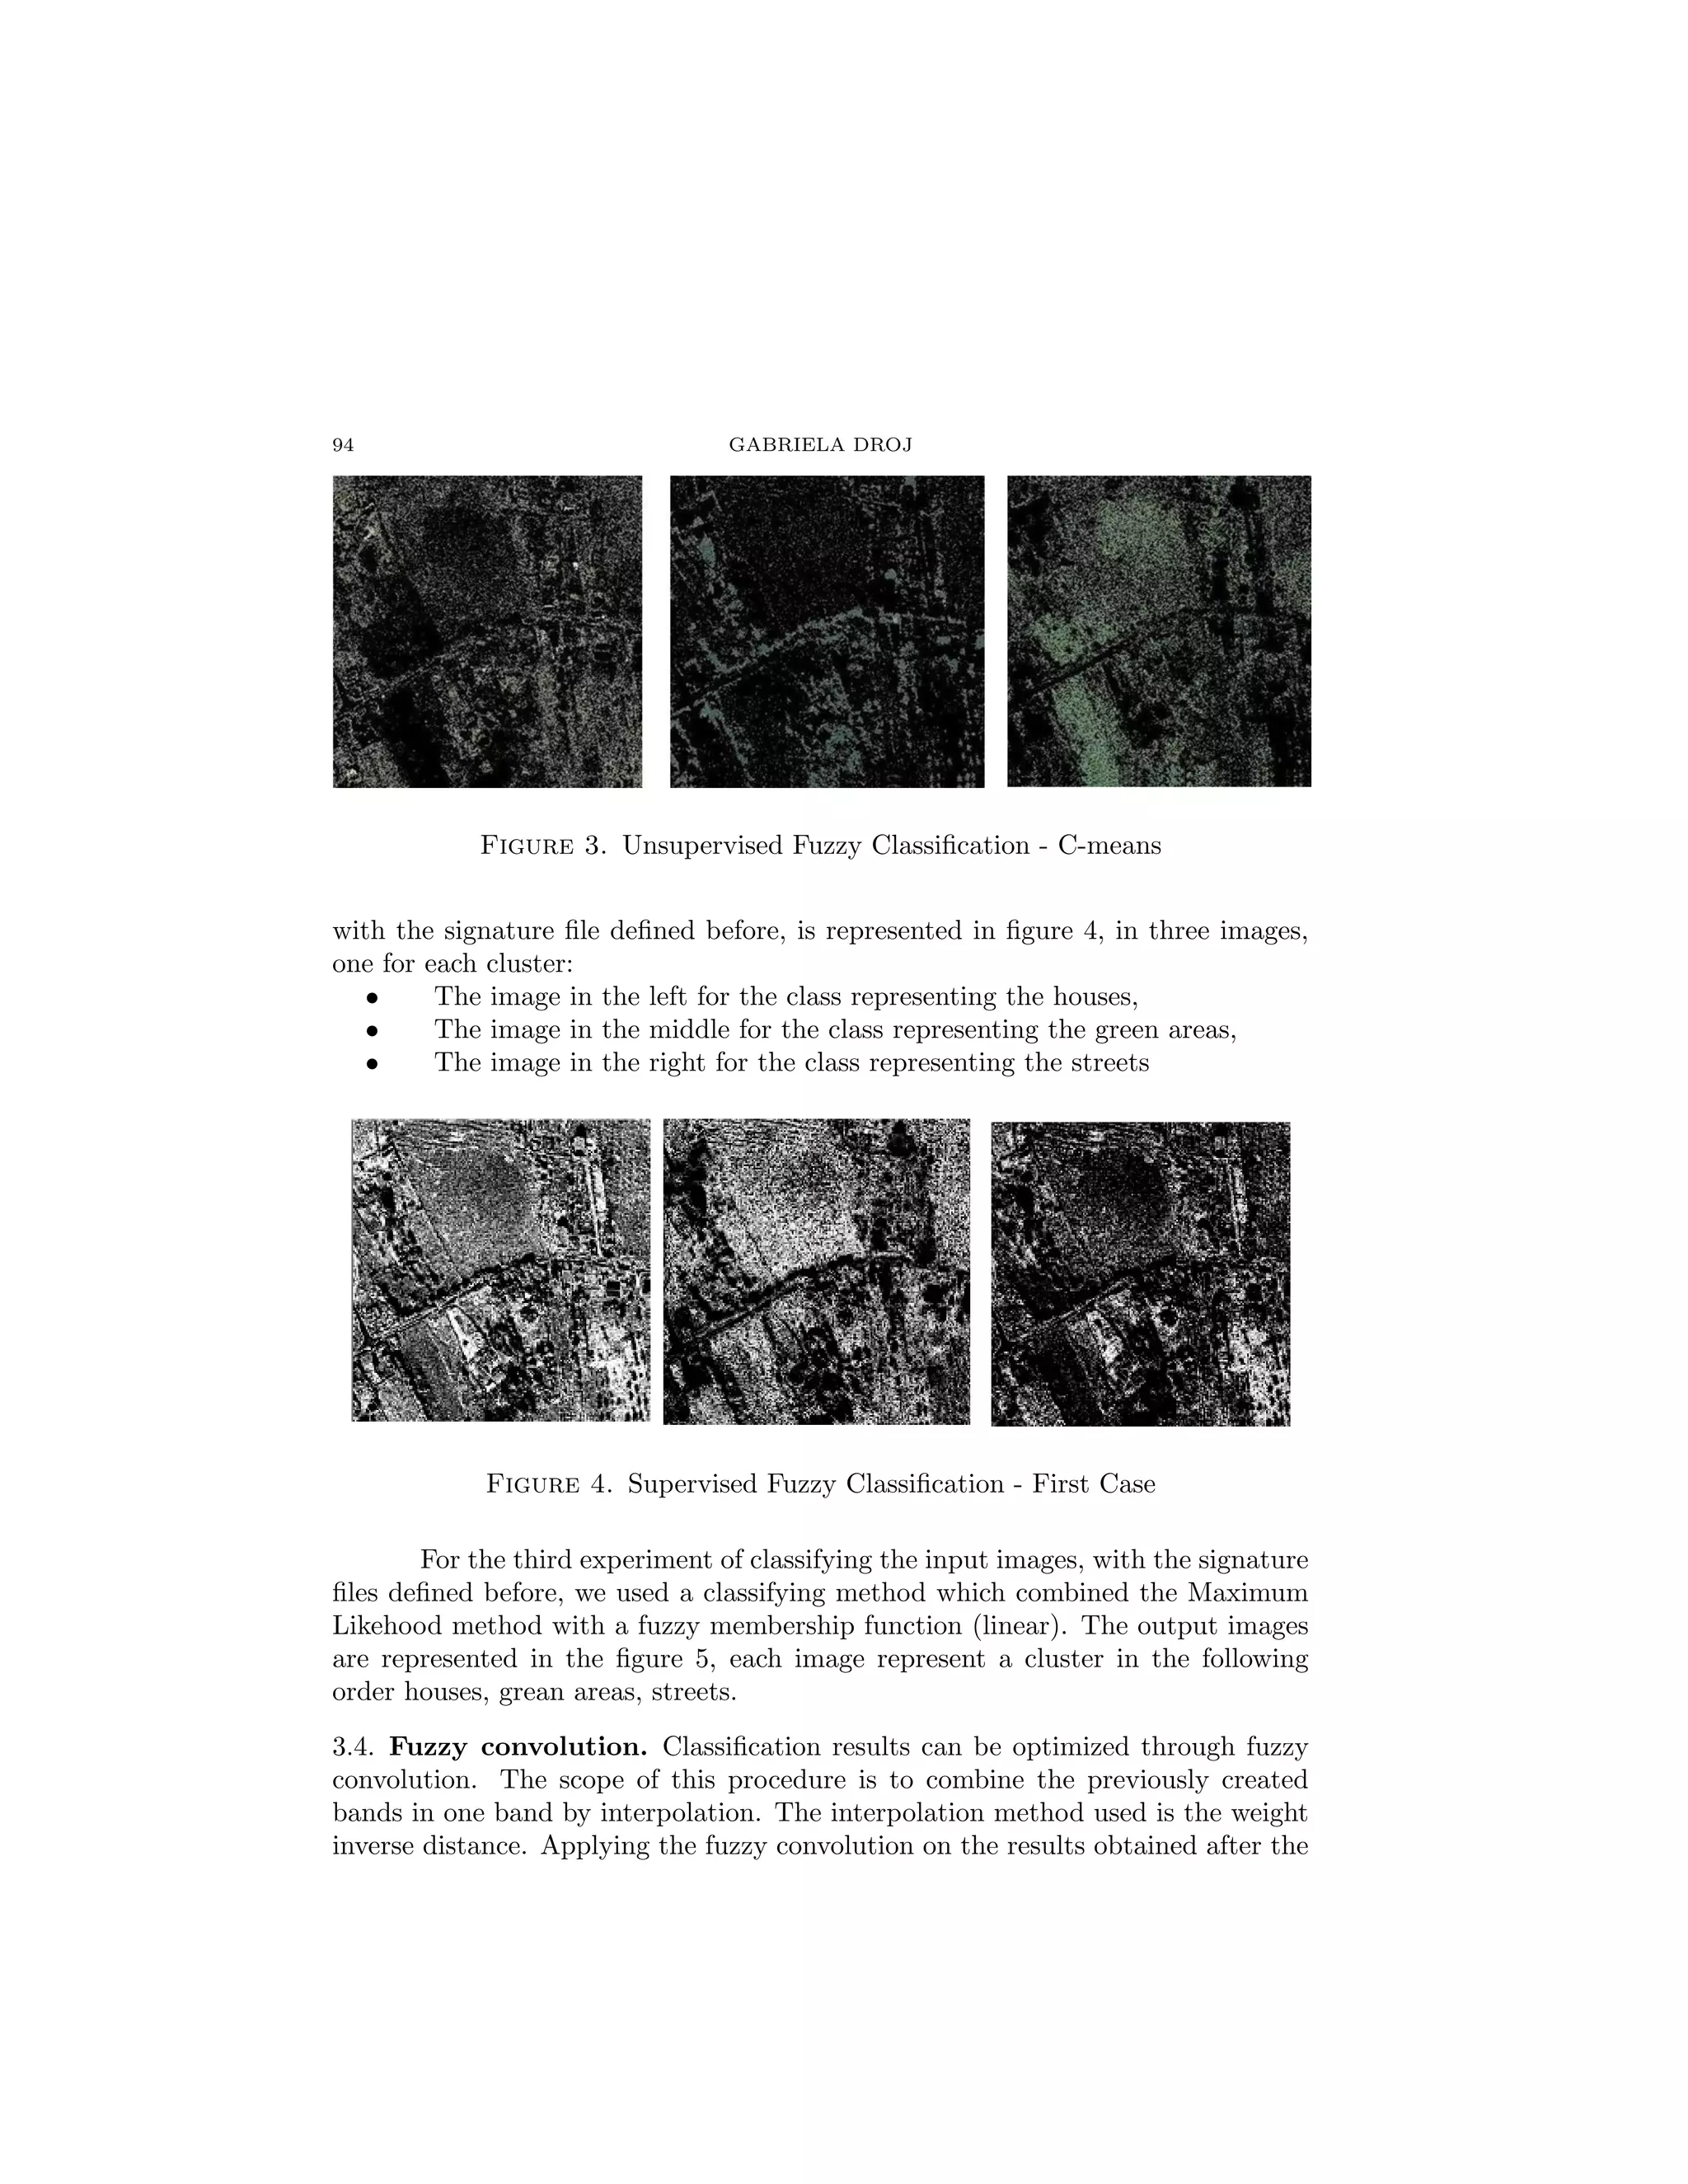
2.1. Unsupervised Fuzzy Classification. The unsupervised classification is a
completely automatic process; it’s eliminating the user and in the same time the
influence of known information. This kind of clustering procedure is used where
are no information about the site represented in the image to be classified.[Tur]
The most popular unsupervised classification methods are ISODATA and the
k-means algorithm. [Eas01, Su03] There are many unsupervised classification
algorithms based on fuzzy set theory, we mention fuzzy c-means, fuzzy Gustafson
– Kessel algorithm, fuzzy c - shells and genetic algorithm and so on.[Ben03, Tur].
One of the most popular fuzzy based unsupervised classifications is the Fuzzy
c-means algorithm, similar to K-means algorithm.
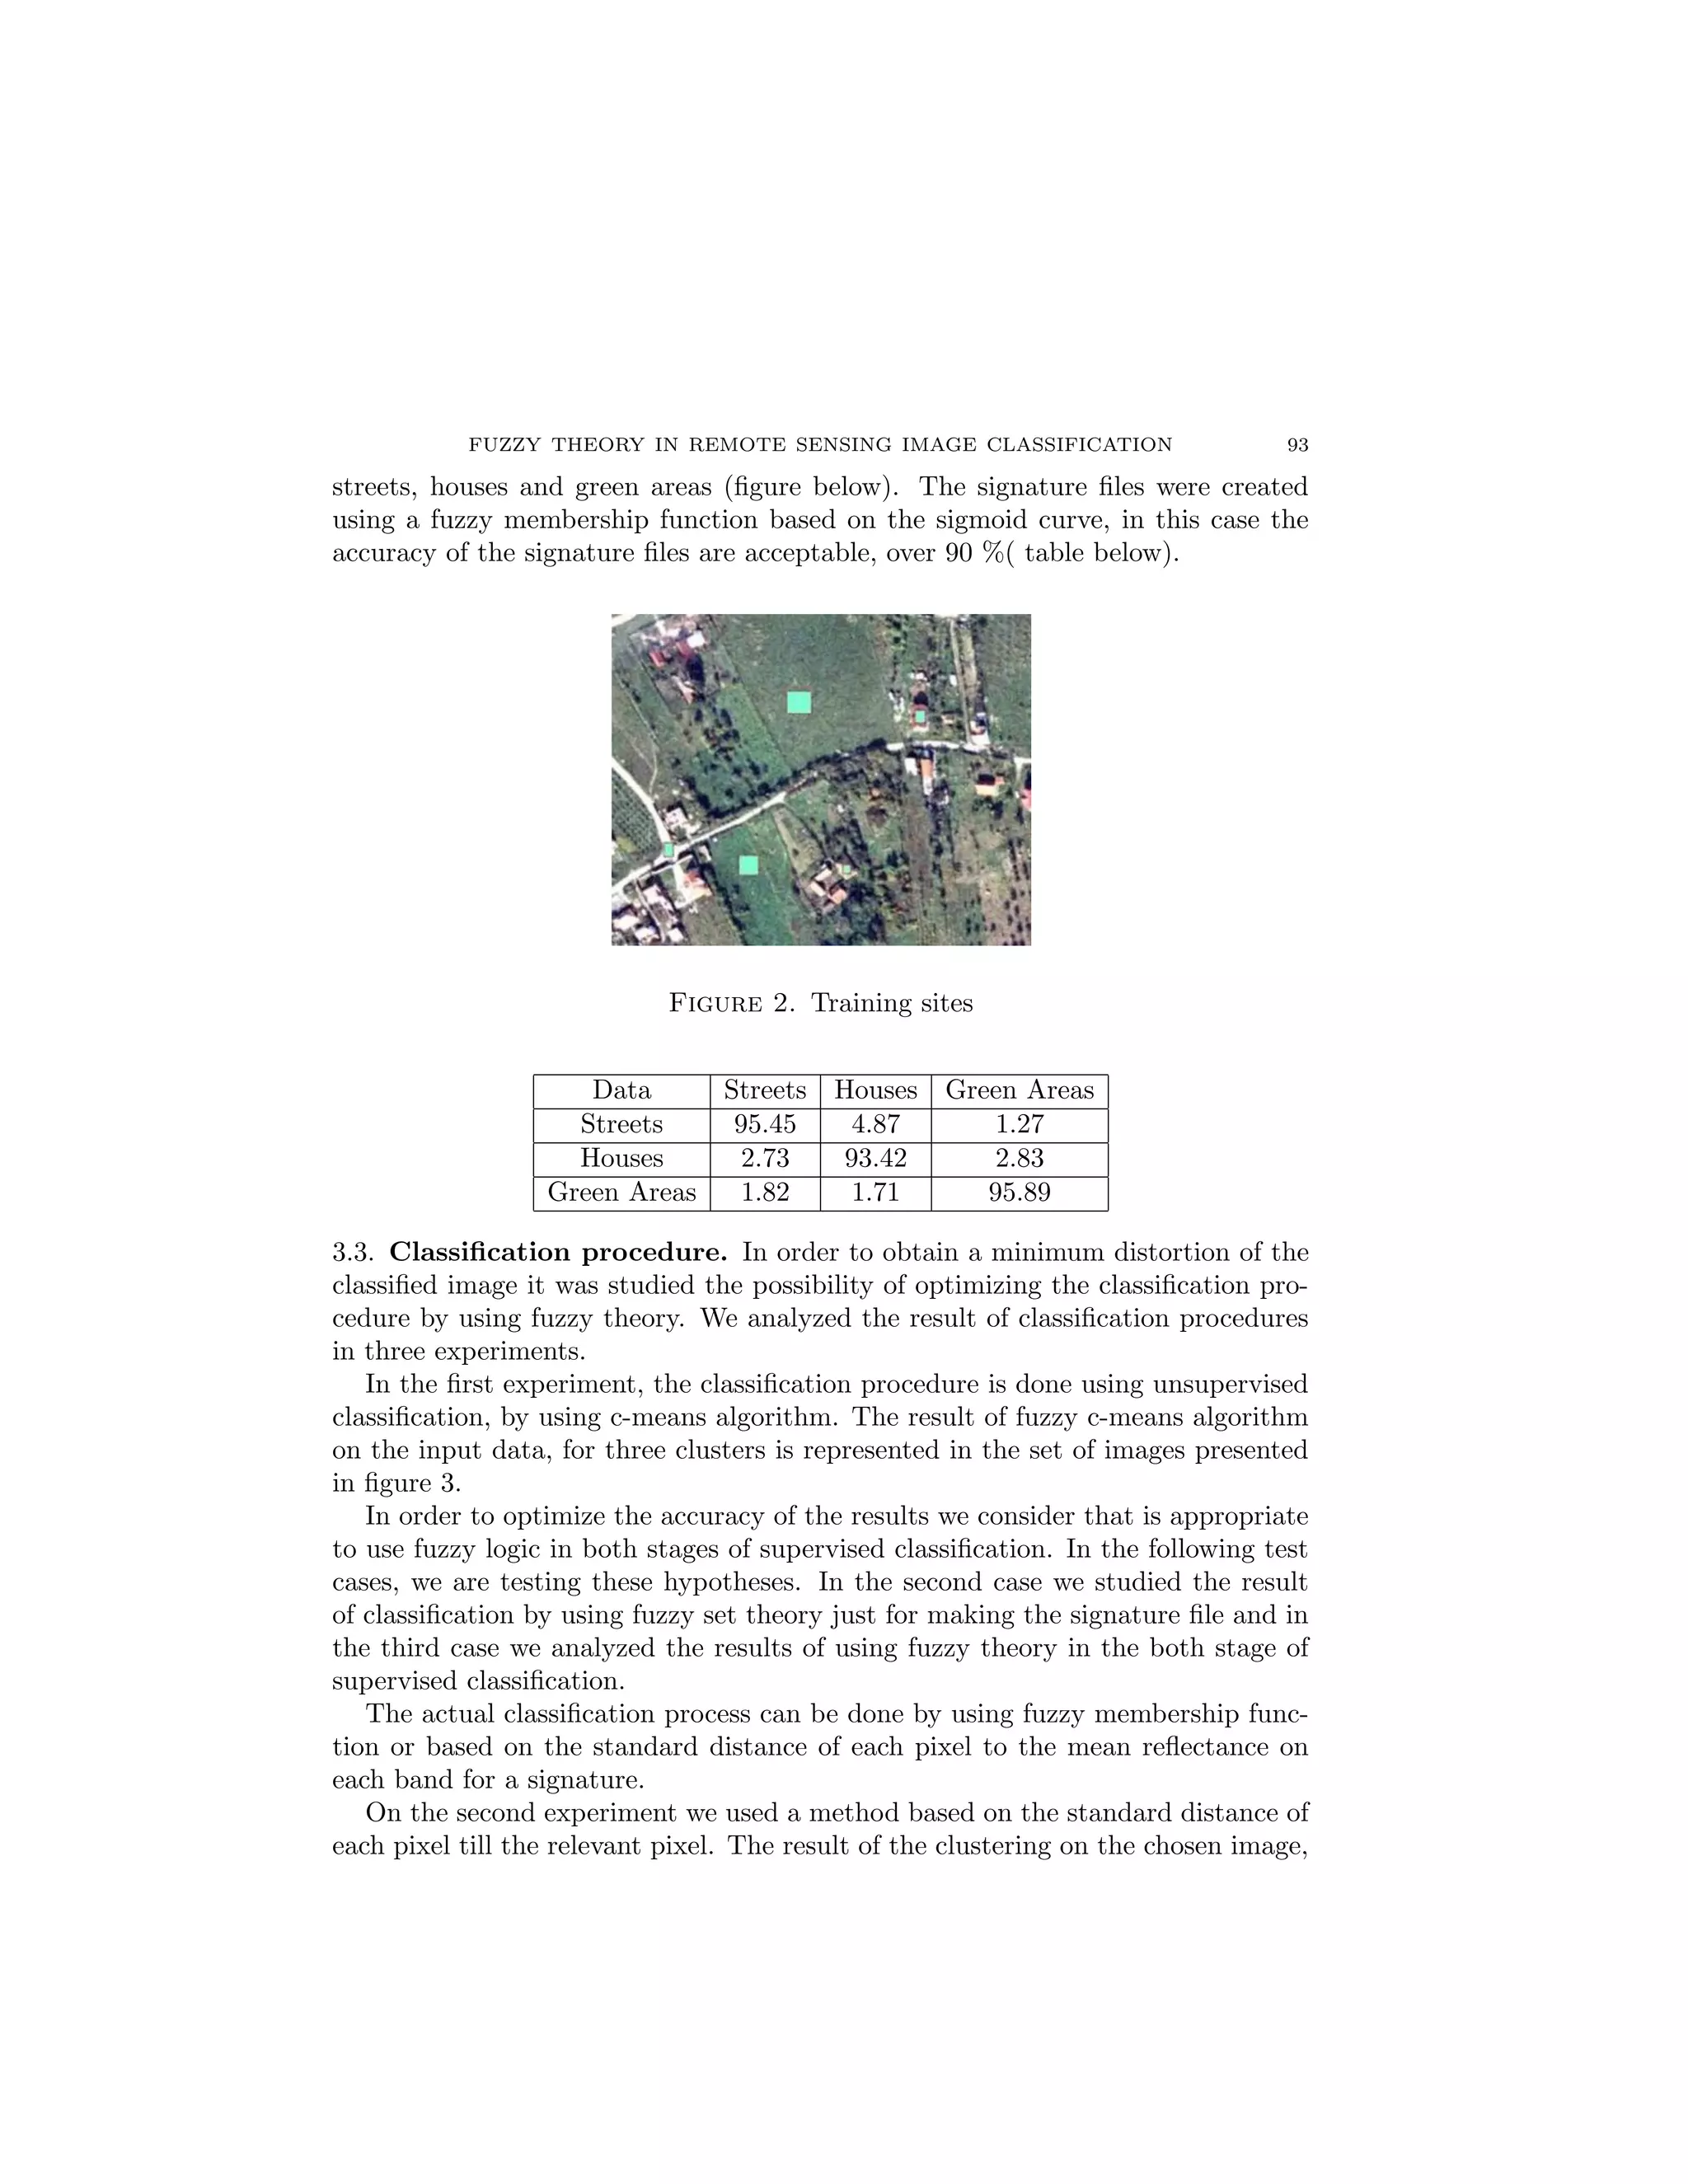
2.2. Supervised Classification. The results of classification can be optimized
if there are known information about the image to be clustered. In this case the
method used is called supervised classification. The supervised classification is
made in two steps. The first step is to create signature files (training sites) and
the second step is the classification itself. The fuzzy logic can be used in the
creation of the signatures files and also in the process of the classification itself,
but is not necessary to be used in both stages. [Ben03, Eas01, Liu03, Ste99, Su03]
The signatures files based on this training site can be created using unsuper-
vised classification methods (like ISODATA), classical methods (like Maximum
Likehood or Minim Distance) or by computing a fuzzy matrix filled with the values
indicated by the membership grade of each training site [Eas01]. The membership
degree is computed by using fuzzy membership functions like: piecewise linear
functions, the Gaussian distribution function, the sigmoid curve and quadratic or
cubic polynomial curve. The evaluation on the training can be done using statis-
tical methods: minimum, maximum, mean, and standard deviation for each band
independent and covariance matrix for all the three bands. The most relevant sig-
nature file evaluation is creating an error matrix as a matrix of percentages based
on pixel counts that allows us to see how many pixels in each training sample were
assigned to each class.
The second step of the supervised classification can also be processed with tradi-
tional methods (Minimum distance, Mahalanobis distance or Maximum Likehood)
or by using fuzzy membership functions or genetic algorithm. This stage cannot
be evaluated alone, it can be evaluated just the final result of the supervised clas-
sification.
In order to optimize the accuracy of the results we consider that is appropriate
to use fuzzy logic in both stages of supervised classification. In the next chapter
we are testing these hypotheses.
2.3. Fuzzy convolution. Independently of the classification method used, in or-
der to optimize the results we propose usage of the fuzzy convolution operation.
Fuzzy convolution creates a single classification band by calculating the total
weighted inverse distance of all the classes in a window of pixels and assigning](https://image.slidesharecdn.com/fuzzyinremoteclassification-studia-100218153944-phpapp01/75/Fuzzy-In-Remote-Classification-3-2048.jpg)
![96 GABRIELA DROJ
Unsupervised Supervised - first case Supervised - second case
Overall accuracy 34% 72% 83,9%
Kappa 0.1151 0.3421 0.4476
Overall Agreement 0.31 0.69 0.89
5. Conclusion
The major advantage of Fuzzy logic theory is that it allows the natural de-
scription of data and problems, which should be solved, in terms of relationships
between precise numerical values. Fuzzy sets make possible not only the definition
of uncertain, vague or probabilistic spatial data, but also allow relationships and
operations on them.
The usage of fuzzy theory has implications in improving the quality of the
classification of airborne images and object recognition. The Fuzzy set theory of-
fers instruments for supervised and unsupervised classification. The unsupervised
fuzzy based classification allows clustering of data, where no a priori information
known (c-means algorithms), but the supervised classification is offering higher
quality.
The Fuzzy set theory represents a powerful instrument in designing efficient
tools to process remote sensing images and also to support the spatial decision-
making process.
References
[Ben03] Benz, U.; Hofmann, P.; Willhauck, G.; Lingenfelder, I.; Heynen, M. - Multi-resolution,
object-oriented fuzzy analysis of remote sensing data for GIS-ready information, Journal
of Photogrammetry & Remote Sensing, 2004
[Eas01] Eastman, R – Idrisi 32 Release 2, Guide to GIS and Image Processing, Volume I- II,
Clark University, May 2001
[Gue03] Guesgen, H.;Hertzberg, J.; Lobb, R.;Mantler, A. – Buffering Fuzzy Maps in GIS, Spatial
Cognition and Computation, 2003
[Liu03] Liu, H., Li. J., Chapman, M. A.;- Automated Road Extraction from Satellite Imagery
Using Hybrid Genetic Algorithms and Cluster Analysis, Journal of Environmental In-
formatics 1 (2) 40-47 (2003)
[Ste99] Stefanakis, E.; Sellis, T.- Enhancing a Database Management System for GIS with Fuzzy
Set Methodologies, Proceedings of the 19th International Cartographic Conference, Ot-
tawa, Canada, August 1999.
[Su03] Su-Yin Tan - A Comparison of the Classification of Vegetation Characteristics by Spec-
tral Mixture Analysis and Standard Classifiers on Remotely Sensed Imagery within the
Siberia Region, International Institute for Applied Systems Analysis Austria, 2003
[Tur] Turˇan, A.; Ocel´ a, E.; Madar´sz, L. – Fuzzy c-means Algorithms in Remote Sensing,
c ıkov´ a
Technical University of Kosice
City Hall of Oradea, GIS Department](https://image.slidesharecdn.com/fuzzyinremoteclassification-studia-100218153944-phpapp01/75/Fuzzy-In-Remote-Classification-8-2048.jpg)

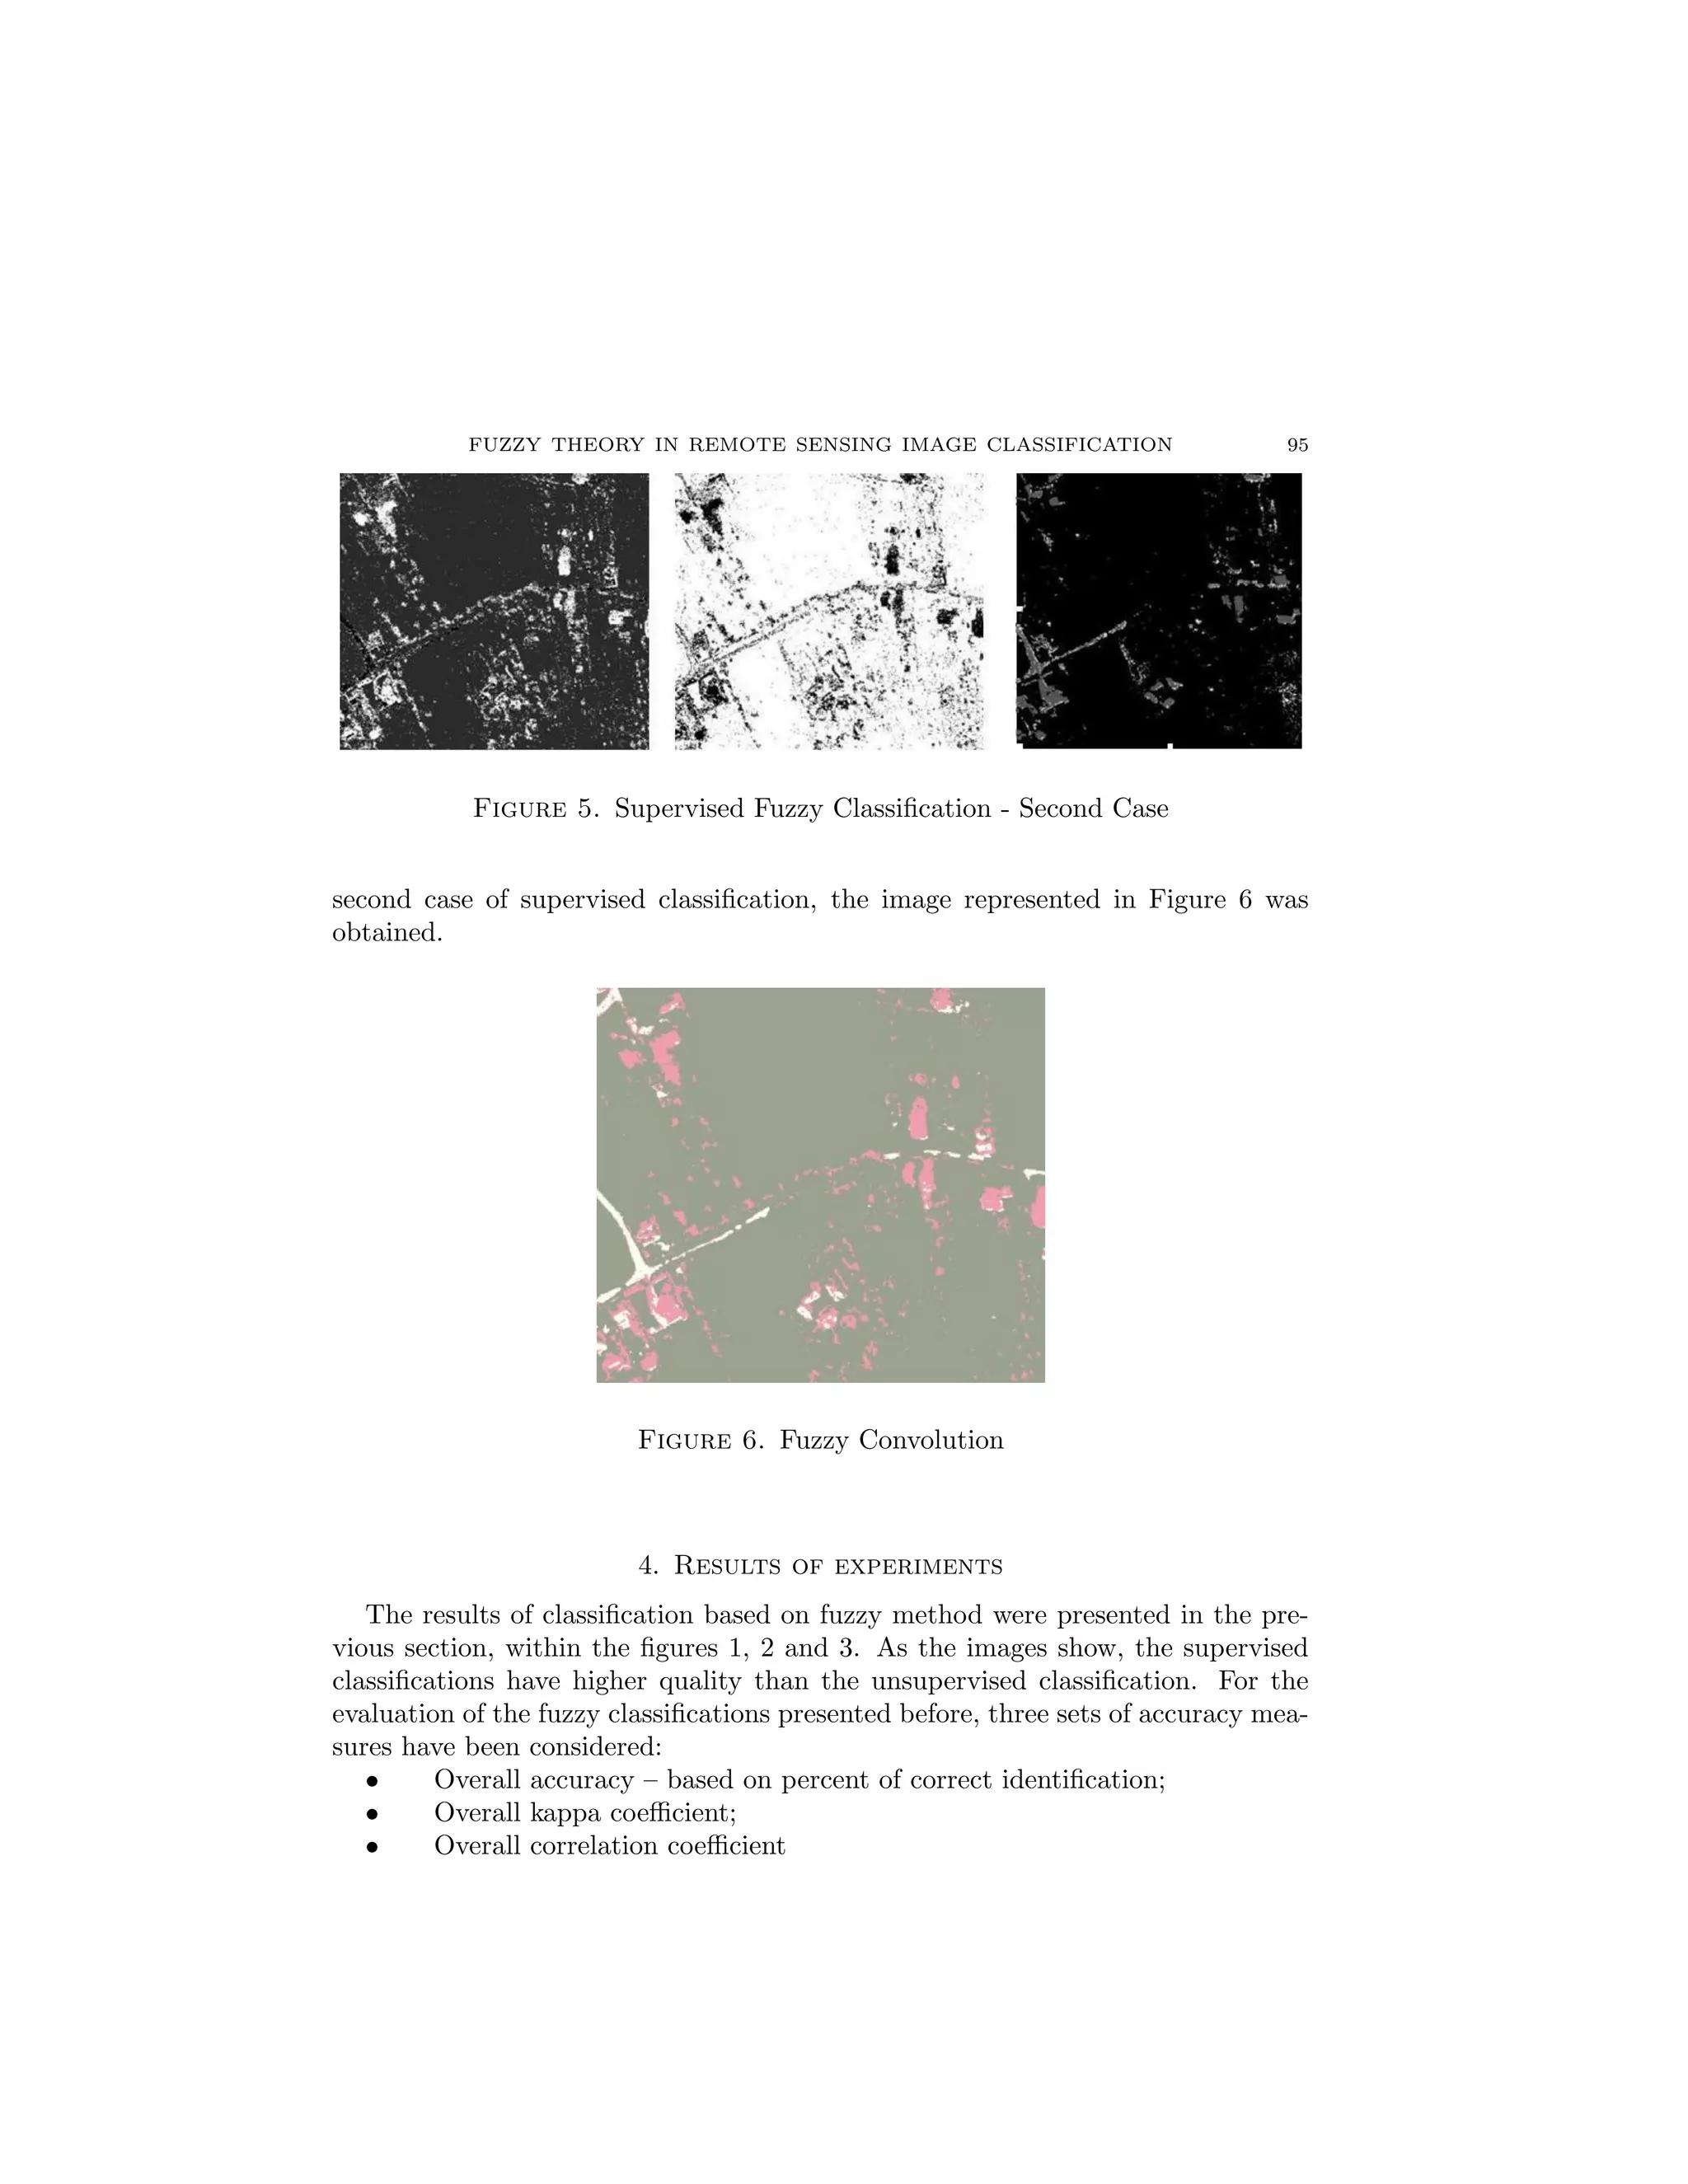
The document discusses the applicability of fuzzy theory in remote sensing image classification. It presents three experiments comparing different classification methods: 1) Unsupervised fuzzy c-means classification, 2) Supervised classification using fuzzy signatures, 3) Supervised classification using fuzzy signatures and membership functions. The supervised fuzzy methods achieved higher accuracy than the unsupervised method, with the third method performing best with an overall accuracy of 83.9%. Fuzzy convolution can further optimize results by combining classification bands.