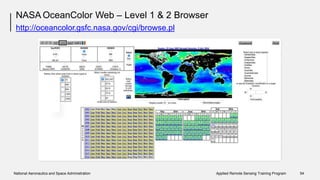
Downloaded 16 times


![Hyperspectral Imager for the Coastal Ocean (HICO)
http://hico.coas.oregonstate.edu/; http://oceancolor.gsfc.nasa.gov/cms/data/hico
• Partnership with U.S. Naval Research Lab, Office of Naval Research,
and NASA
Oregon State University,
•
•
•
•
Active 2009 – 2014 aboard the International Space Station (ISS)
380 nm to 960 nm at 5.7 nm spectral resolution
m290 spatial resolution
Targeted data collection
Davis, C. O. (n.d.). The Hyperspectral
Imager for the Coastal Ocean (HICO):
Sensor and Data Processing
Overview [PDF]. International Ocean
Colour Coordinating Group.
National Aeronautics and Space Administration Applied Remote Sensing Training Program 33](https://image.slidesharecdn.com/fundamentals-aquatic-web-180502144708/85/Fundamentals-aquatic-web-33-320.jpg)

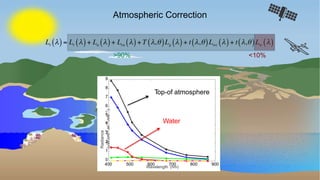
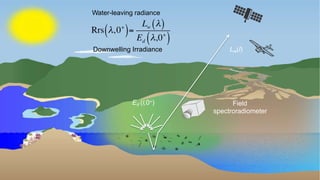
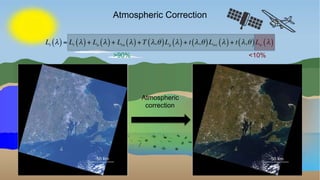
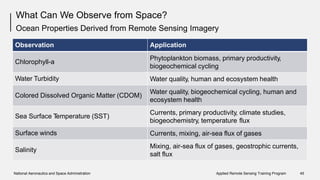
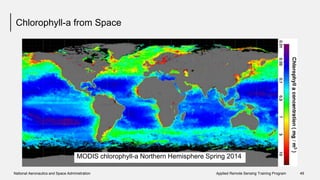


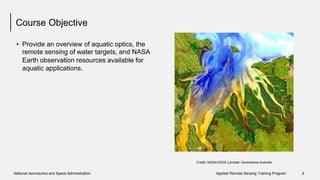
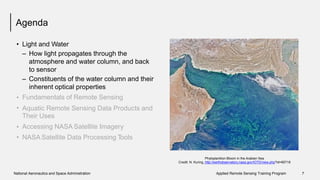
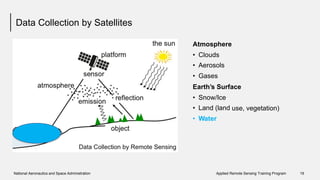
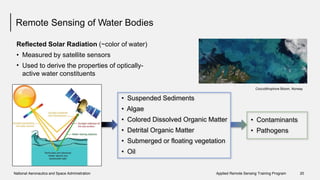
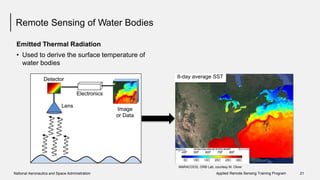
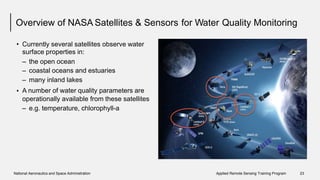
The document provides an overview of aquatic remote sensing, focusing on remote sensing principles, aquatic optics, and the various NASA satellite resources available for monitoring water quality and other aquatic parameters. It details the advantages of remote sensing, including synoptic coverage and the ability to observe remote locations, as well as the types of data products generated from satellite observations. Additionally, it discusses satellite capabilities, processing levels, and applications related to water quality assessment and ecosystem health.


