The document discusses improvements to satellite imaging technology, focusing on the new Advanced Baseline Imager (ABI) onboard GOES-R satellites. ABI will provide higher resolution images, new spectral channels, and improved temporal resolution compared to current GOES imagers. Specifically:
1) ABI will capture visible, infrared, and near-infrared channels at finer resolutions of 0.5-2km compared to 1-4km for current imagers.
2) It adds new spectral channels that improve monitoring of vegetation, fires, snow/ice, and hurricane intensities.
3) ABI allows for more frequent full Earth scans every 15 minutes compared to every 26 minutes currently, improving weather monitoring capabilities.
- The document discusses using hyperspectral remote sensing for mineral mapping. It provides background on how minerals have unique spectral signatures and defines hyperspectral imagery as image cubes with spatial and spectral data.
- Two case studies are summarized that demonstrate using techniques like atmospheric correction, MNF transformation, and spectral analysis tools like SAM and MTMF on Hyperion satellite imagery to map minerals in areas of India and Pakistan. Key minerals identified include grossularite, calcite, pyrite, andradite, and dolomite.
- The methodology involves preprocessing the hyperspectral cube, identifying endmembers, and then classifying and mapping minerals present based on their spectral properties and signatures in the imagery.
Remote Sensing And GIS Application In Mineral , Oil , Ground Water MappingMin...Swetha A
Remote sensing and GIS techniques can be used to map minerals, oil, and groundwater. For minerals, accommodation zones between faults can localize magmatic material and mineralized fluids, and be identified in satellite images showing brecciation and fault patterns. Oil and gas exploration uses airborne magnetic and gravity surveys integrated with high resolution satellite imagery and DEMs for 3D visualization. Groundwater mapping involves literature review, image interpretation to create spatial databases, field reconnaissance, spatial analysis of data, and identifying recommended recharge structures by analyzing IRS satellite images, groundwater table maps, DEM elevation data, and resistivity curve modeling from electrical soundings.
The use of geoinformatics in mineral exploration and exploitationMarguerite Walsh
The document discusses the use of geoinformatics, including remote sensing techniques, in mineral exploration and exploitation. It provides several case studies demonstrating how different remote sensing data and techniques can be used to map surface geology and identify potential mineral deposits. These include using Landsat and ASTER satellite imagery to map surficial mineralogy across large areas, detect hydrothermal alteration zones indicating gold mineralization, and identify geothermal anomalies. Integrating remote sensing data with other spatial datasets in a GIS provides additional insights. Future opportunities discussed include the increasing use of unmanned aerial vehicles and the upcoming Sentinel-2 satellite mission.
Collection and Interpretation of Remote Sensing Data, Kasper Johansen, Univer...becnicholas
This document discusses the collection and interpretation of remote sensing data. It begins by introducing remote sensing and its applications, such as mapping biomass, surface temperature, elevation, coral reefs, and flooding from cyclones. It then discusses how to collect remote sensing data from various sources and the associated costs. The document presents a case study on mapping the condition of savanna riparian zones in northern Australia through field surveys and high-resolution image data. Field data on vegetation parameters was collected and biophysical models were developed to map canopy cover and other metrics.
Applications of remote sensing in geological aspectsPramoda Raj
Remote sensing uses sensors on airborne or spaceborne platforms to detect and record electromagnetic radiation from the Earth's surface. It has two main phases - data acquisition through sensors and data analysis. In geology, remote sensing is used to map lithology, structural features, and monitor hazards. It helps identify rock types and structures that can indicate mineral or oil and gas deposits. Remote sensing provides synoptic data to study geomorphology, hydrology, and other Earth processes over large areas.
APPLICATION OF REMOTE SENSING AND GIS IN AGRICULTURELagnajeetRoy
India is a country that depends on agriculture. Today in this era of technological supremacy, agriculture is also using different new technologies like some robotic machinery to remote sensing and Geographical Information System (GIS) for the betterment of agriculture. It is easy to get the information about that area where human cannot check the condition everyday and help in gathering the data with the help of remote sensing. Whereas GIS helps in preparation of map that shows an accurate representation of data we get through remote sensing. From disease estimation to stress factor due to water, from ground water quality index to acreage estimation in various way agriculture is being profited by the application of remote sensing and GIS in agriculture. The applications of those software or techniques are very new to the agriculture domain still much more exploration is needed in this part. New software’s are developing in different parts of the world and remote sensing. Today farmers understand the beneficiaries of these kinds of techniques to the farm field which help in increasing productivity that will help future generation as technology is hype in traditional system of farming.
This document provides an overview of the AFOSR Space Science portfolio presented by Dr. Kent Miller at the 2013 AFOSR Spring Review. The portfolio focuses on specifying and forecasting the geospace environment from the Sun to Earth's upper atmosphere for situational awareness and space control. It includes research areas of solar/heliospheric physics, magnetospheric physics, ionospheric/thermospheric physics. The Air Force has an interest in space weather due to effects on satellites from drag, radiation belts, and communications/navigation. Ongoing projects aim to improve predictions of solar activity, neutral densities, ionospheric irregularities, and the radiation belts. Challenges include developing a comprehensive "Sun to Earth"
This talk summarizes the use of imaging spectroscopy to map minerals in various environments, including Cuprite, Nevada, Mars, the Moon, and post-9/11 at the World Trade Center site. Imaging spectroscopy can identify minerals like kaolinite, olivine, and buddingtonite and map their distributions. It revealed fire locations and temperatures after 9/11. Advances in algorithms and sensors continue to improve mineral and material mapping abilities.
WE4.L10.5: ADVANCES IN NIGHTTIME SATELLITE REMOTE SENSING CAPABILITIES VIA TH...grssieee
The document discusses new capabilities for nighttime satellite remote sensing that will be enabled by the Visible Infrared Imaging Radiometer Suite (VIIRS) Day/Night Band (DNB) sensor on the Joint Polar Satellite System. The DNB will allow detection of low levels of visible light, enabling observations of clouds, aerosols, snow cover and other environmental parameters at night. It provides examples of potential multi-spectral applications using the DNB, including lunar reflection methods, detection of clouds, fires, dust, and city lights. The high resolution nighttime data from DNB presents opportunities to augment existing environmental data records.
PERSISTENT SCATTERER SAR INTERFEROMETRY APPLICATION.pptxgrssieee
This document discusses the application of persistent scatterer interferometry (PSI) to study landslides in the Berkeley Hills. PSI uses phase information from SAR images taken at different times to measure surface deformation with millimeter accuracy. It was applied using Envisat, ERS, Radarsat, and TerraSAR-X data. Thousands of persistent scatterers were identified, allowing measurement of surface motion along the Hayward Fault and within landslides. Future work will continue monitoring with additional SAR data to better resolve three-dimensional landslide motions.
This presentation cover description of microwave remote sensing, Active and Passive Microwave remote sensing, RADAR, Slant range distortion like Foreshortening and Layover, Sar image and some Recent works in where microwave remote sensing has used to detect natural calamities
Chronological Calibration Methods for Landsat Satellite Images iosrjce
This document describes methods for chronologically calibrating Landsat satellite images to account for differences when images are taken days apart. It discusses correcting ETM+ images for scan line failures and converting digital numbers to reflectance. Two methods are proposed to remove phenological effects between Landsat 7 and 8 images taken 8 days apart: linear regression and cross-correlation. Image classification using the visible red and near infrared bands is used to validate the correction methods by comparing land cover detection in study area images.
This document summarizes a book about using GPS for precise relative positioning of formation flying satellites. The book focuses on using dual-frequency GPS data and integer ambiguity resolution to determine relative positions between satellites with accuracy of a few millimeters. It describes processing techniques like the Lambda method to resolve integer ambiguities in real-time. Formation flying has benefits for earth observation and gravity field mapping missions by coordinating smaller satellites.
This study investigated the use of aerial photographs collected from an unmanned aerial vehicle (UAV) to map and monitor mangrove communities in Port Hedland, Western Australia at a high spatial resolution. The UAV collected imagery of mangrove sites with a pixel size of 2cm, allowing classification of mangroves down to the individual plant level. Analysis of the imagery found that the two dominant mangrove species, Avicennia marina and Rhizophora stylosa, made up 88% of the living canopy cover across the two study sites. The high resolution imagery from the UAV provides an effective method for detailed and frequent monitoring of mangrove community composition and health.
Glaciers are large, dense accumulations of snow and ice that form on land where snowfall exceeds melting over many years. They are distinct from sea ice and lake ice. Glaciers cover 10% of the world's land area and store the largest reservoir of fresh water on Earth. The scientific study of glaciers is called glaciology and involves understanding their relationships with climate, sea levels, and impacts on humans and the environment. Remote sensing techniques such as aerial photography, satellite imagery, and radar are powerful tools for monitoring and mapping glaciers, which are often located in remote areas. Different sensors can detect glacial features, measure glacier flow velocities, and help determine mass balances and snowmelt runoff.
This document compares aerial photography and satellite remote sensing. [1] Aerial photography uses cameras mounted on aircraft to capture overlapping photos at fixed altitudes, while satellites capture continuous image strips from orbit. [2] Aerial photography provides higher resolution images but is limited by weather and environment, while satellites can image any location but provide lower resolution. [3] Both techniques image the electromagnetic spectrum, but satellites can capture non-visible data like infrared and radar not restricted by time of day.
1) Stratospheric balloons equipped with GPS radio occultation systems and dropsonde payloads were used to profile the Antarctic atmosphere as part of the Concordiasi campaign. Over 700 occultation profiles and 647 dropsonde profiles were collected.
2) Comparisons were made between refractivity profiles derived from GPS occultation data near the Antarctic Peninsula, dropsonde measurements, and the ARPEGE model. Generally good agreement within 2% was found between the occultation and model data, and within 1% between occultation and dropsonde data.
3) This demonstration of high quality occultation data from balloons indicates potential for assimilating such data into models to improve analyses of the Antarctic
This document discusses various techniques for monitoring landslides, including remote sensing, photogrammetry, ground-based surveying, GPS, and geotechnical methods. Remote sensing techniques discussed include synthetic aperture radar (SAR), interferometric SAR (InSAR), and RADAR systems which use radio waves to detect ground movement. Photogrammetry allows interpretation of aerial photos to identify landslides. Ground surveying employs techniques like triangulation and leveling. GPS provides location and velocity data through satellite signals. Geotechnical sensors monitor deformation underground through extensometers, inclinometers, piezometers, and other instruments.
The document discusses the use of Synthetic Aperture Radar (SAR) and InSAR techniques for monitoring solid earth geophysics hazards. SAR uses microwaves to generate high-resolution images of the Earth's surface independently of solar illumination. InSAR uses multiple SAR images to measure surface changes down to the centimeter scale, such as caused by earthquakes or subsidence. It discusses various InSAR techniques including DifSAR, Persistent Scatterer InSAR, and Corner Reflector InSAR and their applications in oil and gas, mining, infrastructure and hazard monitoring. The document also lists several commercial and open-source InSAR processing software packages.
Image classification and land cover mappingKabir Uddin
The document introduces land cover mapping techniques using satellite images, noting that land cover represents physical materials on Earth's surface and can be mapped through analysis of remotely sensed imagery or field surveys, with accurate land cover information supporting applications like planning, disaster management, and policy development.
Summary of current radiometric calibration coefficients for Landsat MSS, TM, ETM+,
and EO-1 ALI sensors
Gyanesh Chander a,⁎, Brian L. Markham b, Dennis L. Helder c
a SGT, Inc. 1 contractor to the U.S. Geological Survey (USGS) Earth Resources Observation and Science (EROS) Center, Sioux Falls, SD 57198-0001, USA
b National Aeronautics and Space Administration (NASA) Goddard Space Flight Center (GSFC), Greenbelt, MD 20771, USA
c South Dakota State University (SDSU), Brookings, SD 57007, USA
hyperspectral remote sensing and its geological applicationsabhijeet_banerjee
this is an introductory presentation on hyperspectral remote sensing, which essential deals with the distinguishing features, imaging spectrometers and its types, and some of the geological applications of hyperspectral remote sensing.
GIS and remote sensing can be used together for various applications. GIS is a system for gathering and analyzing geographic data, while remote sensing detects physical characteristics of an area from a distance using sensors. Some key uses of the technologies together include mapping geological features, monitoring sand and gravel deposits, exploring for minerals and hydrocarbons, and studying environmental and plant geography.
Mapping fire: Can spatially explicit criteria and indicators be developed?CIFOR-ICRAF
Presented by Solichin Manuri, Senior Advisor at Diameter Consulting, Bogor, Indonesia, at "Online Webinar 2: Biophysical Attributes and Peatland Fires", on 14 October 2020
In this session the speaker shared information on mapping fire (extent and occurrences) in tropical peatlands including in Indonesia. This session also shared insights on the existing methods that can be used for fire mapping and comparisons. This session also emphasized that spatial explicit criteria for fire should be developed depending on the method and data used.
Hyperspectral remote sensing uses narrow, contiguous bands across the electromagnetic spectrum to characterize vegetation. It is useful for studying species composition, crop/vegetation type, biophysical properties like leaf area index and biomass, biochemical properties like chlorophyll and moisture, and stress factors. Hyperspectral data comes from airborne, ground, and spaceborne sensors, with spaceborne providing global continuous coverage but at lower spatial resolution than airborne sensors. Hyperspectral data cubes contain hundreds of bands providing detailed spectral signatures to distinguish vegetation.
GPS uses a constellation of 24 satellites that orbit Earth and emit signals to allow GPS receivers to determine their precise location. It was developed by the U.S. Department of Defense and consists of three segments - the space segment with the satellites, the control segment consisting of ground stations that monitor the satellites, and the user segment made up of receivers that detect satellite radio signals and use triangulation to calculate the user's position. GPS has both military and civilian applications including navigation, mapping, tracking resources and people.
El SANTUARIO ANTE EL MARKETING DEL DESTINO RELIGIOSO Syddney Potoy
El documento describe el santuario como un lugar sagrado de peregrinación y encuentro con lo divino, que atrae a multitudes movidas por la fe. Sin embargo, alrededor de los santuarios también surgen actividades comerciales y de marketing. El documento explora cómo los santuarios pueden dialogar con estas dinámicas de manera que no manipulen lo sagrado, proponiendo líneas de distinción, apoyo mutuo y trabajo en común entre lo religioso y lo comercial.
Tom Carvel started selling ice cream from the back of a truck in 1934 after borrowing $15 from his wife. He went on to create one of the first soft serve ice cream machines and pioneered the franchising model by educating franchise owners and charging royalties. By the 1950s he had 25 stores and became famous for starring in unconventional marketing commercials. Carvel later established a charitable foundation and by 1984 his company had over 865 franchises and $300 million in annual sales.
Este documento describe un proyecto para construir un santuario mariano dedicado a Nuestra Señora de Lourdes en Managua, Nicaragua. El proyecto incluye la construcción de una basílica, casa sacerdotal, estacionamiento, capillas y otras instalaciones en un terreno de 86,100 metros cuadrados. El costo estimado es de US$13.35 millones, financiados principalmente por donaciones. El santuario atraerá peregrinos y turistas religiosos y promoverá el desarrollo espiritual.
La Unión Europea ha acordado un paquete de sanciones contra Rusia por su invasión de Ucrania. Las sanciones incluyen restricciones a las importaciones de productos rusos de alta tecnología y a las exportaciones de bienes de lujo a Rusia. Además, se congelarán los activos de varios oligarcas rusos y se prohibirá el acceso de los bancos rusos a los mercados financieros de la UE.
1) Advances in satellite sensor calibration technology have enabled more accurate monitoring of global climate trends from space.
2) Prior satellite sensors had limitations like spectral resolution and radiometric accuracy that made establishing long-term climate records difficult.
3) New satellite instruments under development can provide continuous high-resolution spectral coverage, onboard calibration, and reduced measurement uncertainties, enabling undisputed climate monitoring from space.
The Premier Seat Program allows members access to preferred seating areas at the Marcus Amphitheater during Summerfest concerts. There are two club levels to choose from, the Platinum Club and Gold Club, which provide the same seats for every show. Members also receive benefits like access to private hospitality areas with food and drinks, preferred parking, and some tax deductibility for the Platinum Club fee. The lineup for Summerfest 2010 is announced, featuring performers like Tim McGraw and Carrie Underwood.
John Pierpont Morgan founded J.P. Morgan & Co. in 1895 and dominated the railroad, steel, and electric industries as a leading American financier. However, he was also found to have engaged in illegal monopoly practices and business manipulation. Over time, J.P. Morgan & Co. merged with other companies to form today's JPMorgan Chase & Co., which is now worth approximately $2 trillion and remains internationally prominent in the financial world.
The document outlines Vielha e Mijaran's Priority Investment Plan (PIP) for 2015-2020, which was established within the framework of the European Fund for Strategic Investment (EFSI). The PIP aims to improve broadband access, transportation infrastructure, education, innovation, renewable energy, digitalization, and job opportunities in Vielha e Mijaran. It identifies 17 objectives and 25 strategic projects that align with the goals of the EFSI to make Vielha e Mijaran a smart, connected city that promotes public-private collaboration and achieves full employment within 5 years.
Tecnicas de curacion y cambio de apositosSyddney Potoy
Este documento describe los procedimientos para el cambio de apósitos y la curación de heridas. Explica los objetivos de la curación, los conceptos básicos, los cuidados de enfermería requeridos y los pasos para realizar una curación. También cubre temas como la vigilancia de infecciones, la evaluación de heridas, la periodicidad de curación y los signos de complicaciones o cicatrización. Finalmente, detalla diferentes técnicas para la limpieza y curación de heridas.
Aerial photography involves mounting cameras on aircraft to take overlapping photos from a fixed altitude. This allows for stereoscopic 3D imagery. Aerial photography provides higher resolution details but is limited by weather and environmental conditions. Satellite imagery provides faster, global coverage but lower resolution. Both methods can be affected by weather. Aerial photography allows more sensor flexibility while satellites provide a wider range of data types.
Using Remote Sensing Techniques For Monitoring Ecological Changes In Lakes: C...IJERA Editor
The ability to use remote sensing in studying lake ecology lies in the capability of satellite sensors to measure
the spectral reflectance of constituents in water bodies. This reflectance can be used to determine the
concentration of the constituents of the water column through mathematical relationships. This work identified a
simple linear equation for estimating suspended matter in Lake Naivasha with reflectance in Landsat7 ETM+
image. A R² = 0.94, n = 6 for suspended matter was obtained. Archive of Landsat imagery was used to
produce maps of suspended matter concentrations in the lake. The suspended matter concentrations at five
different locations in the lake over 30 year’s period were then estimated. It was therefore concluded that the
ecological changes Lake Naivasha is experiencing is the result of the high water abstraction and the effect of
climate change.
GNSS systems like GPS use satellites to allow receivers to determine their precise location and time. GPS is the most widely used global satellite navigation system, maintained by the US government for civilian and military use. It consists of space, control, and user segments. The control segment tracks satellites and sends commands, while the space segment transmits navigation signals. The user segment receives signals to calculate position, velocity and time. Other global and regional satellite systems include GLONASS, Galileo, BeiDou and SBAS like EGNOS, which augment GPS accuracy for aviation. SBAS transmit corrections via geostationary satellites to compensate for errors like ionospheric delays.
Greetings all,
Nowadays, several datasets are -or will be- available in a near future to improve operational forecasting in most aspects, like the
ocean dynamics modeling, and the assimilation efficiency, that aims now to optimize the combination of temperature/salinity in
situ profiles, drifter's velocities, and sea surface height deduce from altimeter's data and GRACE or future Goce geoid. But also
strengthen forecasting system's applications, like the climate monitoring. For all these issues, an optimal use of ocean data,
always too sparse and not enough numerous, is mandatory.
Such studies are at the heart of this Newsletter issue. It begins with a Rio M.H. and Hernandez F. review of the Goce Mission,
dedicated to focus and document the shortest scales of the Earth's gravity field. Goce satellite is due to fly in December 2007.
With the next article Guinéhut S. and Larnicol G. investigate the influence of the in situ temperature profiles sampling on the
thermosteric sea level estimation. They show that the impact is not negligible, and can introduce large errors in the estimation. In
the second article, Benkiran M. and Greiner E. are evaluating the benefits of the drifter's velocities assimilation in the Mercator
Océan 1/3° Tropical and North Atlantic operational system. A description of the assimilation scheme upgrade to take into account
velocity control is given. Castruccio F. & al. describe in the third article the performance of an improved MDT reference for
altimetric data assimilation. They concentrate their study on the Tropical Pacific Ocean. Finally, the Newsletter comes to an end
with the Benkiran M. article. In his study, based on the 1/3° Mercator system, the impact of several altimeters data on the
assimilation performance is assessed
Have a good read
GPS relies on principles of special and general relativity to account for relativistic effects that would otherwise cause errors. The Sagnac effect, which results from light traveling in opposite directions around a rotating object, must be considered and can cause time differences of hundreds of nanoseconds depending on satellite and receiver positions. An experiment in 1984 precisely measured the Sagnac effect using GPS satellites and atomic clocks at three locations, finding results that matched relativity predictions to within 5 nanoseconds.
First results from_the_hubble_opal_program_jupiter_in_2015Sérgio Sacani
Os cientistas usando o Telescópio Espacial Hubble da NASA/ESA produziram novos mapas de Júpiter, que mostram as contínuas mudanças que ocorrem com a famosa Grande Mancha Vermelha. As imagens também revelam uma rara estrutura em forma de onda na atmosfera do planeta que não tinha sido vista por décadas. A nova imagem é a primeira de uma série de retratos anuais dos planetas externos do Sistema Solar, que nos darão um novo olhar desses mundos remotos, e ajudarão os cientistas a estudarem como eles mudam com o passar do tempo.
Nessa nova imagem de Júpiter, uma grande quantidade de feições foi capturada incluindo ventos, nuvens e tempestades. Os cientistas por trás dessas novas imagens, as obtiveram usando a Wide Field Camera 3 do Hubble, num período de observação de mais de 10 horas e produziram assim dois mapas completos do planeta, a partir das suas observações. Esses mapas fizeram com que fosse possível determinar a velocidade dos ventos em Júpiter, com a finalidade de identificar diferentes fenômenos na sua atmosfera além de traquear as suas feições mais famosas.
As novas imagens confirmam que a grande tempestade que tem existido na superfície de nuvens de Júpiter por no mínimo 300 anos, continua a encolher, mas mesmo que desapareça, ela irá morrer lutando. A tempestade, conhecida como Grande Mancha Vermelha, é vista aqui fazendo seus movimentos em espiral no centro da imagem do planeta. Ela tem diminuído de tamanho de maneira muito rápida de ano em ano. Mas agora, a taxa de encolhimento parece ter reduzido novamente, mesmo apesar da mancha ser cerca de 240 quilômetros menor do que era em 2014.
High-resolution UV/Optical/IR Imaging of Jupiter in 2016–2019Sérgio Sacani
Imaging observations of Jupiter with high spatial resolution were acquired beginning in 2016, with a cadence of 53
days to coincide with atmospheric observations of the Juno spacecraft during each perijove pass. The Wide Field
Camera 3 (WFC3) aboard the Hubble Space Telescope (HST) collected Jupiter images from 236 to 925 nm in 14
filters. The Near-Infrared Imager (NIRI) at Gemini North imaged Jovian thermal emission using a lucky-imaging
approach (co-adding the sharpest frames taken from a sequence of short exposures), using the M′ filter at 4.7 μm.
We discuss the data acquisition and processing and an archive collection that contains the processed WFC3 and
NIRI data (doi:10.17909/T94T1H). Zonal winds remain steady over time at most latitudes, but significant
evolution of the wind profile near 24°N in 2016 and near 15°S in 2017 was linked with convective superstorm
eruptions. Persistent mesoscale waves were seen throughout the 2016–2019 period. We link groups of lightning
flashes observed by the Juno team with water clouds in a large convective plume near 15°S and in cyclones near
35°N–55°N. Thermal infrared maps at the 10.8 micron wavelength obtained at the Very Large Telescope show
consistent high brightness temperature anomalies, despite a diversity of aerosol properties seen in the HST data.
Both WFC3 and NIRI imaging reveal depleted aerosols consistent with downwelling around the periphery of the
15°S storm, which was also observed by the Atacama Large Millimeter/submillimeter Array. NIRI imaging of
the Great Red Spot shows that locally reduced cloud opacity is responsible for dark features within the vortex. The
HST data maps multiple concentric polar hoods of high-latitude hazes.
WE4.L10.1: OPERATIONAL ENVIRONMENTAL DATA IN 2010: CONNECTING GLOBAL AND LOCA...grssieee
This document provides a historical overview of remote sensing and the International Geoscience and Remote Sensing Symposium (IGARSS) from the 1960s to 2010. It discusses the early development of remote sensing technologies and societies, experimental missions like Nimbus and Seasat in the 1970s, and the growth of IGARSS in the 1980s with the launch of new operational sensors. It describes how remote sensing took on new roles in the 1990s related to policy and global change. Finally, it outlines new directions for 2010 and beyond with increased citizen involvement through smartphones, web tools, and crowdsourcing of data.
IrSOLaV provides solar energy consulting services including solar radiation estimation from satellite images, analysis of power plant production, auditing of solar plants, and meteorological data quality reports. The company's team of experts has experience in over 500 MW of CSP and PV projects. Key products and services include long-term solar irradiance estimation from satellite images, analysis of thermal and electrical production for solar energy systems, and quality assurance of radiometric data and plant performance.
Meteorological Technology International, Jan 2010laurajairam
This document discusses advances in satellite sensor technology that enable more accurate climate monitoring from space. Specifically:
1. Prior satellite sensors had limitations like coarse spectral resolution and degrading calibration over time, making it difficult to establish long-term climate trends from space data.
2. New technologies can achieve much greater measurement accuracy, stability over decades, fine spectral resolution, and precise knowledge of spectral response needed for undisputed climate monitoring.
3. Advances like onboard high-accuracy blackbody calibration sources and hyperspectral imaging bring National Institute of Standards and Technology calibration capabilities to satellites. This eliminates prior limitations and allows climate trends to be reliably measured from space.
Perspectives and Trends of Satellite Navigation.pptxroshan375533
This document discusses several topics related to satellite navigation, including:
1) Models that study the effect of ionization on satellite navigation like NCAR TIGCM and UT TDIM.
2) The Global Differential GPS system (GDGPS) which tracks GPS satellites with over 90 sites to monitor performance.
3) Challenges with satellite navigation in the Arctic including rough weather, poor maps, and limitations of GNSS like low satellite visibility and ionospheric effects.
The document provides an overview of the Global Positioning System (GPS). It describes how GPS works using a constellation of 24 satellites that orbit the Earth and transmit radio signals. GPS receivers triangulate their position by timing the signals from at least 3 satellites. The system has space, control, and user segments. It is maintained by the US Air Force and provides location services to users worldwide for applications like navigation, mapping, and tracking. Key sources of error include clock errors and atmospheric effects.
Imaging the Milky Way with Millihertz Gravitational WavesSérgio Sacani
Modern astronomers enjoy access to all-sky images across a wide range of the electromagnetic spectrum from
long-wavelength radio to high-energy gamma rays. The most prominent feature in many of these images is our
own Galaxy, with different features revealed in each wave band. Gravitational waves (GWs) have recently been
added to the astronomers’ toolkit as a nonelectromagnetic messenger. To date, all identified GW sources have been
extra-Galactic and transient. However, the Milky Way hosts a population of ultracompact binaries (UCBs), which
radiate persistent GWs in the milliHertz band that is not observable with today’s terrestrial gravitational-wave
detectors. Space-based detectors such as the Laser Interferometer Space Antenna will measure this population and
provide a census of their location, masses, and orbital properties. In this work, we will show how this data can be
used to form a false-color image of the Galaxy that represents the intensity and frequency of the gravitational
waves produced by the UCB population. Such images can be used to study the morphology of the Galaxy, identify
interesting multimessenger sources through cross-matching, and for educational and outreach purposes.
The document discusses the history and development of GPS and differential GPS (DGPS). It explains that DGPS uses a reference station at a known location to calculate errors in GPS positioning and apply corrections in real-time or post-processing to improve accuracy. The document outlines various DGPS systems, sources of GPS error, DGPS methods like rapid static and traverse, and components of GPS receivers.
This document discusses remote sensing satellites and geo-imaging. It begins by describing different types of satellite orbits - LEO, MEO, and GEO. It then discusses remote sensing satellites and their applications in areas like agriculture, forestry, urban planning and more. Challenges in geo-imaging are also covered, such as the need for more powerful cameras to achieve high resolution from GEO orbits. Current and future Indian remote sensing satellite missions are outlined, including Cartosat-2 series, GISAT-1, a proposed first geo-imaging satellite, and future advanced geo-imaging satellites. Suggestions are made to develop advanced optical systems, detectors and sensors to meet increasing demands.
A GEO satellite’s distance from earth gives it a large coverage area, almost a fourth of the earth’s surface and also have 24 hour view of a particular area.This will be very helpful to army,navy etc.,These factors make it ideal for satellite broadcast and other multipoint applications.Continuous monitoring is done and also cost effective in long term, risk-less.
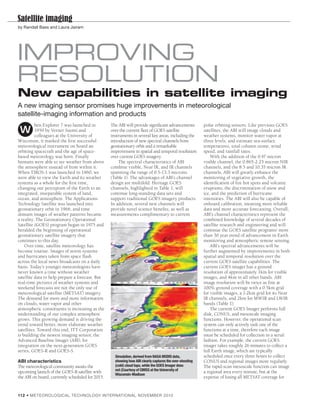
1. Satellite imaging
by Randall Bass and Laura Jairam
ImprovIng
resolutIon
New capabilities in satellite imaging
A new imaging sensor promises huge improvements in meteorological
satellite-imaging information and products
hen Explorer 7 was launched in The ABI will provide significant advancements polar orbiting sensors. Like previous GOES
W 1959 by Verner Suomi and
colleagues at the University of
over the current fleet of GOES satellite
instruments in several key areas, including the
satellites, the ABI will image clouds and
weather systems, monitor water vapor at
Wisconsin, it marked the first successful introduction of new spectral channels from three levels, and estimate sea-surface
meteorological instrument on board an geostationary orbit and a remarkable temperatures, total column ozone, wind
orbiting spacecraft and the age of space- improvement in spatial and temporal resolution speed, and rainfall rates.
based meteorology was born. Finally over current GOES imagery. With the addition of the 0.47 micron
humans were able to see weather from above The spectral characteristics of ABI visible channel, the 0.865-2.25 micron NIR
the atmosphere instead of from within it. combine visible, Near IR, and IR channels channels, and the 8.5 and 10.35 micron IR
When TIROS-1 was launched in 1960, we spanning the range of 0.5-13.3 microns channels, ABI will greatly enhance the
were able to view the Earth and its weather (Table 1). The advantages of ABI’s channel monitoring of vegetative growth, the
systems as a whole for the first time, design are multifold. Heritage GOES identification of fire hot spots and volcanic
changing our perception of the Earth to an channels, highlighted in Table 1, will eruptions, the discrimination of snow and
integrated, inseparable system of land, continue long-standing data sets and ice, and the prediction of hurricane
ocean, and atmosphere. The Applications support traditional GOES imagery products. intensities. The ABI will also be capable of
Technology Satellite was launched into In addition, several new channels will onboard calibration, meaning more reliable
geostationary orbit in 1966, and time provide novel science benefits, as well as data and more accurate forecasting. Overall,
domain images of weather patterns became measurements complimentary to current ABI’s channel characteristics represent the
a reality. The Geostationary Operational combined knowledge of several decades of
Satellite (GOES) program began in 1975 and satellite research and engineering and will
heralded the beginning of operational continue the GOES satellite programs’ more
geostationary satellite imagery that than 30 year trend of advancement in Earth
continues to this day. monitoring and atmospheric remote sensing.
Over time, satellite meteorology has ABI’s spectral advancements will be
become routine. Images of storm systems further augmented by improvements in both
and hurricanes taken from space flash spatial and temporal resolution over the
across the local news broadcasts on a daily current GOES satellite capabilities. The
basis. Today’s younger meteorologists have current GOES imager has a ground
never known a time without weather resolution of approximately 1km for visible
satellite data to help prepare a forecast. But images, and 4km in all other bands. ABI
real-time pictures of weather systems and image resolution will be twice as fine at
weekend forecasts are not the only use of 100% ground coverage with a 0.5km grid
meteorological satellite (METSAT) imagery. for visible images, a 1-2km grid for its Near
The demand for more and more information IR channels, and 2km for MWIR and LWIR
on clouds, water vapor and other bands (Table 1).
atmospheric constituents is increasing as the The current GOES Imager performs full
understanding of our complex atmosphere disk, CONUS, and mesoscale imaging
grows. This growing demand is driving the functions. However, the operational scan
trend toward better, more elaborate weather system can only actively task one of the
satellites. Toward this end, ITT Corporation functions at a time, therefore each image
is building the newest imaging sensor, the must be scheduled for collection in a serial
Advanced Baseline Imager (ABI), for fashion. For example, the current GOES
integration on the next-generation GOES imager takes roughly 26 minutes to collect a
series, GOES-R and GOES-S. full Earth image, which are typically
Simulation, derived from NASA MODIS data, scheduled once every three hours to collect
ABI characteristics showing how ABI clearly captures the over-shooting CONUS and regional images more regularly.
The meteorological community awaits the (cold) cloud tops, while the GOES Imager does The rapid-scan mesoscale function can image
not (Courtesy of CIMSS at the University of
upcoming launch of the GOES-R satellite with a regional area every minute, but at the
Wisconsin-Madison
the ABI on board, currently scheduled for 2015. expense of losing all METSAT coverage for
112 • ME TEOROLOGICAL TEChnOLOGy InTERn ATIOn A L nOVEMBER 2010
2. Satellite imaging
Hurricane
application
Hurricanes have always been of interest to provide insight to better hurricane intensity
maritime and coastal communities. Better estimation. The Hurricane Intensity
hurricane track and intensity prediction are Estimate product has been developed to
a priority for tropical meteorologists. generate hurricane central pressure data
Hurricanes such as Andrew, Mitch and and maximum sustained winds in near real
Katrina have demonstrated both the time. An intensity estimate analysis and an
potential destruction of these storms and intensity trend of the storm will be created
the difficulty in accurately predicting their using this product.
strength and path. The National Hurricane Center will utilize
Although hurricane detection products this information to make more accurate
the rest of the hemisphere. In normal mode, are well established using current GOES forecasts and advanced warnings. Data
the current GOES imager collects imagers, details about the eye of the storm from ABI not only helps forecasters warn
approximately four CONUS images per hour. are underdeveloped. Temporal and spatial the public of impending disasters, it will
In contrast, the new ABI sensor will be able enhancements in the ABI will allow give meteorologists and climatologists
to take a full Earth image in just five minutes. scientists to monitor storm-eye insight into atmospheric conditions that
Furthermore, ABI has a flexible scan mode development in a similar way to watching cause these storms. Finally, ABI data may
where one full Earth disk, three CONUS every frame of a movie in high definition help answer questions on whether climate
images, and 30 mesoscale (aka regional scale, rather than every 10th frame in standard change has an effect on the number and
approximately 1,000 x 1,000km) snapshots definition (below). This capability should intensity of hurricanes in the ocean basins.
are collected every 15 minutes. ABI’s ability to
focus on regional atmospheric phenomena
with a 30-second refresh rate, while still Simulated images of the
monitoring weather on a hemispheric scale, is 16 ABI bands for
Hurricane Katrina. These
truly an exciting advancement for images were simulated
meteorologists. This feature will greatly aid via a combination of high
efforts to comprehensively track weather spatial-resolution
systems affecting North America (see figures numerical model runs
left). It is estimated that ABI will provide 48 and advanced ‘forward’
radiative transfer models
times the amount of data available from the (Courtesy of CIMSS at
current GOES Imager. the University of
Wisconsin-Madison)
ABI products
ABI will enable more accurate nowcasting
and short-term forecasting than current
METSAT data can provide, based solely on
its finer spatial, spectral, and temporal
resolution. The enhanced resolution and
additional channels on ABI will also offer
new opportunities for remote sensing.
The list of potential applications entices
meteorologists, land-use planners and the
casual weather enthusiast. Supercell
detection, fire detection and characterization,
upper-level sulfuric acid detection, air-quality
analysis, vegetation monitoring, cloud-top
phase/particle-size data, rainfall-rate
detection, and hurricane-intensity estimation,
to name a few, are new and enhanced developed many new cloud products. ABI’s monitors convective developments, and along
products. They can be divided into three higher spatial- and temporal-resolution data with the cloud-top temperature and cloud-top
categories: weather and atmospheric allows forecasters to closely monitor the pressure products, will provide information
monitoring products, climate monitoring, development of clouds in all weather for satellite-derived wind monitoring. Cloud
and hazard detection. There are far too many situations. It will be used in conjunction with optical depth, cloud-particle size distribution,
individual products to describe here, but a radiative transfer model to generate cloud- cloud liquid water and cloud-ice water
several of significance are highlighted. type and cloud top-phase products. These products round out the cloud-application
The improved detection of clouds will products will classify the various types of suite. In addition to improving aircraft safety,
benefit the weather community, as well as clouds. The phase (ice, water or mixed) of a these products will also provide vital
climatologists and the aviation community. A cloud can impact aircraft icing conditions, and information for climate research.
GOES-R Cloud Application Team has been therefore plays a key role in aviation routing Many people around the world are
created and its members have already and planning. The cloud top-height product affected by flooding each year, particularly
ME TEOROLOGICAL TEChnOLOGy InTER n ATIOn AL nOVEMBER 2010 • 113
3. Satellite imaging
Table 1: Channel Characteristics of the Advanced Baseline Imager
ABI Channels Spectral Spatial
Band Ch. Center Width IFOV Imagery Use Heritage Instruments
Wavelength (µm) FWHM (µm) at nadir (km)
VIS 1 0.47 0.04 1 Daytime aerosol over land, vegetative MODIS*
health, coastal mapping
2 0.64 0.1 0.5 Daytime clouds, fog, insolation, winds Current GOES Imager
and Sounder
NIR 3 0.865 0.039 1 Daytime vegetation, burn scar, VIIRS**, AVHRR†
aerosol over water, winds
4 1.378 0.015 2 Daytime cirrus clouds VIIRS, MODIS
5 1.61 0.06 1 Daytime cloud-top phase and particle size, VIIRS, AVHRR
snow and cloud discrimination
6 2.25 0.05 2 Daytime land properties, cloud particle size, VIIRS, MODIS
vegetation, snow, hot-spot identification
MWIR 7 3.9 0.2 2 Surface, clouds, nighttime fog, winds, Current GOES Imager
fire/hot-spot, volcanic eruption/ash, snow/ice
detection, urban heat islands
8 6.185 0.83 2 High-level atmospheric water vapor, winds, rainfall Current GOES Imager
9 6.95 0.4 2 Mid-level atmospheric water vapor, winds, rainfall Current GOES Sounder
10 7.34 0.2 2 Lower-level water vapor, winds, upper-level Spectrally modified
sulfuric acid (SO2 ) current GOES Sounder
11 8.5 0.4 2 Total water for stability, cloud phase, dust, MODIS Airborne
SO2 aerosols Simulator (MAS)
LWIR 12 9.61 0.38 2 Total ozone, turbulence, winds Spectrally modified
current GOES Sounder
13 10.35 0.5 2 Hurricane intensity, surface moisture, cloud particle size MAS
14 11.2 0.8 2 Detection of hazardous weather conditions, Sea Surface Current GOES Sounder
Temp (SST), clouds, rainfall rates
15 12.3 1 2 Total water, ash, dust, SST, cloud particle size Current GOES Sounder
16 13.3 0.6 2 Air temp, cloud heights and amounts, Current GOES Imager
tropopause delineation and Sounder
*MODerate Resolution Imaging Spectroradiometer (MODIS)
** Visible and Infrared Imager and Radiometer Suite (VIIRS)
† Advanced Very High Resolution Radiometer (AVHRR)
in low-lying regions like the Gulf of Mexico result, improved forecasts and advanced
and the south-eastern coastlines of the USA. warning systems will allow forecasters and
Three new products have been designed for the public to take more preventative
anticipated ABI data: rainfall rate, rainfall measures when faced with weather
potential, and probability of rainfall. These phenomena. This short list of products is
precipitation-estimation products are only a small preview of the benefits that the
expected to reduce economic and human ABI suite will offer the weather community
costs associated with flooding events. and the general public. A prototype model of
Rainfall rate is designed to retrieve cloud the ABI is currently undergoing thermal-
phases and particle sizes from the new vacuum testing at ITT’s Rochester, NY
SWIR and MWIR bands on ABI. It will use a facility. This prototype model was built with
statistical model that will account for the specific design requirements of the
natural variation between, and within, actual flight model for GOES-R, which is
regions rather than assuming one regional currently in production and on track for a
base model. The improved 2km spatial Prototype model of ABI
successful integration and, most
resolution will enable better accuracy in the importantly, a successful launch in 2015. z
calculation of rainfall rates. The rainfall
potential product will extrapolate Baseline Imager on the GOES series will be Randall Bass is a senior meteorologist with ITT
information from the rainfall rate to aid in an excellent asset to meteorologists and Geospatial Systems, Herndon, Virginia and Laura
forecasting areas of heaviest rain and flood climatologists around the world. Its spectral, Jairam is a senior image scientist with ITT Geospatial
potential, with up to three hours of warning. spatial, and temporal advancements will Systems in Herndon. Cooperation came from Rachel
The rainfall probability product is a three provide more accurate measurements of Fitzhugh, an image scientist with ITT Geospatial
hour forecast, predicting the geographical cloud properties, convective development, Systems, Rochester, and Marie Knappenberger, a
areas where rain is expected. The Advance rainfall rates and hurricane intensities. As a geoscientist in Rochester, New York
114 • ME TEOROLOGICAL TEChnOLOGy InTERn ATIOn A L nOVEMBER 2010