Charla dictada por PhD(c) Javier A. Concha, del Rochester Institute of Technology Digital Imaging and Remote Sensing Lab) (Departamento de Geofísica, Universidad de Concepción, enero de 2014).
Abstract:
El recientemente lanzado satélite Landsat-8 tiene el potencial de dramáticamente mejorar nuestra habilidad para la determinación de concentración de los tres principales agentes colorantes de aguas dulce y costeras (clorofila, sedimentos y materia orgánica disuelta coloreada) mediante imágenes satelitales. El primer paso es remover el efecto de la atmósfera, para lo cual se diseña un algoritmo que utiliza dos pixeles de la imagen con reflectancias estimadas. Finalmente, las concentraciones son determinadas mediante un algoritmo de optimización que utiliza una look-up table de reflectancias generadas por el modelo físico HydroLight. En esta ocasión presentaré los primeros resultados de esta investigación.
/http://www.dgeo.udec.cl/
Long duration, lighter than air, stratospheric airships might offer a unique and compelling platform for a wide range of Earth science and astrophysics. There is also great commercial opportunity in stratospheric, stationary platforms that can remain aloft for months or even years at a time. A 2013 Keck Institute for Space Studies (KISS) series of workshops (http://kiss.caltech.edu/programs.html#airships) brought together a number of scientists and aerospace industry professionals to discuss this potential. The report from that study (http://kiss.caltech.edu/papers/airships/papers/airships.pdf) identified the need for a graduated approach to developing the necessary technology and recommended a funded challenge as one way to meet this need. The NASA Centennial Challenge office funded development of the Airships-20-20-20 Challenge, but NASA ultimately decided not to pursue the Challenge. I will describe the science enabled by airships and the proposed Challenge.
HRSC Technologies: Using MiHpt for Rapid In-Situ Contaminant and Hydrostratig...ASC-HRSC
HRSC Technologies: Using MiHpt for Rapid In-Situ Contaminant and Hydrostratigraphic Characterization
Presentation given at the Remediation Workshops in:
* San Antonio, TX - January 12, 2016
* Houston, TX - January 13, 2016
* Baton Rouge, LA - January 14, 2016
* Los Angeles (Rosemead), CA - February 16, 2016
* Honolulu, HI - February 18, 2016
* Oakland, CA - March 15, 2016
* Sacramento, CA - March 16, 2016
* Reno, NV - March 17, 2016
* Denver, CO - April 12, 2016
* Salt Lake City, UT - April 14, 2016
* Vancouver, BC - April 19, 2016
* Calgary, AB - April 20, 2016
* TriCities, WA - May 17, 2016
* Seattle, WA - May 18, 2016
HRSC Techniques: High-Resolution Hydrogeologic Characterization
Presentation given at the Remediation Workshops in:
* Oakland, CA - January 25, 2017
* Sacramento, CA- January 26, 2017
* Long Beach, CA- February 7, 2017
* Los Angeles (Rosemead), CA- February 8, 2017
C7.01: Current activities of the International Ocean Colour Coordinating Grou...Blue Planet Symposium
The International Ocean Colour Coordinating Group (IOCCG) was established in 1996 with the aim of developing consensus and synthesis on a global scale in the subject area of satellite ocean colour radiometry (OCR). It operates as an Affiliated Program of the Scientific Committee on Oceanic Research (SCOR) and comprises a rotating committee of representatives from each of the major international space agencies that provide ocean colour data, as well as representatives from the scientific community that use ocean colour data for research and applications. Space agencies contribute financially to the IOCCG and carry out the decisions endorsed by the group, while the scientific members address current research issues and make recommendations. Currently, IOCCG works towards ensuring Continuity and Consistency of the Ocean Colour Data Stream in the framework of the CEOS Ocean Colour virtual constellation. Within the OCR-VC framework, the International Network for Sensor Inter-comparison and Uncertainty Assessment for Ocean Color Radiometry (INSITU-OCR) initiative aims at integrating and rationalizing inter-agency efforts on satellite sensor inter-comparisons and uncertainty assessment for remote sensing products, with particular emphasis on requirements addressing the generation of ocean colour Essential Climate Variables (ECV) as proposed by the Global Climate Observing System (GCOS). Since 2013, IOCCG organises a bi-annual International Ocean Colour Science Meeting, where the global OCR community can gather and exchange with peers and space agency representatives. In parallel to these new initiatives, the IOCCG has a continuing capacity building and training activity, and continues to increase its record of monographs, based on the work of its working groups (currently 5 WG are active).
Describe and explain satellite remote sensing mission for monitoring.pdfalshaikhkhanzariarts
Describe and explain satellite remote sensing mission for monitoring water, carbon and global
climate change.
Solution
In recent years, the subjects of water, carbon, and global climate change
have attracted worldwide attention by scientists and the media. Climate
change, whether associated with human- induced or natural
variations, has and will continue to be important to policy makers and the
public. It is clear from reports such as that by the Intergovernmental Panelon Climate Change
(IPCC) [1] that
Earth observations play a critical role in providing information for assessment
and modeling. Improving these observations, better quality and newvariables, is a goal of most
national
and intergovernmental space agencies. Major initiatives are under waythat will result in benefits
to a broad
range of our global society. In the United States, a decadal study [2] was recently completed by
the
Committee on Earth Science and Applications of the US National Research
Council. The committee called for a commitment from the U.S. administration
to Earth observations to secure benefits for mankind. The report gives both
direction and a large boost to U.S. satellite programs as it recommended NOAA
to restore key observational capabilities of satellite missions and also that NASA
and NOAA launch 17 new satellite missions in the next 10 years. The study also
adds an additional focus to these missions: societal benefits.
Other countries have also been expanding their Earth observation programs
with numerous advanced concept satellite missions. Of particular relevance to
this issue are articles describing the
Earth observing programs of the
European Space Agency (ESA),
the Japanese Aerospace Exploration
Agency (JAXA), the China National
Space Administration (CNSA), the
Canadian Space Agency (CSA), and
the National Space Program Office
(NSPO) of Taiwan.
The ESA has a long history of
Earth observation from space that
began with meteorological missions
and has included a series of increasingly
sophisticated radars that have
provided valuable data about climate
and the changing environment. The
ESA’s current and future Earth observing
is under its Living Planet
Programme and includes the Earth
Explorer, meteorological, and Sentinel
missions.
JAXA has supported a wide range
of satellite-based instruments and
platforms that have and will provide
global Earth observations for water,
carbon, and climate. Of particular
note for the future is the commitment
to the Global Change Observation
Mission (GCOM) that will launch a
series of two types of satellites (water
and climate) to provide consistent and
continuous observations of key variables
over a 15-year period.
In addition to the United States,
ESA, and JAXA programs, there are
strong satellite-based Earth observing
programs in Canada, China, Argentina,
Taiwan, and Brazil.
In this Special Issue some of the
most significant recent and future Earth
observing satellites planned to monitor
water, carbon and global clima.
C4.06: Towards continental-scale operational ocean and coastal monitoring usi...Blue Planet Symposium
Regionally tuned algorithms that deliver remotely sensed marine water quality products from the MODIS/Aqua sensor have been developed and validated for the Great Barrier Reef (GBR). Through the eReefs partnership, these algorithms are being transferred from the research domain and being deployed operationally via the national meteorological agency. Furthermore they are being adapted to work with two other ocean colour satellite instruments, SeaWiFS and VIIRS/NPP to enable extension of the monitoring time series, both historically and into the future. The production infrastructure to manage contemporary data flows from the VIIRS sensor is similarly being extended. In parallel, the validated remote sensing products are being integrated into a hydrodynamic and bio-geochemical regional ocean model through data assimilation to provide a holistic suite of monitoring products for the GBR.
This work is being undertaken with the goal of expanding the monitoring to more of Australia's marine jurisdiction. While the remote sensing algorithms themselves are parameterised for the atmospheric and optical characteristics of the GBR region, they are inherently flexible and are progressively being applied and tested in other locations where suitable in situ data are available. The data processing system for the GBR already is nested within the national data production operated by the Integrated Marine Observing System.
Utilizando la información espectral y visión panorámica mediante la interpretación de imágenes satelitales se puede conocer la superficie, forma y distribución de la cobertura de agua y vomo la arcatan las alteraciones en las componentes vegetal y uso de la tierra de grandes áreas. En el trabajo específico con vegetación son empleadas para describir grandes tipos de comunidades (incluso determinar presencia de especies invasoras), estimar su estado hídrico, fenología, niveles de degradación y tasas de productividad. Basado en imágenes de satélites, en el año 2002 se presentó en Argentina el Primer Inventario de Bosques Nativos, que tuvo como objetivo obtener mapas temáticos de cobertura de uso de la tierra, del estado de los bosques (niveles de aprovechamiento y degradación), indicadores de factores ambientales responsables de la alteración de los recursos hidricos
Similar to 20110728_IGARSS_GDPS(ryu)fin1.pptx (20)
Search and Society: Reimagining Information Access for Radical FuturesBhaskar Mitra
The field of Information retrieval (IR) is currently undergoing a transformative shift, at least partly due to the emerging applications of generative AI to information access. In this talk, we will deliberate on the sociotechnical implications of generative AI for information access. We will argue that there is both a critical necessity and an exciting opportunity for the IR community to re-center our research agendas on societal needs while dismantling the artificial separation between the work on fairness, accountability, transparency, and ethics in IR and the rest of IR research. Instead of adopting a reactionary strategy of trying to mitigate potential social harms from emerging technologies, the community should aim to proactively set the research agenda for the kinds of systems we should build inspired by diverse explicitly stated sociotechnical imaginaries. The sociotechnical imaginaries that underpin the design and development of information access technologies needs to be explicitly articulated, and we need to develop theories of change in context of these diverse perspectives. Our guiding future imaginaries must be informed by other academic fields, such as democratic theory and critical theory, and should be co-developed with social science scholars, legal scholars, civil rights and social justice activists, and artists, among others.
State of ICS and IoT Cyber Threat Landscape Report 2024 previewPrayukth K V
The IoT and OT threat landscape report has been prepared by the Threat Research Team at Sectrio using data from Sectrio, cyber threat intelligence farming facilities spread across over 85 cities around the world. In addition, Sectrio also runs AI-based advanced threat and payload engagement facilities that serve as sinks to attract and engage sophisticated threat actors, and newer malware including new variants and latent threats that are at an earlier stage of development.
The latest edition of the OT/ICS and IoT security Threat Landscape Report 2024 also covers:
State of global ICS asset and network exposure
Sectoral targets and attacks as well as the cost of ransom
Global APT activity, AI usage, actor and tactic profiles, and implications
Rise in volumes of AI-powered cyberattacks
Major cyber events in 2024
Malware and malicious payload trends
Cyberattack types and targets
Vulnerability exploit attempts on CVEs
Attacks on counties – USA
Expansion of bot farms – how, where, and why
In-depth analysis of the cyber threat landscape across North America, South America, Europe, APAC, and the Middle East
Why are attacks on smart factories rising?
Cyber risk predictions
Axis of attacks – Europe
Systemic attacks in the Middle East
Download the full report from here:
https://sectrio.com/resources/ot-threat-landscape-reports/sectrio-releases-ot-ics-and-iot-security-threat-landscape-report-2024/
GDG Cloud Southlake #33: Boule & Rebala: Effective AppSec in SDLC using Deplo...James Anderson
Effective Application Security in Software Delivery lifecycle using Deployment Firewall and DBOM
The modern software delivery process (or the CI/CD process) includes many tools, distributed teams, open-source code, and cloud platforms. Constant focus on speed to release software to market, along with the traditional slow and manual security checks has caused gaps in continuous security as an important piece in the software supply chain. Today organizations feel more susceptible to external and internal cyber threats due to the vast attack surface in their applications supply chain and the lack of end-to-end governance and risk management.
The software team must secure its software delivery process to avoid vulnerability and security breaches. This needs to be achieved with existing tool chains and without extensive rework of the delivery processes. This talk will present strategies and techniques for providing visibility into the true risk of the existing vulnerabilities, preventing the introduction of security issues in the software, resolving vulnerabilities in production environments quickly, and capturing the deployment bill of materials (DBOM).
Speakers:
Bob Boule
Robert Boule is a technology enthusiast with PASSION for technology and making things work along with a knack for helping others understand how things work. He comes with around 20 years of solution engineering experience in application security, software continuous delivery, and SaaS platforms. He is known for his dynamic presentations in CI/CD and application security integrated in software delivery lifecycle.
Gopinath Rebala
Gopinath Rebala is the CTO of OpsMx, where he has overall responsibility for the machine learning and data processing architectures for Secure Software Delivery. Gopi also has a strong connection with our customers, leading design and architecture for strategic implementations. Gopi is a frequent speaker and well-known leader in continuous delivery and integrating security into software delivery.
Slack (or Teams) Automation for Bonterra Impact Management (fka Social Soluti...Jeffrey Haguewood
Sidekick Solutions uses Bonterra Impact Management (fka Social Solutions Apricot) and automation solutions to integrate data for business workflows.
We believe integration and automation are essential to user experience and the promise of efficient work through technology. Automation is the critical ingredient to realizing that full vision. We develop integration products and services for Bonterra Case Management software to support the deployment of automations for a variety of use cases.
This video focuses on the notifications, alerts, and approval requests using Slack for Bonterra Impact Management. The solutions covered in this webinar can also be deployed for Microsoft Teams.
Interested in deploying notification automations for Bonterra Impact Management? Contact us at sales@sidekicksolutionsllc.com to discuss next steps.
JMeter webinar - integration with InfluxDB and GrafanaRTTS
Watch this recorded webinar about real-time monitoring of application performance. See how to integrate Apache JMeter, the open-source leader in performance testing, with InfluxDB, the open-source time-series database, and Grafana, the open-source analytics and visualization application.
In this webinar, we will review the benefits of leveraging InfluxDB and Grafana when executing load tests and demonstrate how these tools are used to visualize performance metrics.
Length: 30 minutes
Session Overview
-------------------------------------------
During this webinar, we will cover the following topics while demonstrating the integrations of JMeter, InfluxDB and Grafana:
- What out-of-the-box solutions are available for real-time monitoring JMeter tests?
- What are the benefits of integrating InfluxDB and Grafana into the load testing stack?
- Which features are provided by Grafana?
- Demonstration of InfluxDB and Grafana using a practice web application
To view the webinar recording, go to:
https://www.rttsweb.com/jmeter-integration-webinar
DevOps and Testing slides at DASA ConnectKari Kakkonen
My and Rik Marselis slides at 30.5.2024 DASA Connect conference. We discuss about what is testing, then what is agile testing and finally what is Testing in DevOps. Finally we had lovely workshop with the participants trying to find out different ways to think about quality and testing in different parts of the DevOps infinity loop.
Let's dive deeper into the world of ODC! Ricardo Alves (OutSystems) will join us to tell all about the new Data Fabric. After that, Sezen de Bruijn (OutSystems) will get into the details on how to best design a sturdy architecture within ODC.
"Impact of front-end architecture on development cost", Viktor TurskyiFwdays
I have heard many times that architecture is not important for the front-end. Also, many times I have seen how developers implement features on the front-end just following the standard rules for a framework and think that this is enough to successfully launch the project, and then the project fails. How to prevent this and what approach to choose? I have launched dozens of complex projects and during the talk we will analyze which approaches have worked for me and which have not.
Software Delivery At the Speed of AI: Inflectra Invests In AI-Powered QualityInflectra
In this insightful webinar, Inflectra explores how artificial intelligence (AI) is transforming software development and testing. Discover how AI-powered tools are revolutionizing every stage of the software development lifecycle (SDLC), from design and prototyping to testing, deployment, and monitoring.
Learn about:
• The Future of Testing: How AI is shifting testing towards verification, analysis, and higher-level skills, while reducing repetitive tasks.
• Test Automation: How AI-powered test case generation, optimization, and self-healing tests are making testing more efficient and effective.
• Visual Testing: Explore the emerging capabilities of AI in visual testing and how it's set to revolutionize UI verification.
• Inflectra's AI Solutions: See demonstrations of Inflectra's cutting-edge AI tools like the ChatGPT plugin and Azure Open AI platform, designed to streamline your testing process.
Whether you're a developer, tester, or QA professional, this webinar will give you valuable insights into how AI is shaping the future of software delivery.
LF Energy Webinar: Electrical Grid Modelling and Simulation Through PowSyBl -...DanBrown980551
Do you want to learn how to model and simulate an electrical network from scratch in under an hour?
Then welcome to this PowSyBl workshop, hosted by Rte, the French Transmission System Operator (TSO)!
During the webinar, you will discover the PowSyBl ecosystem as well as handle and study an electrical network through an interactive Python notebook.
PowSyBl is an open source project hosted by LF Energy, which offers a comprehensive set of features for electrical grid modelling and simulation. Among other advanced features, PowSyBl provides:
- A fully editable and extendable library for grid component modelling;
- Visualization tools to display your network;
- Grid simulation tools, such as power flows, security analyses (with or without remedial actions) and sensitivity analyses;
The framework is mostly written in Java, with a Python binding so that Python developers can access PowSyBl functionalities as well.
What you will learn during the webinar:
- For beginners: discover PowSyBl's functionalities through a quick general presentation and the notebook, without needing any expert coding skills;
- For advanced developers: master the skills to efficiently apply PowSyBl functionalities to your real-world scenarios.
Transcript: Selling digital books in 2024: Insights from industry leaders - T...BookNet Canada
The publishing industry has been selling digital audiobooks and ebooks for over a decade and has found its groove. What’s changed? What has stayed the same? Where do we go from here? Join a group of leading sales peers from across the industry for a conversation about the lessons learned since the popularization of digital books, best practices, digital book supply chain management, and more.
Link to video recording: https://bnctechforum.ca/sessions/selling-digital-books-in-2024-insights-from-industry-leaders/
Presented by BookNet Canada on May 28, 2024, with support from the Department of Canadian Heritage.
Accelerate your Kubernetes clusters with Varnish CachingThijs Feryn
A presentation about the usage and availability of Varnish on Kubernetes. This talk explores the capabilities of Varnish caching and shows how to use the Varnish Helm chart to deploy it to Kubernetes.
This presentation was delivered at K8SUG Singapore. See https://feryn.eu/presentations/accelerate-your-kubernetes-clusters-with-varnish-caching-k8sug-singapore-28-2024 for more details.
Accelerate your Kubernetes clusters with Varnish Caching
20110728_IGARSS_GDPS(ryu)fin1.pptx
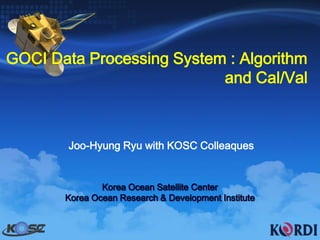
1. GOCI Data Processing System : Algorithm and Cal/Val Joo-HyungRyuwith KOSC Colleaques Korea Ocean Satellite Center Korea Ocean Research & Development Institute
2. Maximize the GOCI application Research/Application Next GOCI GDPS SW +Cal/Val GOCI data
11. Ocean Color SW SeaDAS : SeaWiFS, MODIS BEAM : MERIS GDPS : GOCI A standard operational system of KOSC Basic data processing system for GOCI user Well-designed data processing structure World’s first Geostationary Ocean Color Data Processing SW
14. It shall be operated in a staring-frame capture mode onboard its COMS.
15. The mission concept includes eight visible-to-near-infrared bands, 500 m spatial resolution, and a coverage region of 2,500*2,500 km centered at Korea.
16. The instrument is expected to provide SeaWiFS quality observations for a single study area with imager frequency of 1 hour from 9 am to 4 pm (8 times a day).
17. GOCI Application : LEO mission + Operational mission harmful algae bloom (HAB), health of marine ecosystem, movement of suspended sediment and current, and to produce marine fisheries information for fishing communities+ ocean forecasting (with modeling)
18. GEOvs. LEO GEO is about 50 times farther from the Earth than LEO GEO spatial resolution is 4 times better than that of LEO GEO temporal resolution is 8 times better To be considered and prepared sensor type, geometry & local coverage for overcoming GEO characteristics
19.
20. The coastal area of Korea & China and the ECS(seasonalvariation) is a typical Case-2 waters
21. East/Japan Sea, central YS & Pacific come under the Case-1 waterDefinition of Case-1 and 2 waters using in situ <chl> and <SS> data of the Korean Sea
22.
23. IOP and AOPIn situ measurement were performed during a lot of cruises in the Korean terrestorial seas and neighboring waters through the years 1998-2010 onboard the KORDI research vessel and fisher boats.
27. Water sample: about 40(every 20 min after departure) <SS>, <chl>, adomJeju For understanding the ocean environmental parameter of the YS, we conducted the ferrybox project during 4 years.
28. Concentration of SS, <chl>, aDOM in the YS SS : 0-186 g/m3 <chl> : 0 – 16 mg/m3 adom : 0-0.9 m-1
30. GOCI Data Processing System flow Accessory Data file Sub-routine Low level Data file Analyzed data file Option KOSC IMPS LEVEL-0 Sector Image Radiometric Calibration Calibration Coefficients LEVEL-1A Digital values Land Mask Geometrical Correction & Mosaic Image Display ASCII-Data Generation Cloud Mask LEVEL-1B Total Radiance Turbid water Mask Atmospheric Correction New & old model GDPS WaterleavingRadiance Bi- Directional Correction Lookup Table ReferenceTarget SPData LwN (B1-B8) CASE-I&II & Fluor. Algorithm 1-Band Algorithm Absorption Coefficient Fishing Ground Index Empirical Algorithm Image pattern Comparison 3-Bands Algorithm Red-tide Index K & Inherent Optical algorithm Red-Tide Fishing Ground Information CDOM TSS Under water Visibility Water Current Vector Atm. & Earth Environment Chlorophyll Optical Properties Water New model Yellow Dust Forest Fire Inland flood Vegetation Index Heavy snowfall K-coefficient Absorption coeff. Backscattering Coeff NOAA Image Water Quality Level 1-5 Primary Productivity
33. (operational) GDPS Requirement Algorithm Programming Developed atmosphere/bio-optical algorithms are integrated in the software and working in real time. Timeliness less than 30 minutes from L1B to L2 generation Automation All data processing function can work automatically Pre-configured operating support OS PC Windows Output Format HDF-EOS 5 format Development Tool Microsoft Visual C++ <GDPS System> GDPS - R1A Duplicationl GDPS - R1B GDPS – R2 GDPS - UI Processing Server SPEC:3.0GHz4core 2cpu, 4GB ram
34. Product (Level) Level 1B Radiometric & geometric corrected Total Radiance Level 2 Environmental properties derived from Ocean signal(Lw) For GOCI, L2 data will be generated each hour.(8 times/day) Level 3 Secondary derived data from L2 like Fishery Ground information, Primary Production. Cloud-free(reduced) ocean environmental data by daily composite of L2
52. Lessons from MERIS and MODIS Cal/Val From temporal discontinuity measurement (by ship) To continuous measurement (by buoy and tower) : Aeronet-OC Tower measurement: 200pts/6.5years Ship measurement : 10pts/2.5years
53. Guideline of KOSC Cal/Val To operate optic lab for radiometer(instrument) validation : under construction To establish a serise of Cal/Val system To apply previous KORDI fixed system including buoy, tower, ferry To cooperate international Cal/Val group and neighboring country
54. Yellow Sea Buoy (2007) Korea Operational Oceanography Network Dokdo Buoy (2009) Gageocho Station (2009) East(Japan) Sea Station (2012) Ieodo Station (2003) Two buoys and two ocean stations have already been constructed by KOON project
72. etc.Ieodo station is managed by NORI (Government offfice) KORDI : design, construction, installation, test NORI : operational work
73. Satlantic HyperSAS OCR-3000 Comparison between HyperSAS and SeaWiFS water-leaving radiance in each band All visible bands were well correlated with SeaWiFS excepted at longer wavelengths Lsky(λ) LwT(λ) Ed(λ)
74.
75. EU JRChas the scientific responsibility of the processing algorithms and performs the quality assurance of data products.
81. In-Situ TriOS Rrs(λ) : Gageocho Platform 10:35 11:35, cloudy Aug. 20 2010 - TriOS Rrs(λ) - GOCI Rrs(λ) - TriOS Rrs(λ) - GOCI Rrs(λ) 12:35 13:35 14:35 - TriOS Rrs(λ) - GOCI Rrs(λ) - TriOS Rrs(λ) - GOCI Rrs(λ) - TriOS Rrs(λ) - GOCI Rrs(λ) - MODIS Rrs(λ) 1. Cross Comparisons with time-series : in-situ TriOS, GOCI, MODIS Rrs(λ) 2. Rrs of shorter wavebands is still problem in early morning and late afternoon - Optical Path is different with time - During In-Orbit Test (IOT), this problem is our homework
82. Comparison between In-Situ TriOS Rrs(λ) and GOCI Rrs(λ) : Gageocho Platform Rrs(412) Rrs(443) Rrs(490) Rrs(555) Rrs(660) Rrs(680) Rrs(745) Rrs(865)
83. Statistics GOCI and in-situ matching data(Gageocho station) Xi : ith satellite-derived value Yi : ith in-situ-derived value N : number of points RMSE : root mean square error AR : average ratio of satellite to in-situ data RPD : average relative percent difference (%) APD : average absolute percent difference (%)
84. Statistics of GOCI and in-situ matching data(Gageocho station) Rrs(l) Rrs(l) All bandsRMSE=0.436 All bandsRMSE=0.436
86. <chl> comparison of each algorithm GOCI OC4v4 OC2v2 - Local algorithms are well matched with in situ measurements - <chl> of local algorithm decreases about 50 % than that of NASA standard alg.
87. Inter-satellite Cal : GOCI vs. HICO (by D. Curtiss) HICO Data Google Earth HICO ImagePusan, South Korea: Nov.18, 2009 North
88. Inter-satellite Cal : GOCI vs. MERIS GOCI(2010 09 24 01: 16:43) (R(680), G(555), B(412)) MERIS(2010 09 24 01: 43:51) (R(681.55), G(560), B(412.5)) *GOCI image is geo-corrected by MERIS Geometric information
106. Applied algorithm BRDF correction : GOCI algorithm & relative algorithm Atmospheric correction : coastal standard correction & SSMM Empirical SS algorithm developed based upon the in-situ data sets obtained on the Yellow Sea 2005 – 2010
107. Hourly SS variations 10:16 11:16 12:16 Flood tide High tide Flood tide 0 10 SS (g/m3) 13:16 14:16 Ebb tide Ebb tide There is no notable difference over the study area from 10:30 to 12:30. However, white box area is gradually decreased time after time until high tide and then suddenly decreased.
108. SSC profiles N W E S SSC profile showed a lot of fluctuations in the image at 10:30 near the coastal area, which came to be stable as time passed along both the lines.
109. 2008 Green algae : EnteromorphaProliphera Total removal quantity in Qingdao : about 1 million ton Sea During 2008 Beijing Olympic Game, sailing stadium of Qingdao was attacked by green algae.
110. 2008 Green algae monitoring Background image : May 20, 2008 MODIS aqua band1 image
111. Korea Qingdao 6월 13일 Yellow Sea 군산 흑산도 목포 China 제주도 East China Sea 양쯔강 하구 GOCI June 13, 2011(13:15)
112. Korea Qingdao Yellow Sea 7월 18일 한국 남서해상 및 동중국해녹조 탐지 (천리안 해양관측위성 분석영상, 14시16분 촬영 ) 군산 흑산도 목포 China 제주도 East China Sea 양쯔강 하구 GOCI July 18, 2011(14:15)
113. 한국 Korea Qingdao Yellow Sea 군산 7월 19일 한국 남서해상 및 동중국해녹조 탐지 (천리안 해양관측위성 분석영상, 16시16분 촬영 ) 흑산도 목포 China 제주도 East China Sea 양쯔강 하구 GOCI July 19, 2011(16:15)
115. A 7월 10일 흑산도 인근 해역, 한국해양연구원 온누리호 촬영 (b) 7월 16일 동중국해(31N, 125E) 한국해양연구원과 일본 나가사키 대학 합동 조사에서 촬영 A (c) 7월 21일 흑산도 인근 해역(34N°31.9, 125E°27.8) 전남대학교 김광용 교수 연구팀 서해어업관리단 무궁화 2호에서 촬영 B B
116. BohaiBay Oil Spill(by Chosunilbo) The sea area polluted in an oil spill in China's Bohai Bay was five times as large as Beijing previously announced. A probe conducted by the Chinese State Oceanic Administration found that some 4,240 sq.km of water, or seven times the size of Seoul, were polluted by oil leaks from the Peng Lai 19-3 oilfield in Bohai Bay, the daily Xin Jing Bao reported Wednesday.Beijing admitted the oil spill for the first time on July 5, a month after two oil leaks occurred at China's largest marine oilfield on June 4 and 17, saying only 840 sq.km were polluted. But the water quality of a 3,400 sq.km area nearby dropped from Grade 1 to Grade 3.China National Offshore Oil Corp. and ConocoPhillips, the joint operators of the oilfield, said the oil spill was quickly contained and cleaned up, but earlier this week Beijing admitted that oil continues to leak out.The Chinese government on Wednesday ordered the operators to suspend production until there is no more danger of further spills. Concern is increasing about the safety of seafood from the West Sea. The city of Yantai in Shandong Province near the ill-fated oilfield has set up an observation post on the coast to check for pollution.
117. Oil Spill (GOCI June 13, 2011) Spilled point Bohai 다롄 Spilled point 펑라이
119. GOCI discussion Enhanced temporal resolution, high performance of MTF and SNR of GOCI show better effectiveness than we expected. GOCI has an excellent capability to monitor ocean environment and disaster.
120.
121. Comparison of GOCI-I andGOCI-II Special Resolution(m) Obser-vation Frequen-cy Channels (Bands) Bits [Local and Global Area] [Comparison of Resolution among Ocean Sensors]