The document discusses functions and relations. It defines functions, relations, and domain and range. It provides examples of expressing relations in set notation, tabular form, equations, graphs, and mappings. It also discusses evaluating, adding, multiplying, dividing, and composing functions. Graphs of various functions like absolute value, piecewise, greatest integer, and least integer functions are also explained.


![20
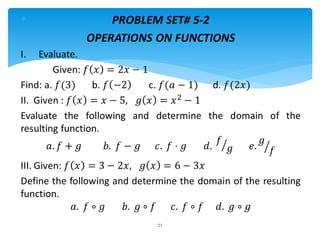
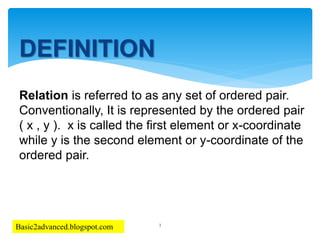
DEFINITION: Operations on
Functions
If f (x) and g (x) are two functions, then
a) Sum and Difference
( f + g ) ( x ) = f(x) + g(x)
b) Product
( f g ) ( x ) = [ f(x) ] [ g(x) ]
c) Quotient
( f / g ) ( x ) = f(x) / g(x)
d) Composite
( f ◦ g ) ( x ) = f (g(x))](https://image.slidesharecdn.com/functions-140706044021-phpapp02/85/Functions-20-320.jpg)