This document outlines an experiment to investigate the relationship between the rate of cooling of water and the volume of water. The independent variable is the volume of water and the dependent variable is the rate of cooling. Control variables include the initial temperature of the water, shape of the beaker, room temperature, time of temperature measurements, and airflow. Students will take temperature readings of water samples of different volumes over time, record the data, calculate the rate of cooling, plot a graph, and analyze the relationship between the variables. They will be assessed on data collection and processing skills as well as their ability to draw conclusions and evaluate the experiment.
Statistical Evaluation of Spatial Interpolation Methods for Small-Sampled Reg...Beniamino Murgante
Statistical Evaluation of Spatial Interpolation Methods for Small-Sampled Region. A Case Study of Temperature Change Phenomenon in Bangladesh
Avit Bhowmik, Pedro Cabral - Institute of Statistics and Information Management, New University of Lisbon
Measurement errors, Statistical Analysis, UncertaintyDr Naim R Kidwai
The Presentation covers Measurement Errors and types, Gross error, systematic error, absolute error and relative error, accuracy, precision, resolution and significant figures, Measurement error combination, basics of statistical analysis, uncertainty, Gaussian Curve, Meaning of Ranges
Basic Understanding of measurement errors, its definitions, types and few examples are discussed with pictures, block diagrams etc. Totally suitable for the learners of engineering and science fields.
In this issue of Math in the News we explore logarithmic functions to model the thawing of frozen turkeys. We look at USDA guidelines to determine data points and use a graphing calculator to create mathematical models.
Learning Objective: Use the Arrhenius equation and linear regression analysis to calculate the frequency factor and activation energy from temperatures and reaction rate constants. This exercise will develope your habits and skills to analyse temperature and rate data using linear regression.
‐ Total Assessment Weighting ‐ 25 Introduction T.docxodiliagilby
‐ Total Assessment Weighting ‐ 25%
Introduction:
The optimisation of processing times is an important skill for all engineers and is often undertaken
via a modelling approach. The processing of composites can be a long process and a bottleneck in a
production line. The temperature profile during the composite cure can be adjusted to reduce
processing time and increase part output during production.
The quality control of composites is also time consuming and costly. Most non-destructive testing is
inconclusive, so thermal and mechanical testing is conducted to ensure quality is consistent.
Choosing the most cost and time effective method is critical to meet high standards in an efficient
way.
This assessment task is based on experimental work performed during Practical 1. You will be
creating a ‘technical research paper’ based on your composite experiments performed during week
2 and 3.
Assessment task:
In Practical 1 you performed a set of experiments related to optimizing the manufacture of
composites. Using the template provided, you will create a technical research paper based around
these three experiments. Please read the template carefully in terms of how to write and structure
your technical paper. Your paper will discuss the following elements.
1) Calculation of Kinetic and Rheology Constants: Using information in the literature and unit
content, use data generated from a Differential Scanning Calorimetry (DSC) and/or
Rheometer to find the constants to be used for the modelling of viscosity curves. A proposal
of potential alternative solutions to create a model for resin viscosity is to also be presented.
2) Optimisation of flow through a fibre stack: based on your observations from the practical
and from the experimental data collected, you will use the rheology model created to
optimise the temperature profile for increased flow of resin through a fibre stack, and
predict the time it will take to reach the tool surface and wet out the fibre tack surface.
3) Quality Control Testing: Recommend and justify a test procedure to measure the following
key properties of a manufactured component:
• Glass Transition Temperature
• Tensile modulus
• Internal porosity
• Bond between carbon fibre plies
• Degree of cure/conversion percentage
• Fatigue
• Fatigue at temperature
Discuss whether the recommended procedure is standardised, the data that needs to be
collected and calculations that need to be made.
Writing the Report:
You are welcome to use the recommended title template below as a guide to structuring your paper.
Recommended Assignment Template
Abstract
1.0 Introduction
2.0 Experimental Description
3.0 Cure Kinetics and Rheology Calculations
4.0 Process Optimisation
5.0 Quality Control Testing
6.0 Conclusion
7.0 References
Your paper should be minimum of 2000 words (excluding references). It should not exceed 2500
words. Note: YO ...
Secondary school physics examination techniques that are self explanatory. They are meant to assist a candidate for any high school physics know how to present answer in examinations.
Advanced DOE with Minitab (presentation in Costa Rica)Blackberry&Cross
DOE:Diseño de Experimentos
Esta presentación fue dada por Minitab Inc., en Costa Rica, en el año 2007, como parte del trabajo de Blackberry&Cross, socio de Minitab Inc., para América Central, en la promoción y difusión de temas STEM, y de la comercialización de Minitab Statisitical Software.
Fun4.7a practical rate of cooling and volume dcp ce
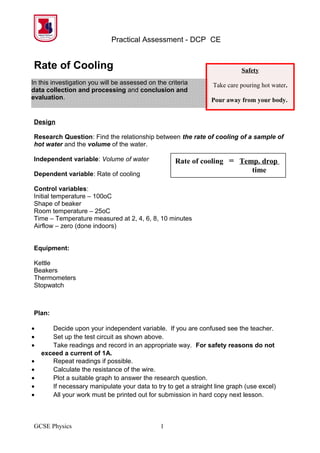
1. Practical Assessment - DCP CE
Rate of Cooling
Design
Research Question: Find the relationship between the rate of cooling of a sample of
hot water and the volume of the water.
Independent variable: Volume of water
Dependent variable: Rate of cooling
Control variables:
Initial temperature – 100oC
Shape of beaker
Room temperature – 25oC
Time – Temperature measured at 2, 4, 6, 8, 10 minutes
Airflow – zero (done indoors)
Equipment:
Kettle
Beakers
Thermometers
Stopwatch
Plan:
• Decide upon your independent variable. If you are confused see the teacher.
• Set up the test circuit as shown above.
• Take readings and record in an appropriate way. For safety reasons do not
exceed a current of 1A.
• Repeat readings if possible.
• Calculate the resistance of the wire.
• Plot a suitable graph to answer the research question.
• If necessary manipulate your data to try to get a straight line graph (use excel)
• All your work must be printed out for submission in hard copy next lesson.
GCSE Physics 1
In this investigation you will be assessed on the criteria
data collection and processing and conclusion and
evaluation.
Rate of cooling = Temp. drop
time
Safety
Take care pouring hot water.
Pour away from your body.
2. Practical Assessment - DCP CE
Assessment Criteria
Data Collection and Processing
Aspect 1: data collection
Design a neat data table to record your raw data.
Remember to include descriptive headings.
Remember to include units.
Extension - Try to consider UNCERTAINTIES for raw data.
Aspect 2: processing raw data
Process your raw data to plot a suitable graph to answer the research question.
Remember to include headings and units.
Extension – manipulate data to get straight line for your graph.
Aspect 3: presenting processed data
Plot a neat graph with correct scales and labeled axes.
Extension - Include error bars on your graph.
Conclusion and Evaluation
Aspect 1: concluding.
State the relationship between the dependant and independent variable.
What evidence do you have that suggests the relationship you have chosen?
Remember is there a straight line? Is there a proportionality or direct proportionality?
Aspect 2: evaluating procedure
Use a few lines to discuss the quality of your results.
Discuss the weaknesses in your experiment.
How big a problem was each weakness?
Aspect 3: improving the investigation
Discuss how you would improve the experiment.
State exactly how each improvement will be implemented.
GCSE Physics 2