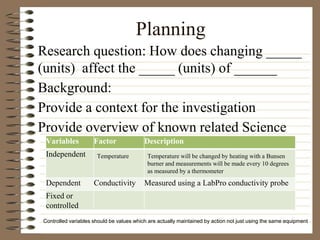
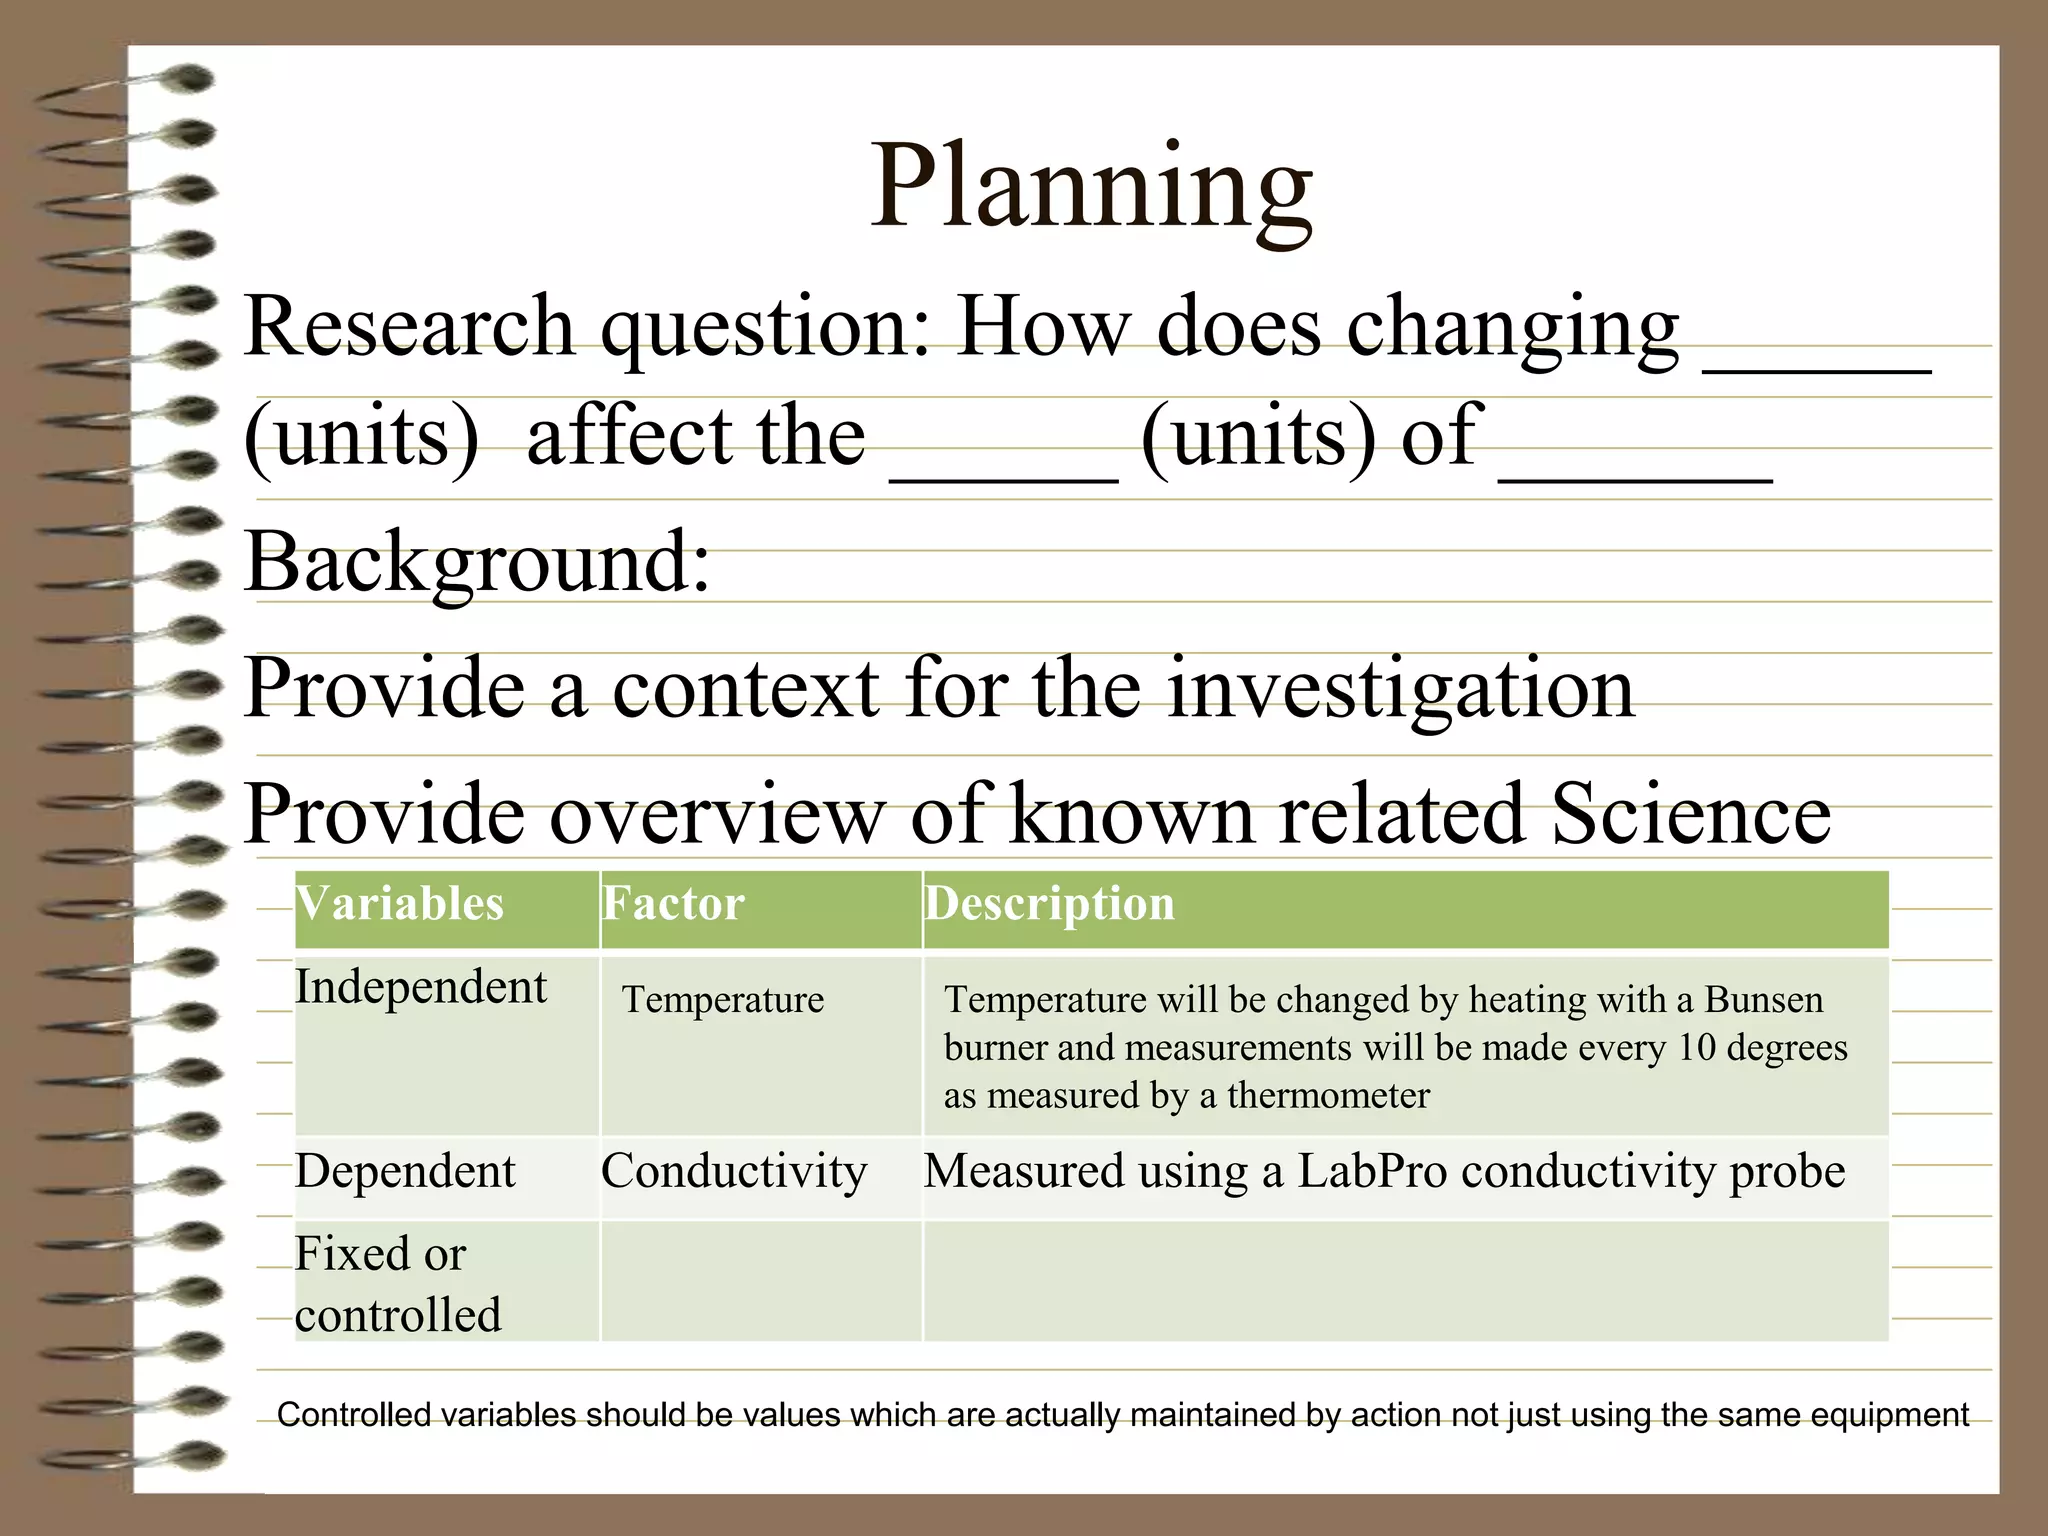
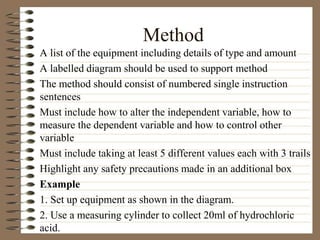
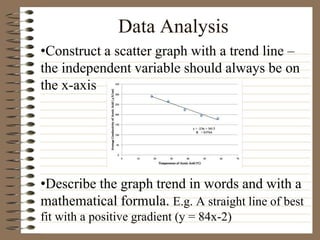
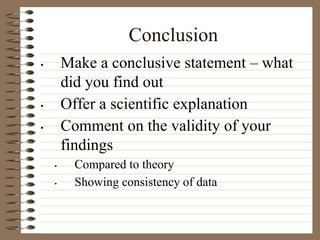
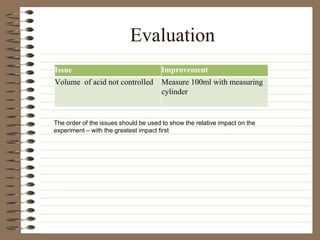
Planning
Research question: How does changing _____
(units) affect the _____ (units) of ______
Background:
Provide a context for the investigation
Provide overview of known related Science
Variables Factor Description
Independent Temperature Temperature will be changed by heating with a Bunsen
burner and measurements will be made every 10 degrees
as measured by a thermometer
Dependent Conductivity Measured using a LabPro conductivity probe
Fixed or
controlled
Controlled variables should be values which are actually maintained by action not just using the same equipment
Method
A list of the equipment including details of type and amount
A labelled diagram should be used to support method
The method should consist of numbered single instruction
sentences
Must include how to alter the independent variable, how to
measure the dependent variable and how to control other
variable
Must include taking at least 5 different values each with 3 trails
Highlight any safety precautions made in an additional box
Example
1. Set up equipment as shown in the diagram.
2. Use a measuring cylinder to collect 20ml of hydrochloric
acid.
Data Collection
Independent
Variable ±
uncertainty
(units)
Dependent Variable (units)
Trial 1 Trial 2 Trial 3 Average
Volume of
acid (ml)
Conductivity (μS/cm)
Trial 1 Trial 2 Trial 3 Average
10
20
30
40
50
General example
Example
Qualitative notes including any anomalies should be recorded after the results table
Remember you target is 5 sets of data each repeated 3 times
Data Analysis
•Construct a scatter graph with a trend line –
the independent variable should always be on
the x-axis
•Describe the graph trend in words and with a
mathematical formula. E.g. A straight line of best
fit with a positive gradient (y = 84x-2)
Conclusion
• Make a conclusive statement – what
did you find out
• Offer a scientific explanation
• Comment on the validity of your
findings
• Compared to theory
• Showing consistency of data
Evaluation
Issue Improvement
Volume of acid not controlled Measure 100ml with measuring
cylinder
The order of the issues should be used to show the relative impact on the
experiment – with the greatest impact first

Investigation guide8 (updated oct 2016 for grade 8)

  • 1.
    Planning Research question: Howdoes changing _____ (units) affect the _____ (units) of ______ Background: Provide a context for the investigation Provide overview of known related Science Variables Factor Description Independent Temperature Temperature will be changed by heating with a Bunsen burner and measurements will be made every 10 degrees as measured by a thermometer Dependent Conductivity Measured using a LabPro conductivity probe Fixed or controlled Controlled variables should be values which are actually maintained by action not just using the same equipment
  • 2.
    Method A list ofthe equipment including details of type and amount A labelled diagram should be used to support method The method should consist of numbered single instruction sentences Must include how to alter the independent variable, how to measure the dependent variable and how to control other variable Must include taking at least 5 different values each with 3 trails Highlight any safety precautions made in an additional box Example 1. Set up equipment as shown in the diagram. 2. Use a measuring cylinder to collect 20ml of hydrochloric acid.
  • 3.
    Data Collection Independent Variable ± uncertainty (units) DependentVariable (units) Trial 1 Trial 2 Trial 3 Average Volume of acid (ml) Conductivity (μS/cm) Trial 1 Trial 2 Trial 3 Average 10 20 30 40 50 General example Example Qualitative notes including any anomalies should be recorded after the results table Remember you target is 5 sets of data each repeated 3 times
  • 4.
    Data Analysis •Construct ascatter graph with a trend line – the independent variable should always be on the x-axis •Describe the graph trend in words and with a mathematical formula. E.g. A straight line of best fit with a positive gradient (y = 84x-2)
  • 5.
    Conclusion • Make aconclusive statement – what did you find out • Offer a scientific explanation • Comment on the validity of your findings • Compared to theory • Showing consistency of data
  • 6.
    Evaluation Issue Improvement Volume ofacid not controlled Measure 100ml with measuring cylinder The order of the issues should be used to show the relative impact on the experiment – with the greatest impact first