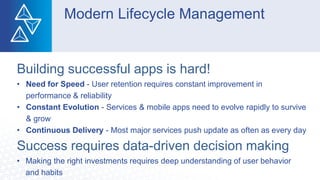
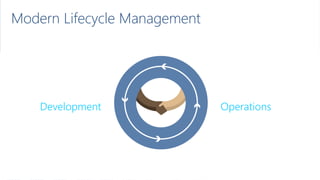
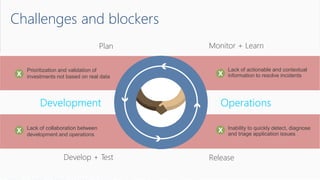
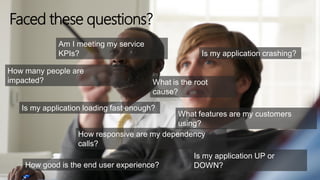
Visual Studio 2015 Launch event
Maak uw applicatie een succes
met Application Insights
About me
Mark van den Berg
Communicate
@markvandenberg
markvdb@delta-n.nl
http://markberg.wordpress.com
Agenda
• Modern Lifecycle Management
• What is Application Insights
• Getting Started
• Understanding Your Customers
Building successful apps is hard!
• Need for Speed - User retention requires constant improvement in
performance & reliability
• Constant Evolution - Services & mobile apps need to evolve rapidly to survive
& grow
• Continuous Delivery - Most major services push update as often as every day
Success requires data-driven decision making
• Making the right investments requires deep understanding of user behavior
and habits
Modern Lifecycle Management
Plan Monitor + Learn
Development
Release
Operations
Develop + Test
Challenges and blockers
• Lack of actionable and contextual
information to resolve incidents
• Inability to quickly detect, diagnose
and triage application issues
• Lack of collaboration between
development and operations
• Prioritization and validation of
investments not based on real data
Plan Monitor + Learn
Development
Release
Operations
Develop + Test
Am I meeting my service
KPIs?
What is the root
cause?
Is my application loading fast enough?
Is my application UP or
DOWN?
How many people are
impacted?
Is my application crashing?
What features are my customers
using?
How responsive are my dependency
calls?
How good is the end user experience?
Faced these questions?
What is Application Insights
Application Insights
Telemetry is collected at each
tier: mobile applications, server
applications and browser
Telemetry arrives in the Application
Insights service in the cloud where
it is processed & stored
Get a 360° view of the application
including availability, performance
and usage patterns
Key capabilities
360° View Across
Availability, Performance & Usage
• Overall app health via Overview Blade
• Quickly correlate performance & usage
data
• Detailed insights with a click of a button
through intuitive data exploration
Fast & Powerful Diagnostics &
Usage Insights
• Quickly diagnose availability &
performance issues
• Learn & improve continuously with
usage insights
• Extend your telemetry data
• Export your data for further analysis
Built-in Analytics
for any app
• Supports any app type
• Zero-click enablement
• No-touch monitoring
1
Sources of Telemetry
Outside-in monitoring
URL pings and web tests from 16
global points of presence
Observed user behavior
How is the application being used?
Developer traces and events
Whatever the developer would like to
send to Application Insights
Observed application behavior
No coding required – service dependencies,
queries, response time, exceptions, logs, etc.
Infrastructure performance
System performance counters
2
3
4
5
• Provides a summary of the application’s health - availability, performance and
usage
Overview Blade
Out of the box experience
• Correlate performance and usage in a
single view
• Pinpoint problems and investigate
questions like “Do I have network
performance issues that hurt user
adoption?”
• Click on specific metric and drill into
detailed information and answer
questions such as “what request is
failing the most?”
Drill down
Detailed insights with the click of a button
• Metrics Explorer provides a flexible
multi-dimensional UI over custom and
out-of-the-box telemetry collected
• Diagnostic Search enables
efficient search over large
sets of data using the
query experience
Drill down tools
Powerful insights with Metrics Explorer and Diagnostic Search
Identify & triage availability issues
• Monitor your web sites with simple pings to complex
web tests from points around the world
Diagnose & solve performance problems
• Quickly diagnose issues by accessing rich
application performance data from the client
view to dependencies
Fast and powerful insights
Mobile crash/sever exception analytics
• Real time view of crashes happening on devices,
allowing you to focus on fixing key issues with
the biggest impact first
Fast and powerful insights
Getting Started
Easily add analytics across multiple platforms
including: ASP.NET, Java/J2EE, iOS, Android,
Windows, as well as OSS technologies such
as Node.JS, PHP, Ruby, Python, etc.
Built-in Analytics
Any app support
Understanding Your Customers
• Understand where your users are
coming from and where they spend
most of their time
• Prioritize future investments and
continuously improve your app
based on user activity and usage
patterns and trends
Fast and powerful insights
Learn & improve with usage insights
• Add custom metrics and events to
better track and analyze user activity
• Continuously Export data to Azure Blob
Storage for custom integration with other
data sources and further analysis
Fast and powerful insights
Extend telemetry data
Public Preview
Available in 3 tiers
• Free,
• Standard
• Premium
Differentiated mainly on data
volume and retention limits
Vragen
Visual Studio TFS 2015 Launch Event
Cross Platform Development
3 november 2015
16:00 – 19:30
Den Haag
Toegang gratis
Meer informatie en aanmelden via:
Visual Studio TFS 2015 – Cross Platform Development
Globaal Programma:
- Visual Studio 2015 overview door Microsoft
- Migreren naar Visual Studio Online
- Cross-platform apps bouwen met VSO Build vNext
- Containers en Cross-Platform Development

Visual studio 2015 - Application Insights

  • 1.
    Visual Studio 2015Launch event Maak uw applicatie een succes met Application Insights
  • 3.
  • 4.
  • 5.
    Agenda • Modern LifecycleManagement • What is Application Insights • Getting Started • Understanding Your Customers
  • 6.
    Building successful appsis hard! • Need for Speed - User retention requires constant improvement in performance & reliability • Constant Evolution - Services & mobile apps need to evolve rapidly to survive & grow • Continuous Delivery - Most major services push update as often as every day Success requires data-driven decision making • Making the right investments requires deep understanding of user behavior and habits Modern Lifecycle Management
  • 7.
    Modern Lifecycle Management PlanMonitor + Learn Development Release Operations Develop + Test
  • 8.
    Challenges and blockers •Lack of actionable and contextual information to resolve incidents • Inability to quickly detect, diagnose and triage application issues • Lack of collaboration between development and operations • Prioritization and validation of investments not based on real data Plan Monitor + Learn Development Release Operations Develop + Test
  • 9.
    Am I meetingmy service KPIs? What is the root cause? Is my application loading fast enough? Is my application UP or DOWN? How many people are impacted? Is my application crashing? What features are my customers using? How responsive are my dependency calls? How good is the end user experience? Faced these questions?
  • 10.
  • 11.
    Application Insights Telemetry iscollected at each tier: mobile applications, server applications and browser Telemetry arrives in the Application Insights service in the cloud where it is processed & stored Get a 360° view of the application including availability, performance and usage patterns
  • 12.
    Key capabilities 360° ViewAcross Availability, Performance & Usage • Overall app health via Overview Blade • Quickly correlate performance & usage data • Detailed insights with a click of a button through intuitive data exploration Fast & Powerful Diagnostics & Usage Insights • Quickly diagnose availability & performance issues • Learn & improve continuously with usage insights • Extend your telemetry data • Export your data for further analysis Built-in Analytics for any app • Supports any app type • Zero-click enablement • No-touch monitoring
  • 13.
    1 Sources of Telemetry Outside-inmonitoring URL pings and web tests from 16 global points of presence Observed user behavior How is the application being used? Developer traces and events Whatever the developer would like to send to Application Insights Observed application behavior No coding required – service dependencies, queries, response time, exceptions, logs, etc. Infrastructure performance System performance counters 2 3 4 5
  • 14.
    • Provides asummary of the application’s health - availability, performance and usage Overview Blade Out of the box experience
  • 15.
    • Correlate performanceand usage in a single view • Pinpoint problems and investigate questions like “Do I have network performance issues that hurt user adoption?” • Click on specific metric and drill into detailed information and answer questions such as “what request is failing the most?” Drill down Detailed insights with the click of a button
  • 16.
    • Metrics Explorerprovides a flexible multi-dimensional UI over custom and out-of-the-box telemetry collected • Diagnostic Search enables efficient search over large sets of data using the query experience Drill down tools Powerful insights with Metrics Explorer and Diagnostic Search
  • 17.
    Identify & triageavailability issues • Monitor your web sites with simple pings to complex web tests from points around the world Diagnose & solve performance problems • Quickly diagnose issues by accessing rich application performance data from the client view to dependencies Fast and powerful insights
  • 18.
    Mobile crash/sever exceptionanalytics • Real time view of crashes happening on devices, allowing you to focus on fixing key issues with the biggest impact first Fast and powerful insights
  • 19.
  • 20.
    Easily add analyticsacross multiple platforms including: ASP.NET, Java/J2EE, iOS, Android, Windows, as well as OSS technologies such as Node.JS, PHP, Ruby, Python, etc. Built-in Analytics Any app support
  • 22.
  • 23.
    • Understand whereyour users are coming from and where they spend most of their time • Prioritize future investments and continuously improve your app based on user activity and usage patterns and trends Fast and powerful insights Learn & improve with usage insights
  • 24.
    • Add custommetrics and events to better track and analyze user activity • Continuously Export data to Azure Blob Storage for custom integration with other data sources and further analysis Fast and powerful insights Extend telemetry data
  • 26.
    Public Preview Available in3 tiers • Free, • Standard • Premium Differentiated mainly on data volume and retention limits
  • 27.
  • 28.
    Visual Studio TFS2015 Launch Event Cross Platform Development 3 november 2015 16:00 – 19:30 Den Haag Toegang gratis Meer informatie en aanmelden via: Visual Studio TFS 2015 – Cross Platform Development Globaal Programma: - Visual Studio 2015 overview door Microsoft - Migreren naar Visual Studio Online - Cross-platform apps bouwen met VSO Build vNext - Containers en Cross-Platform Development