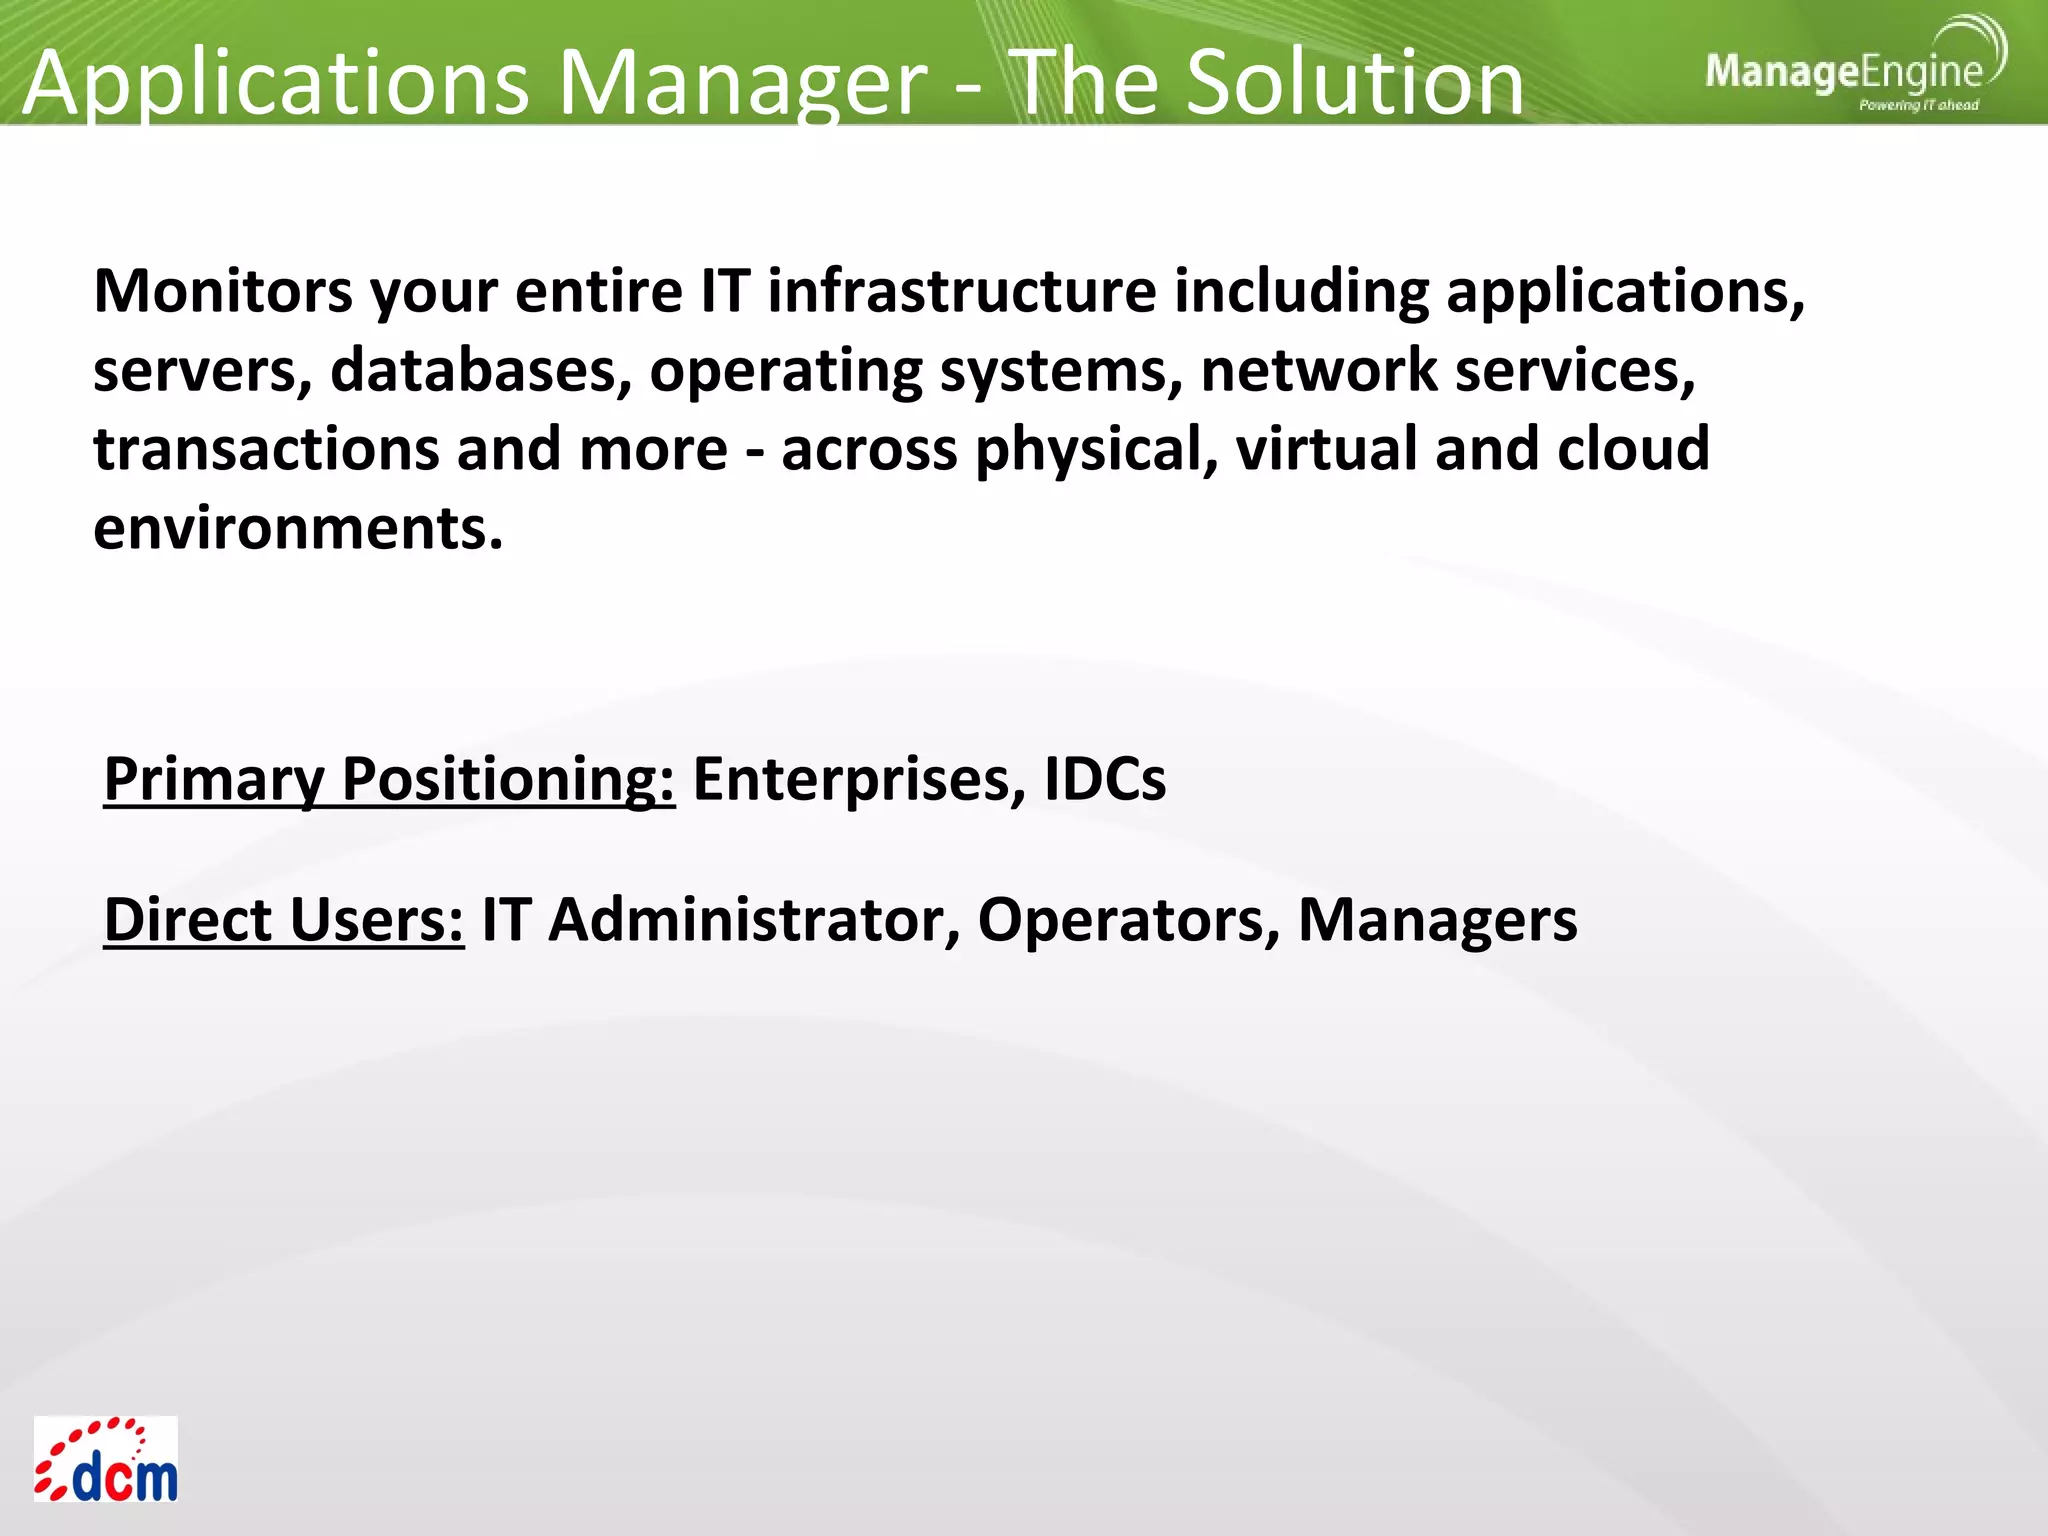
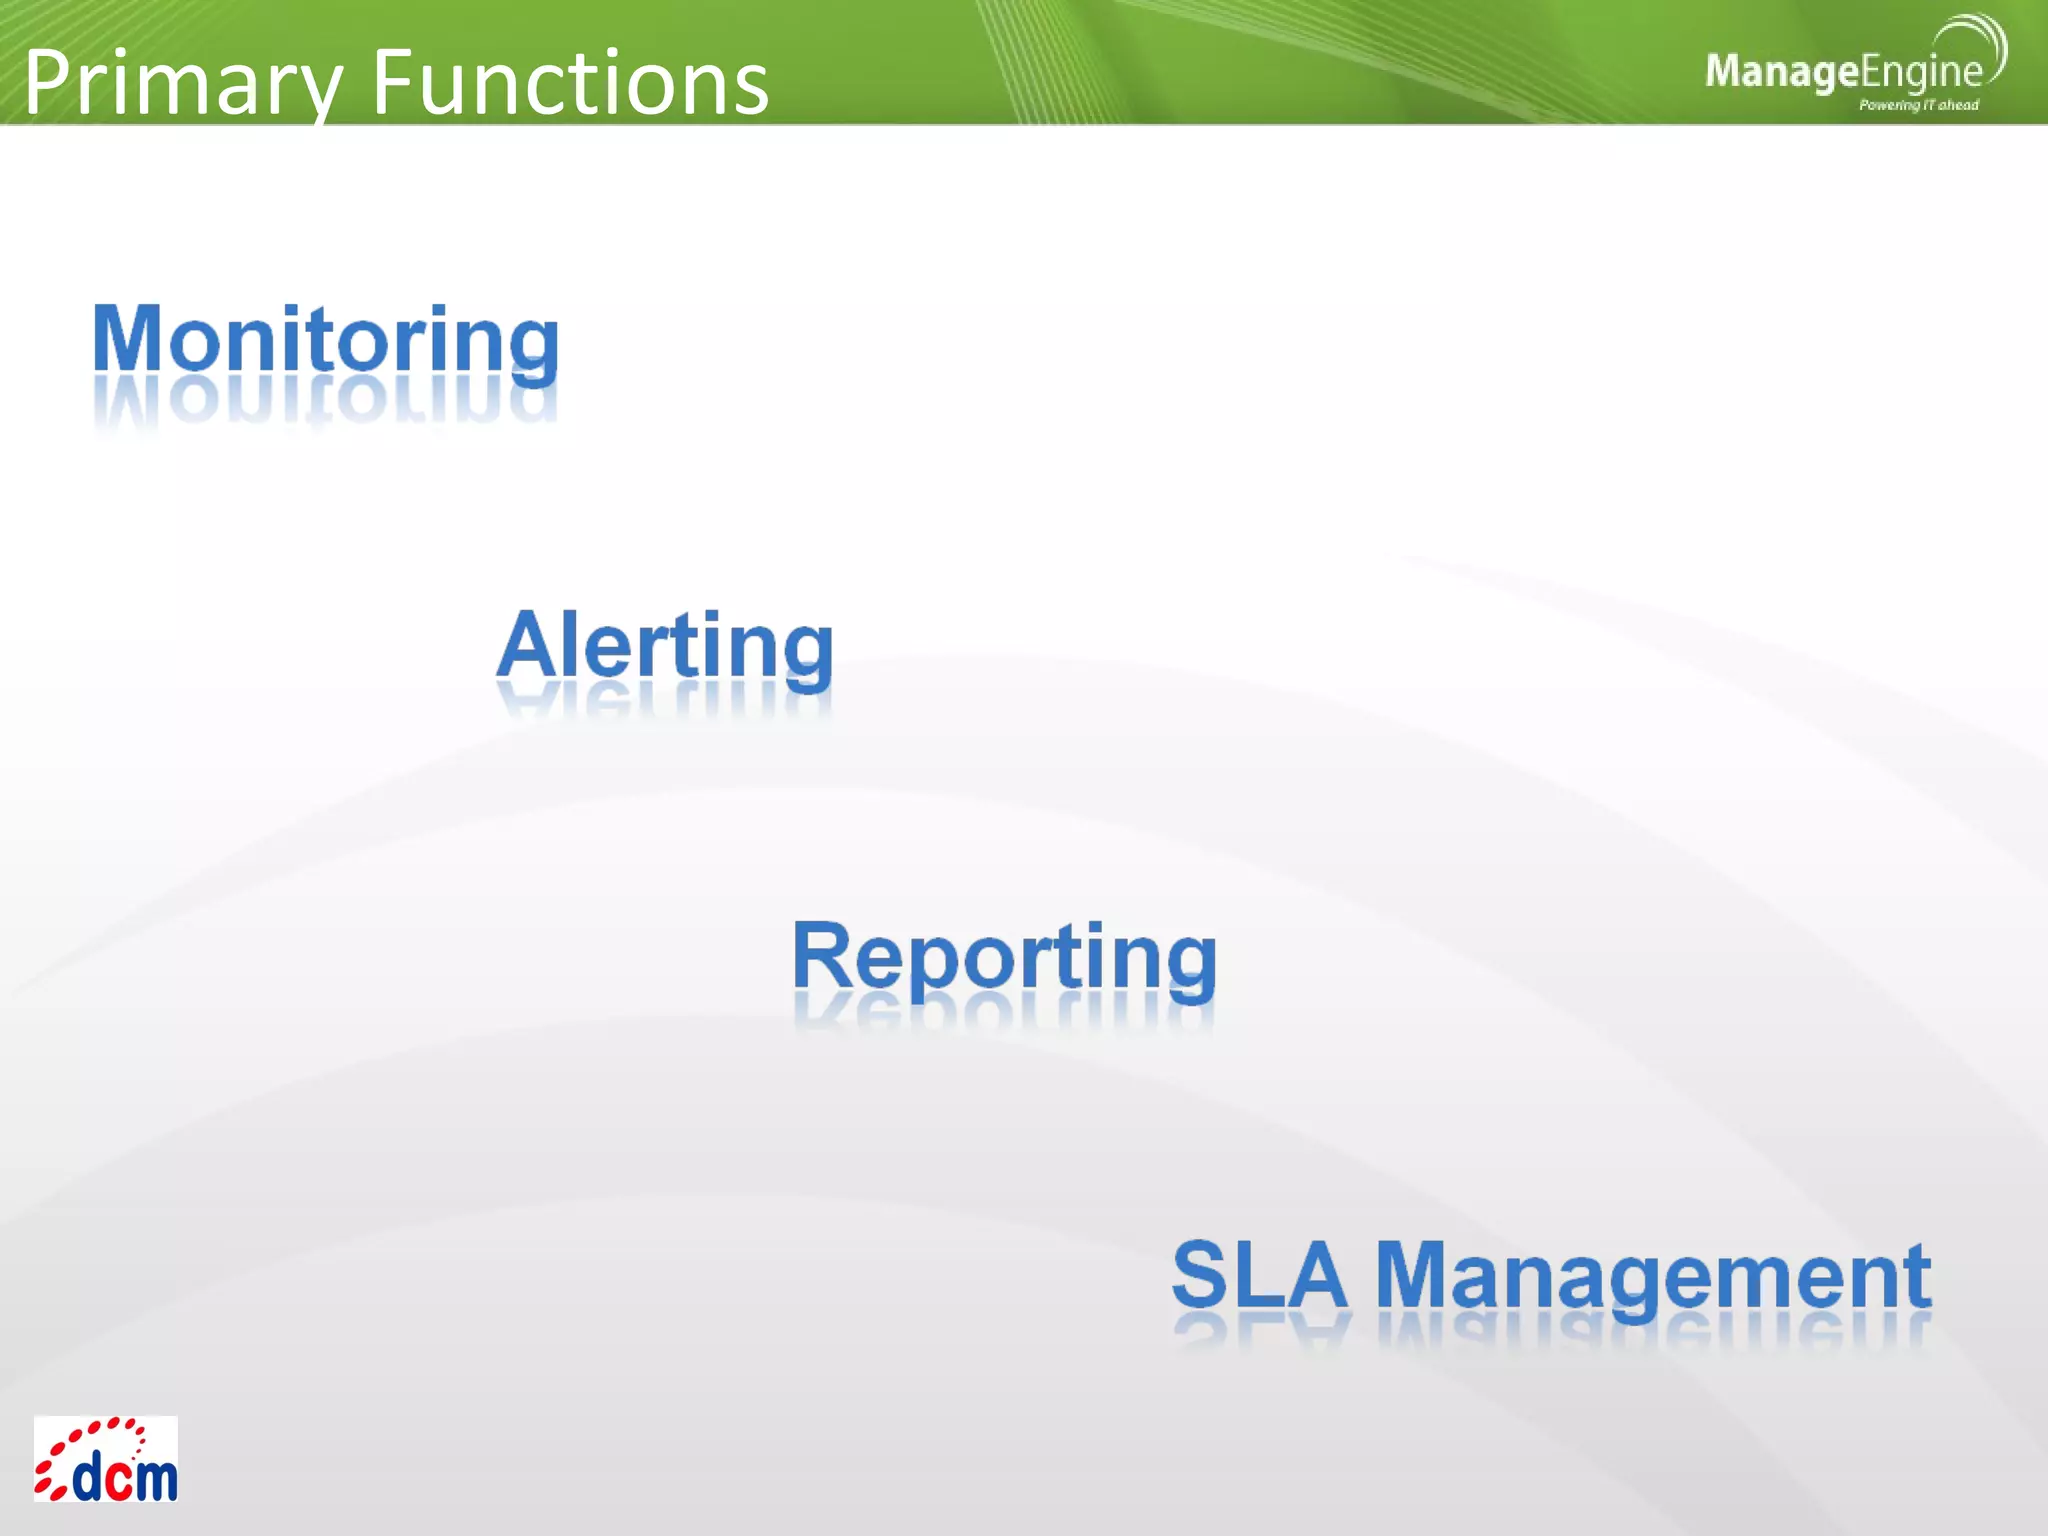
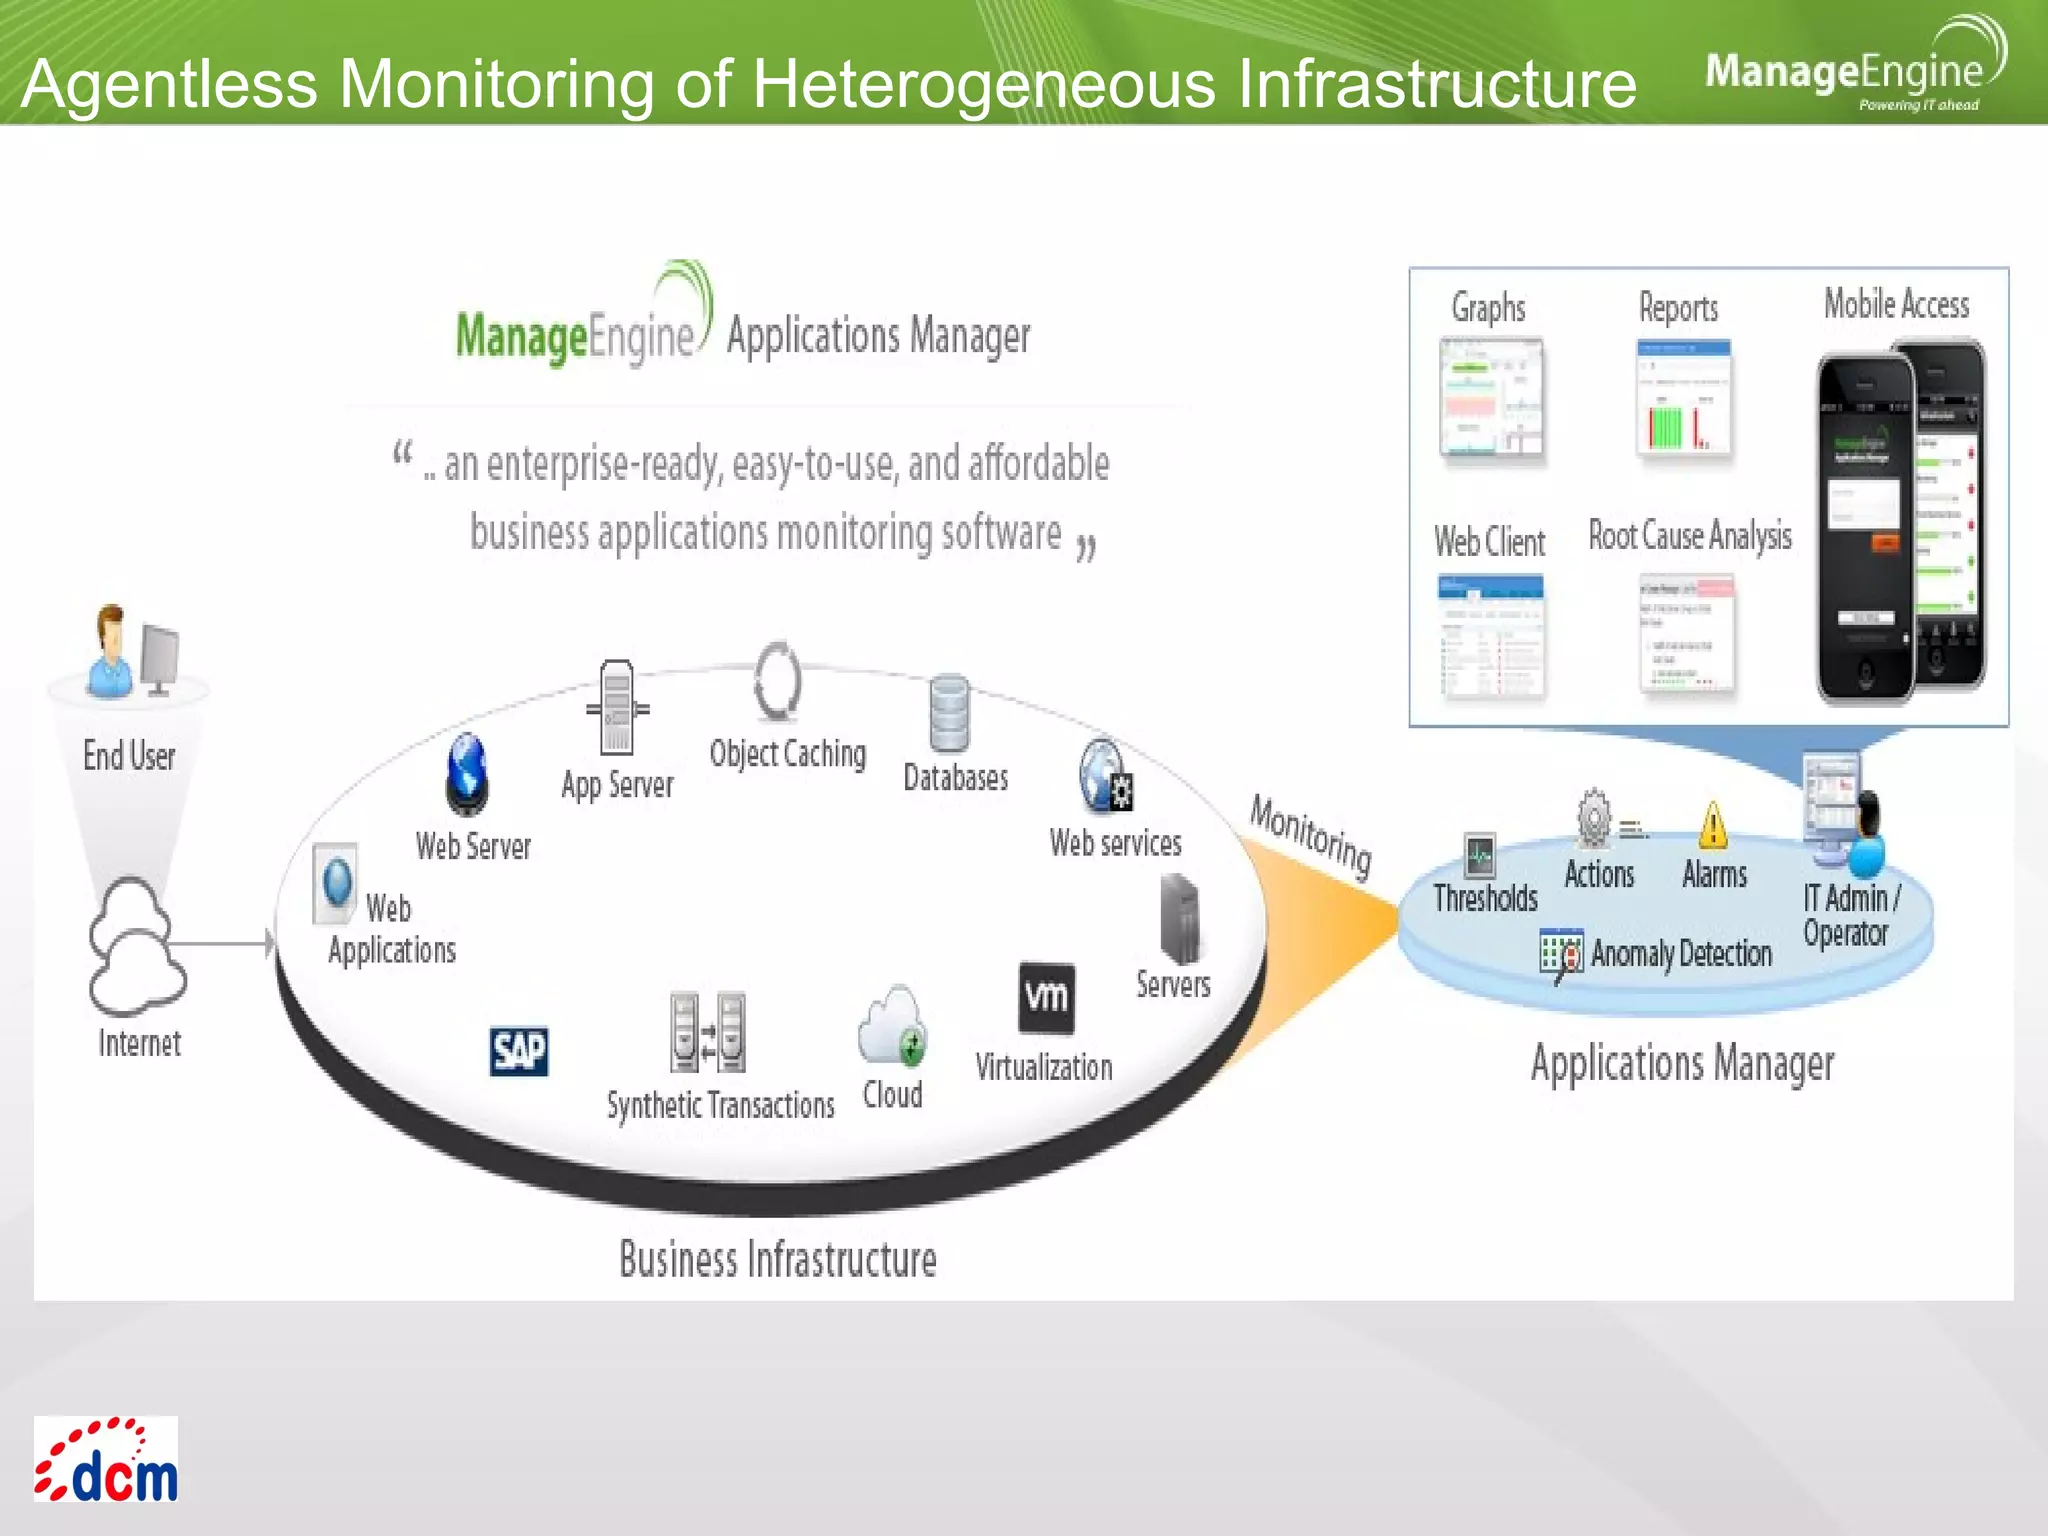
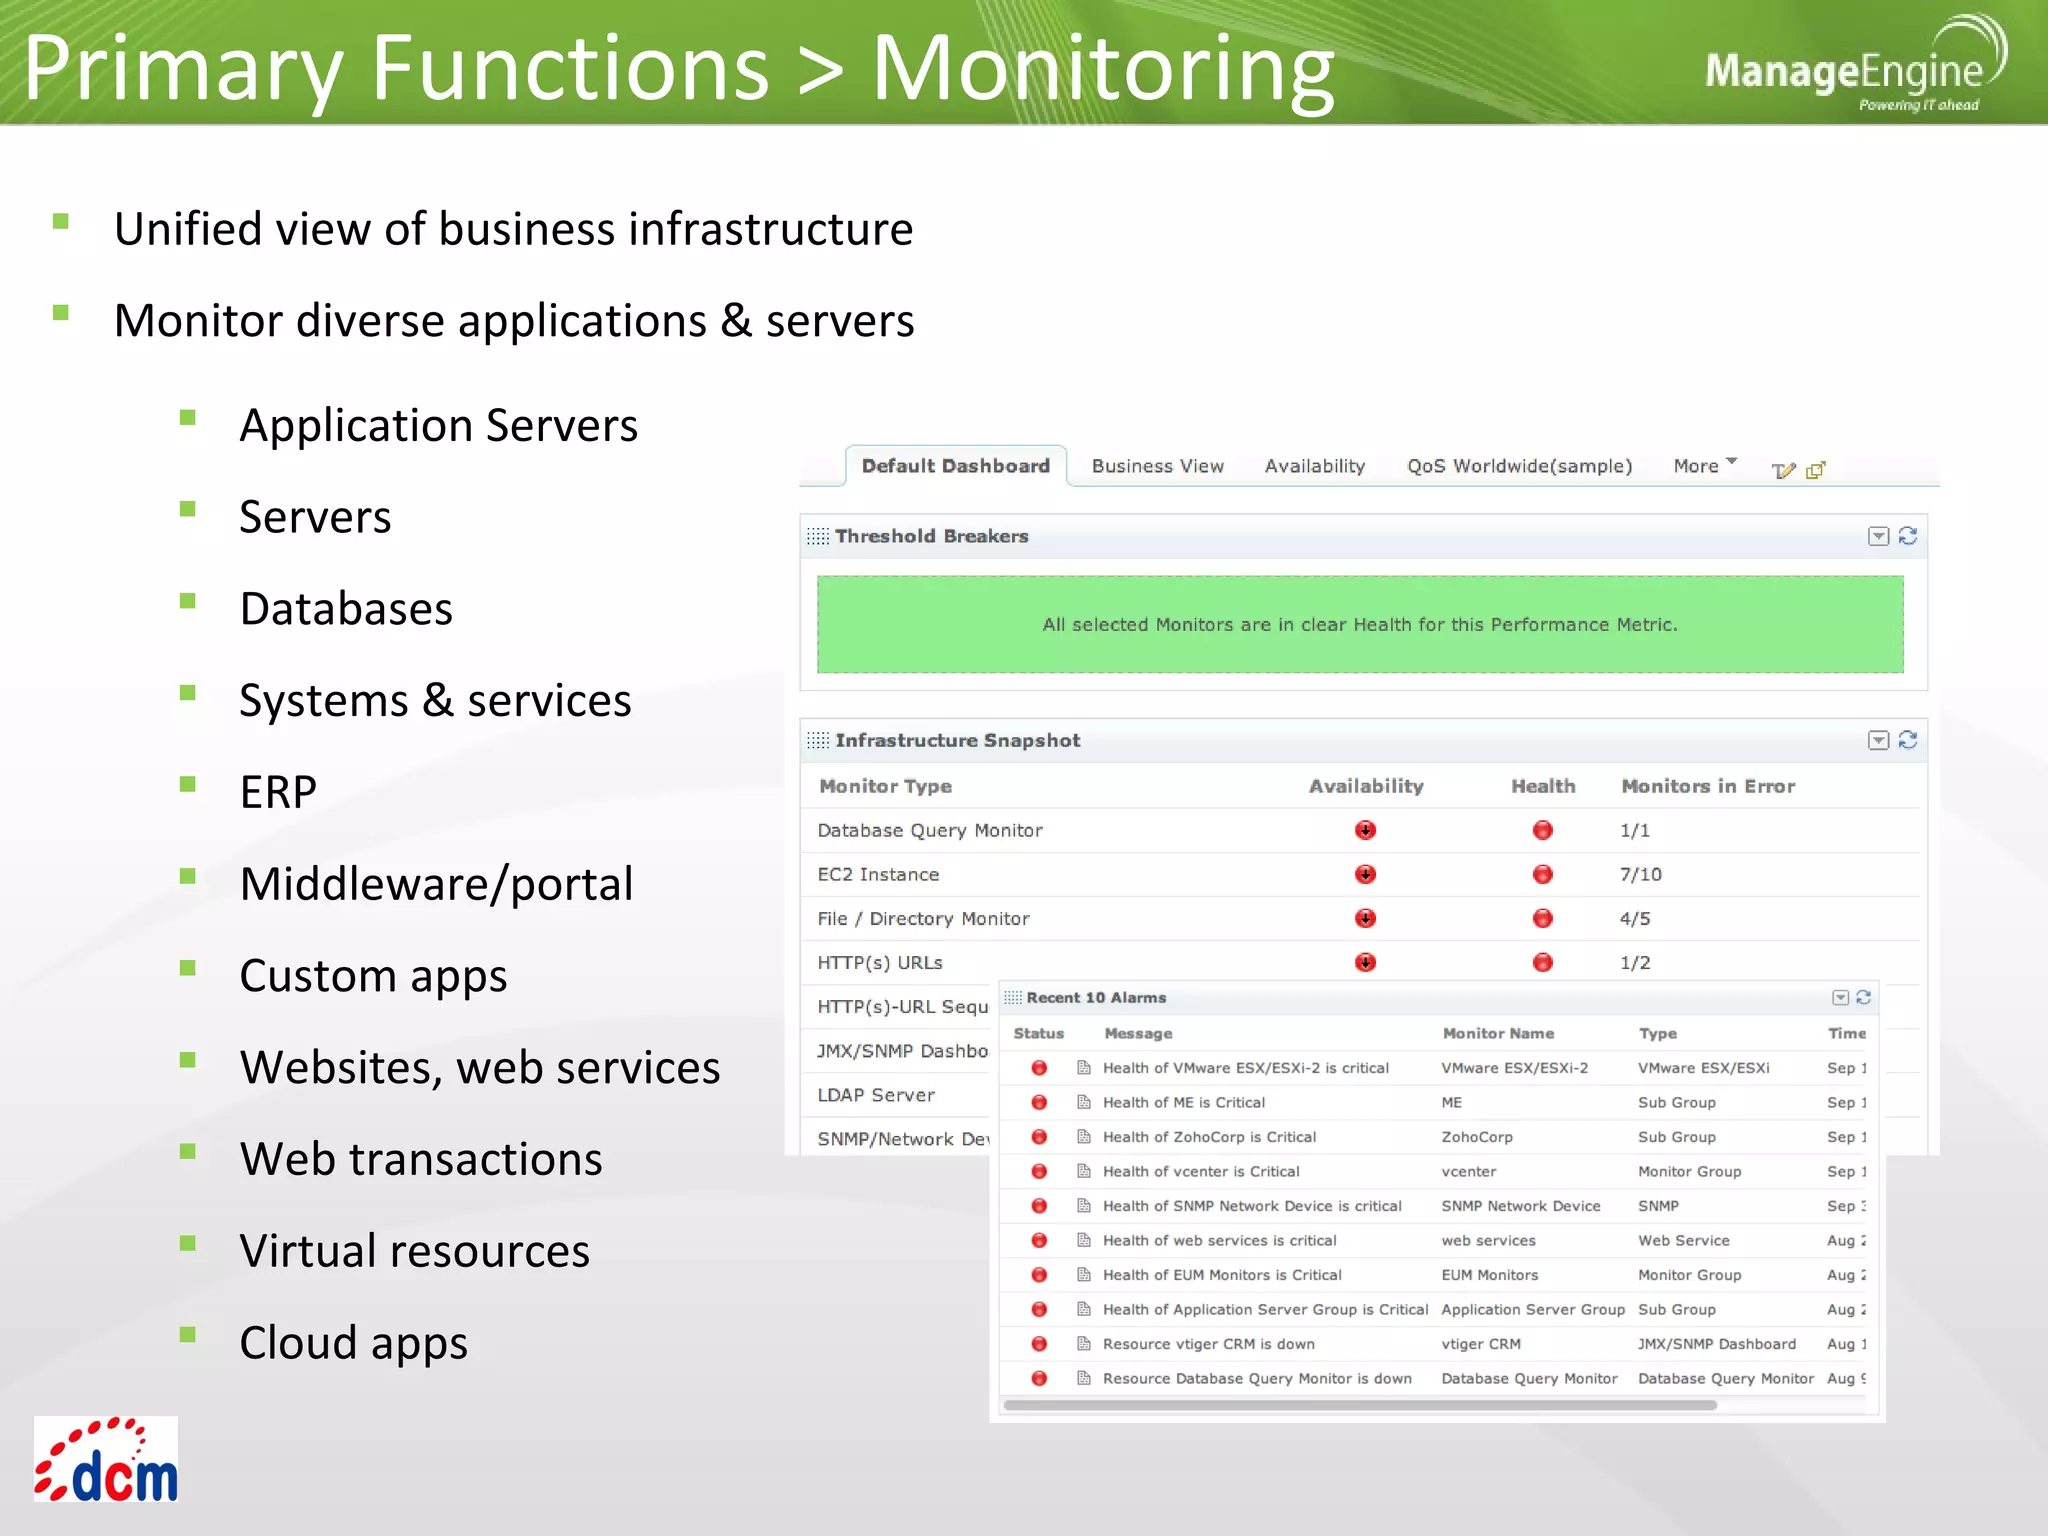
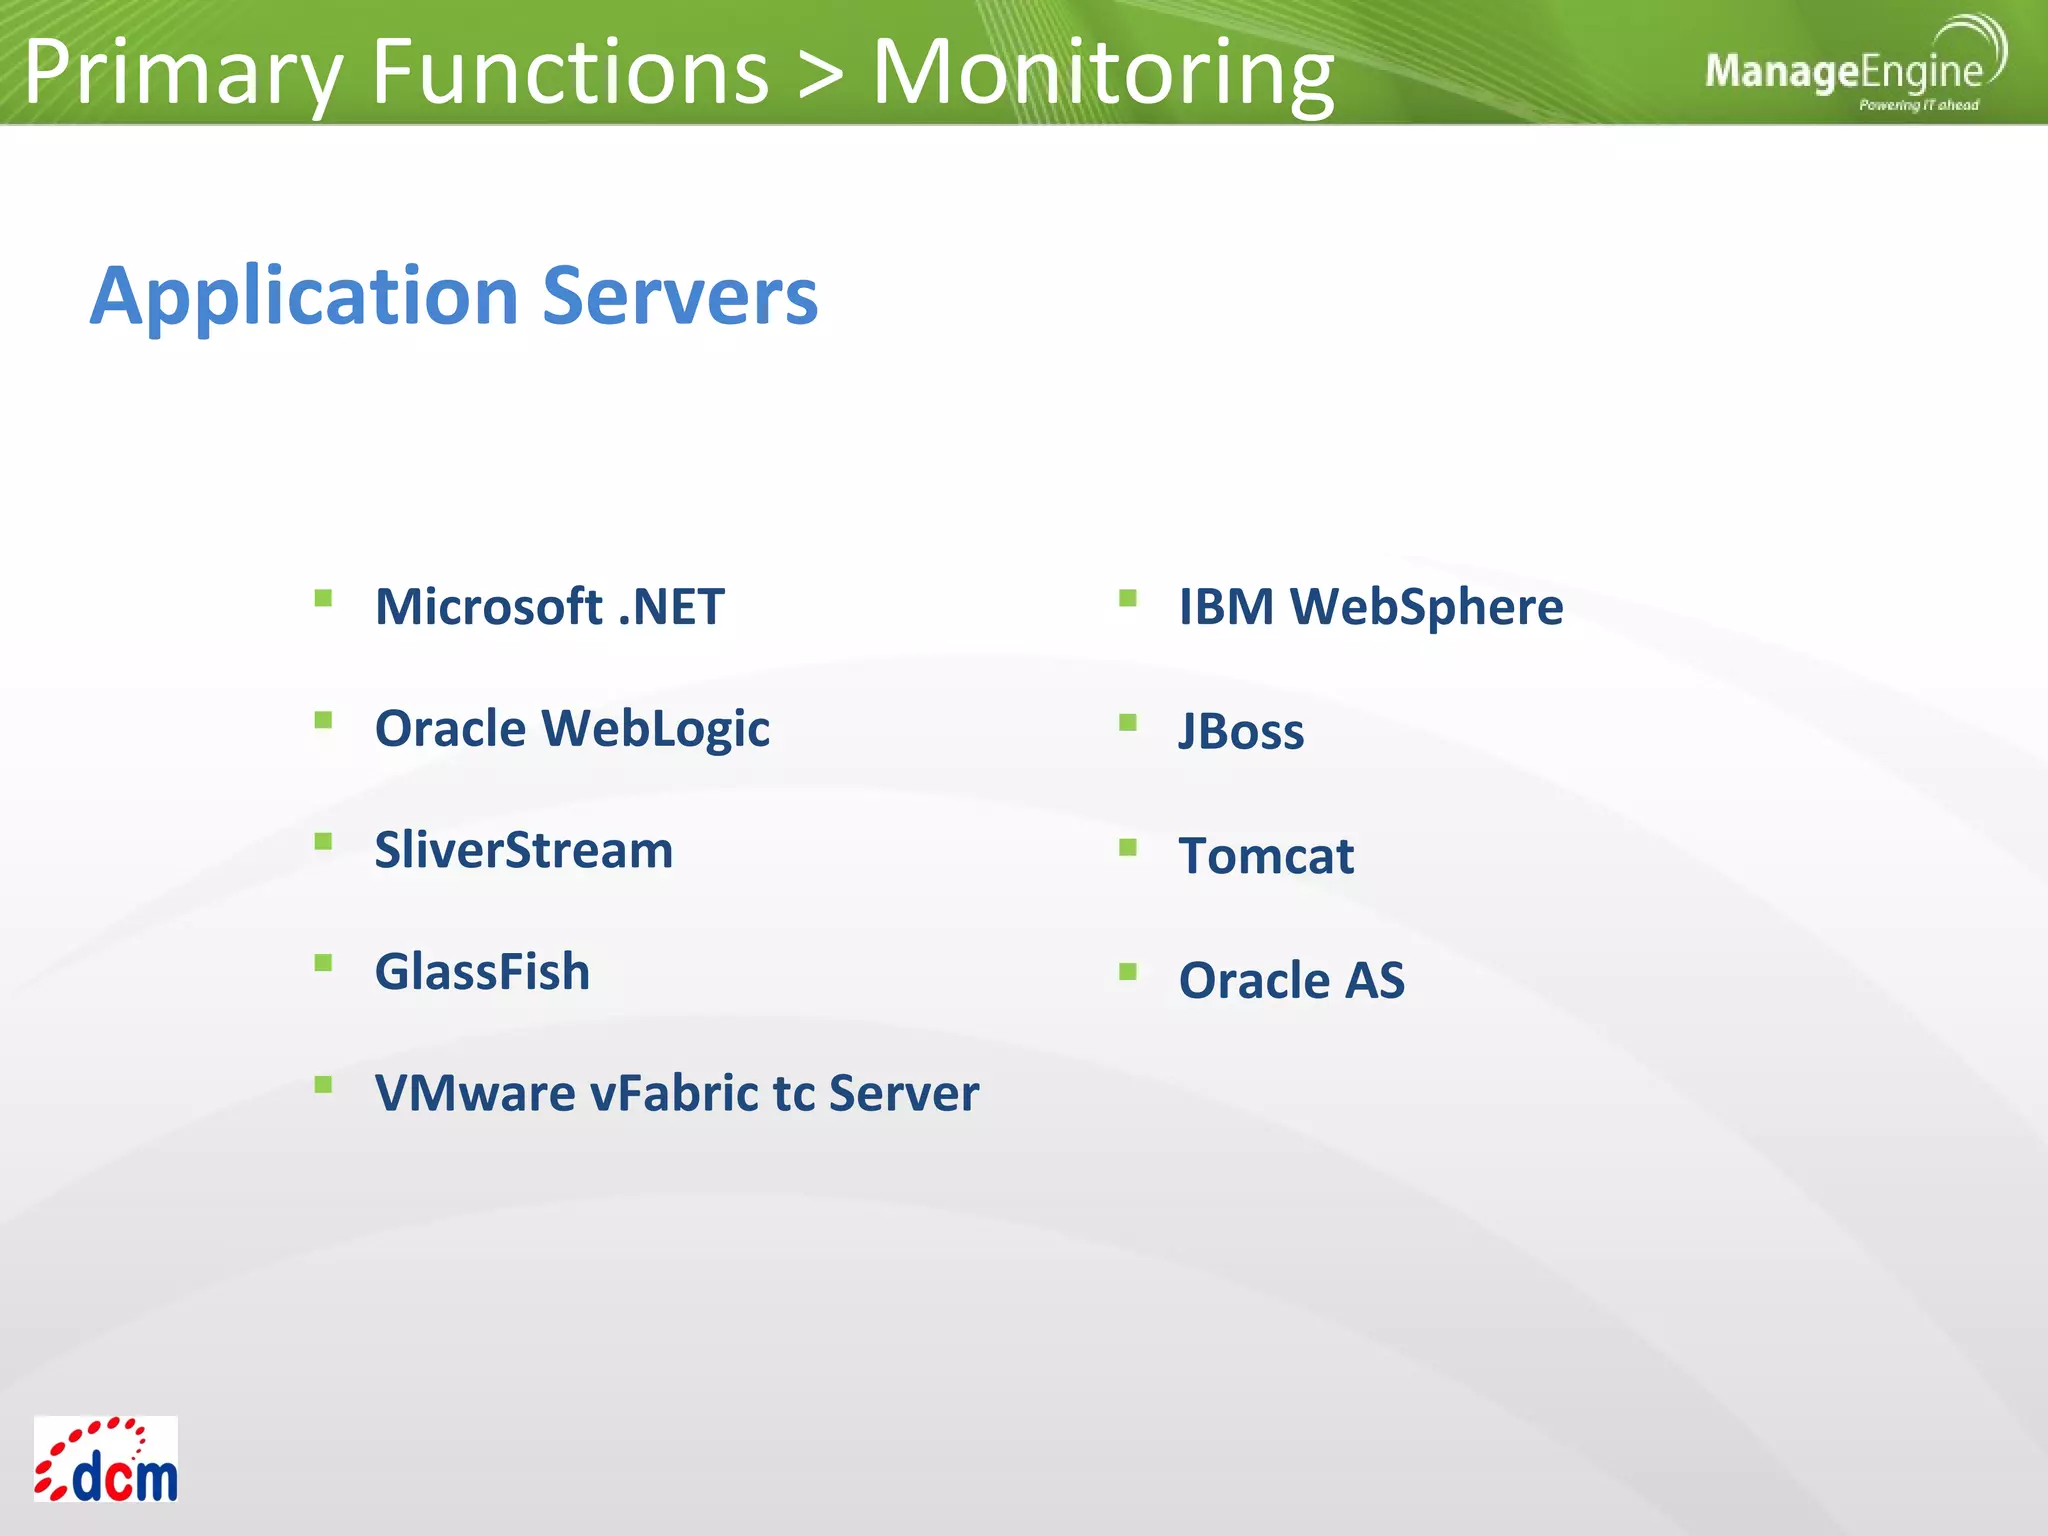
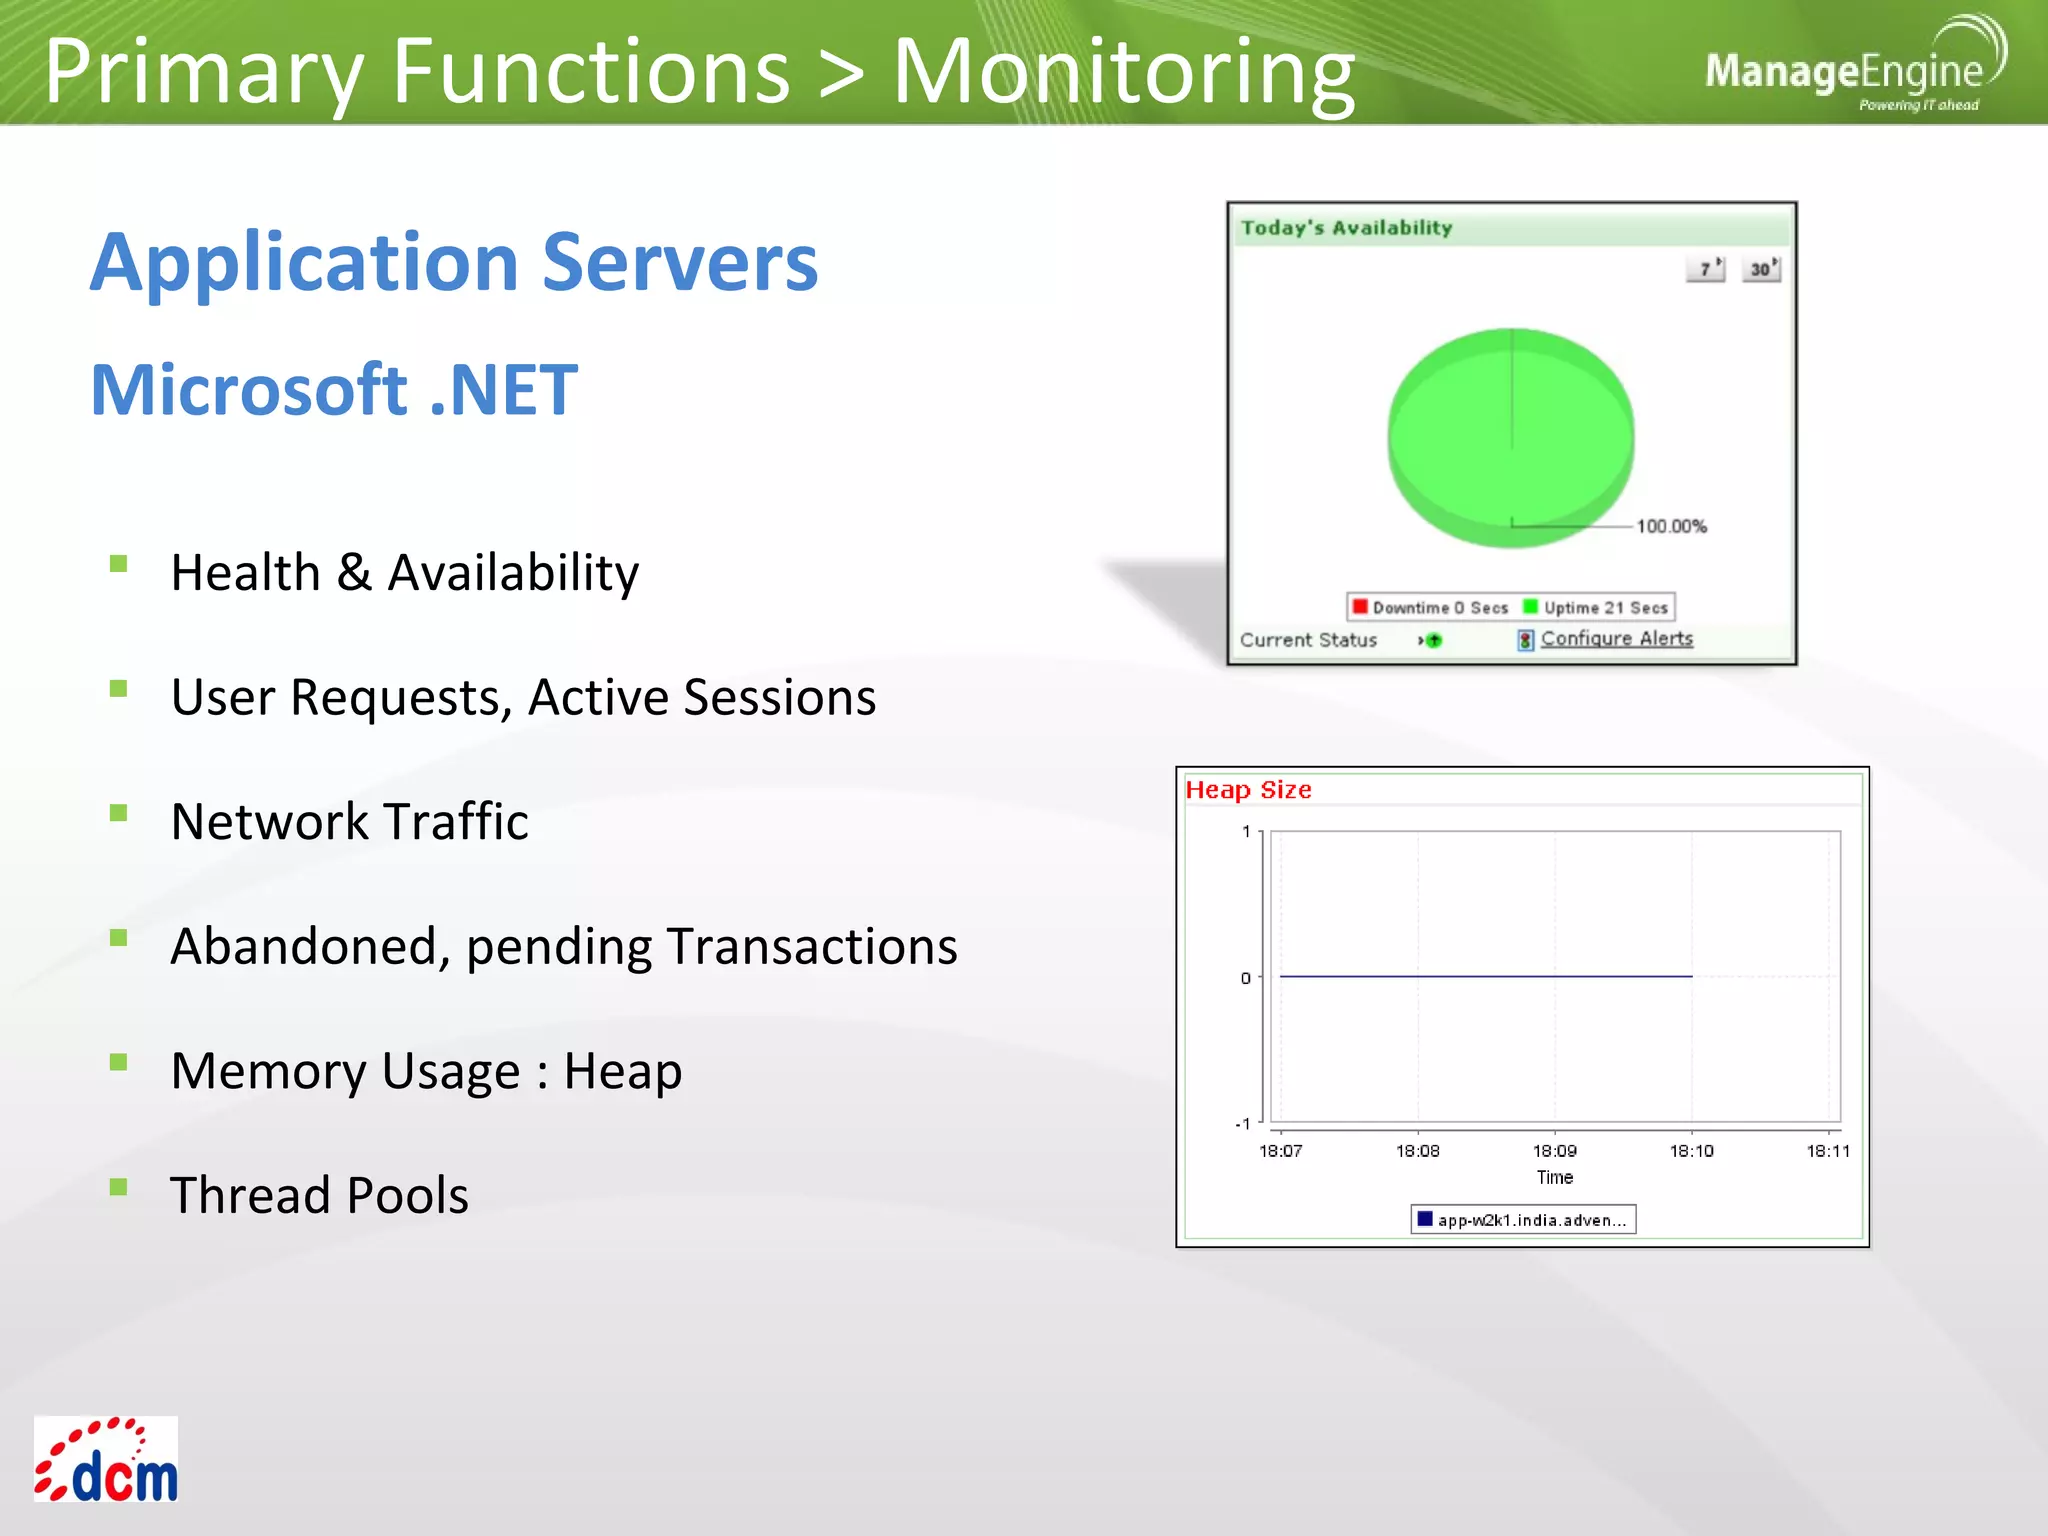
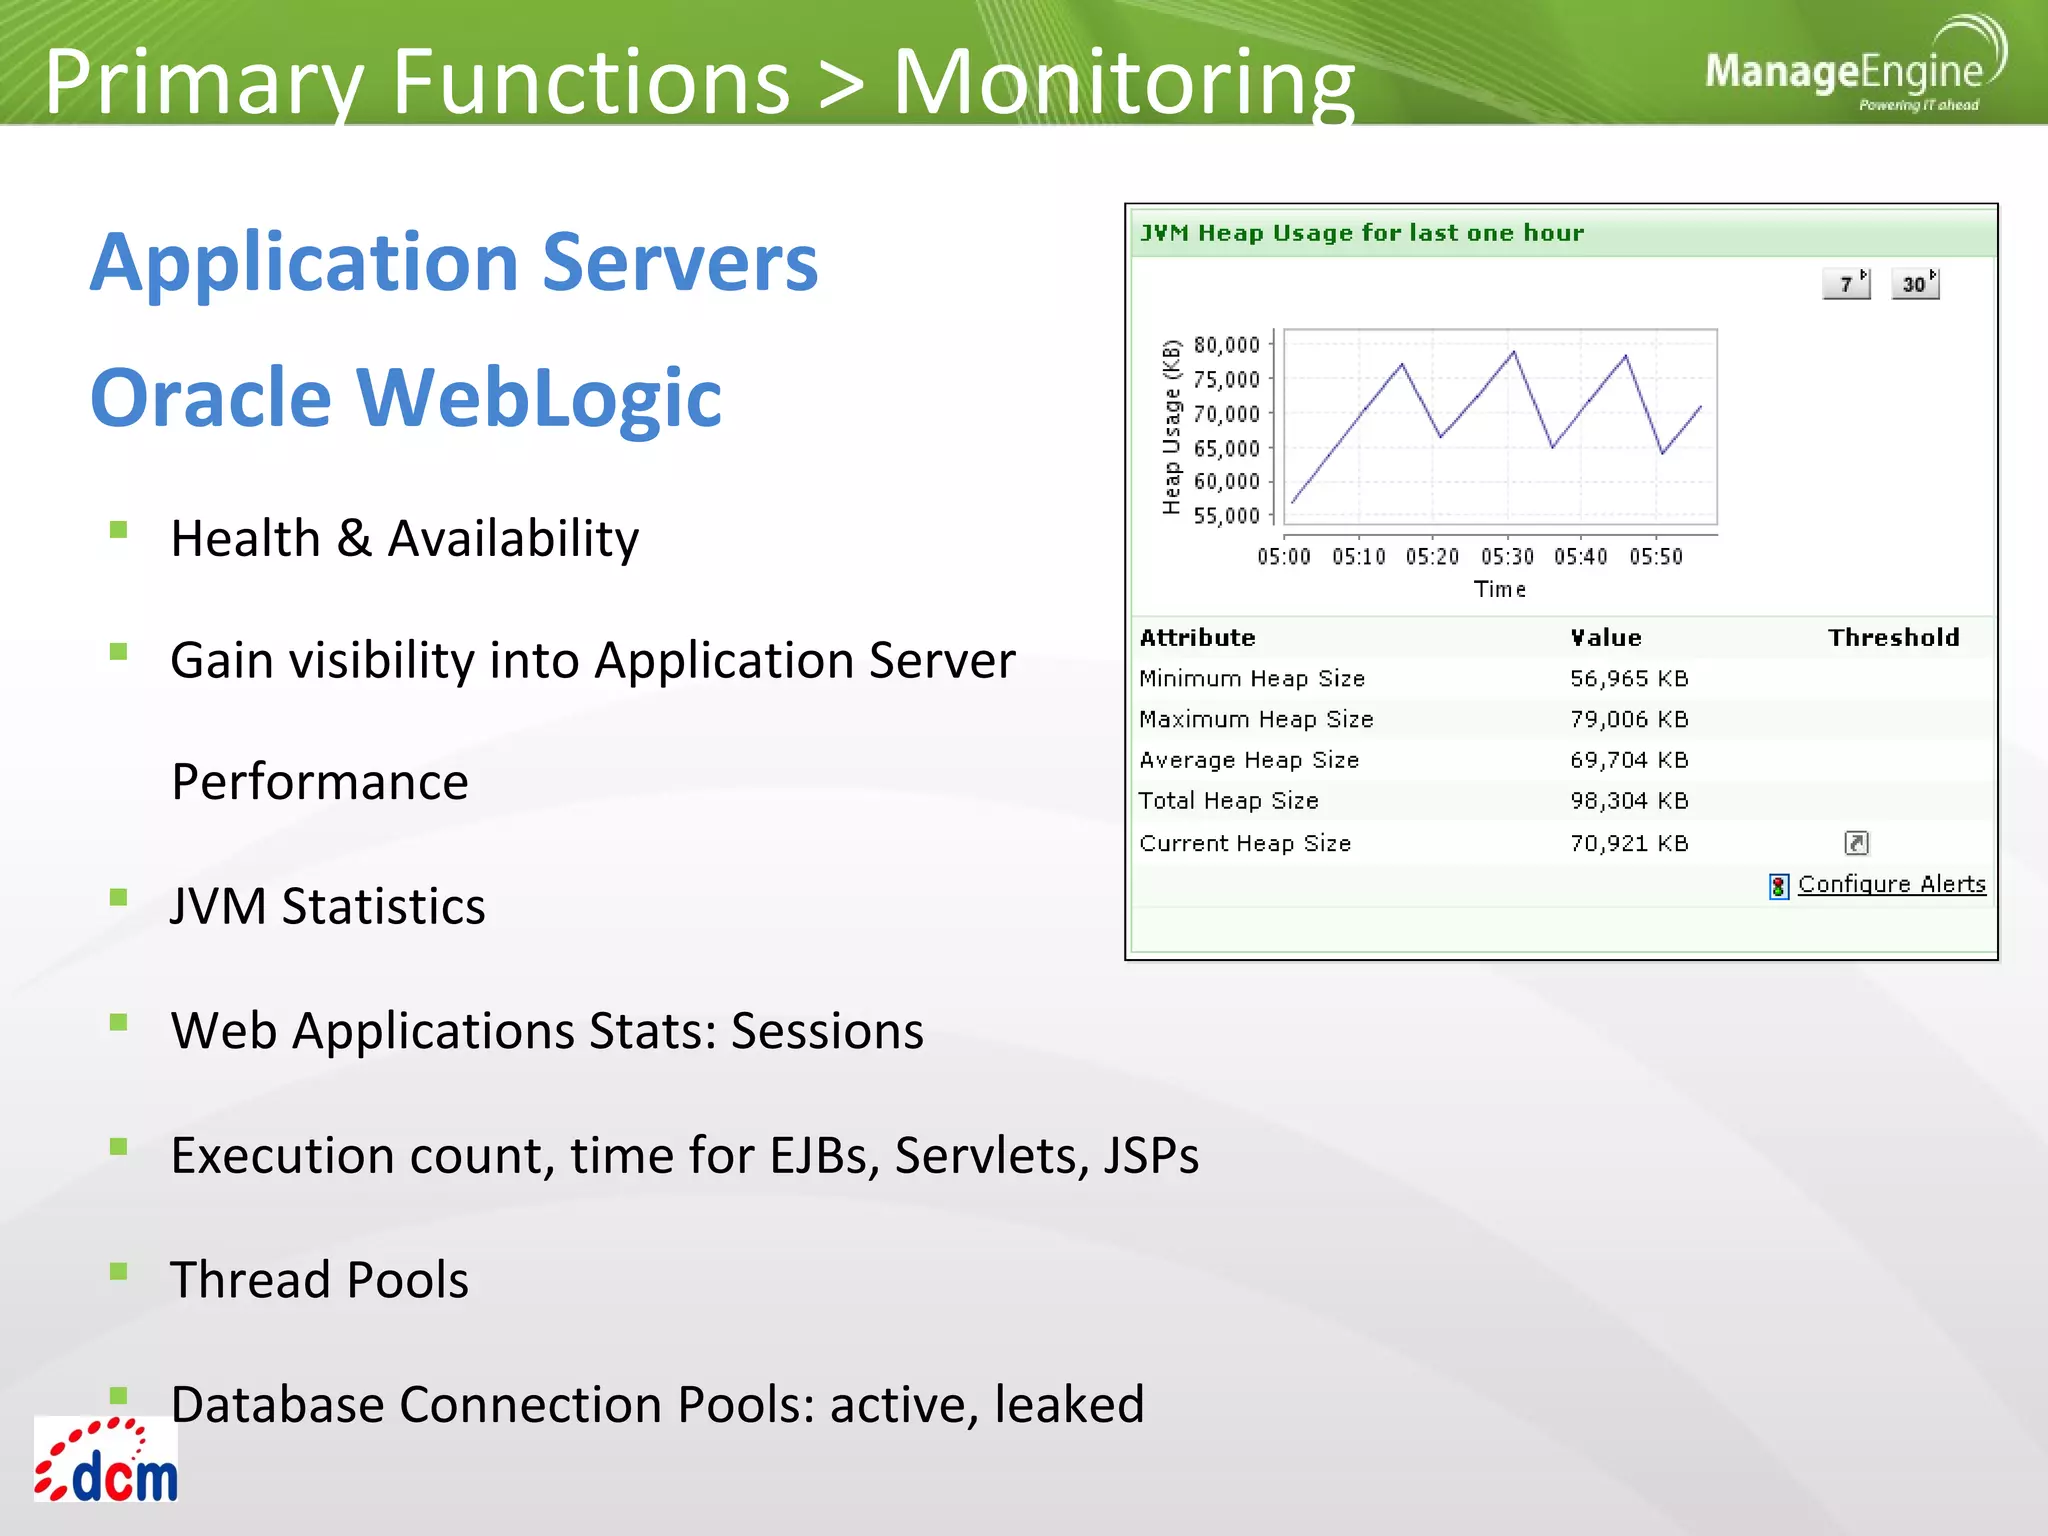
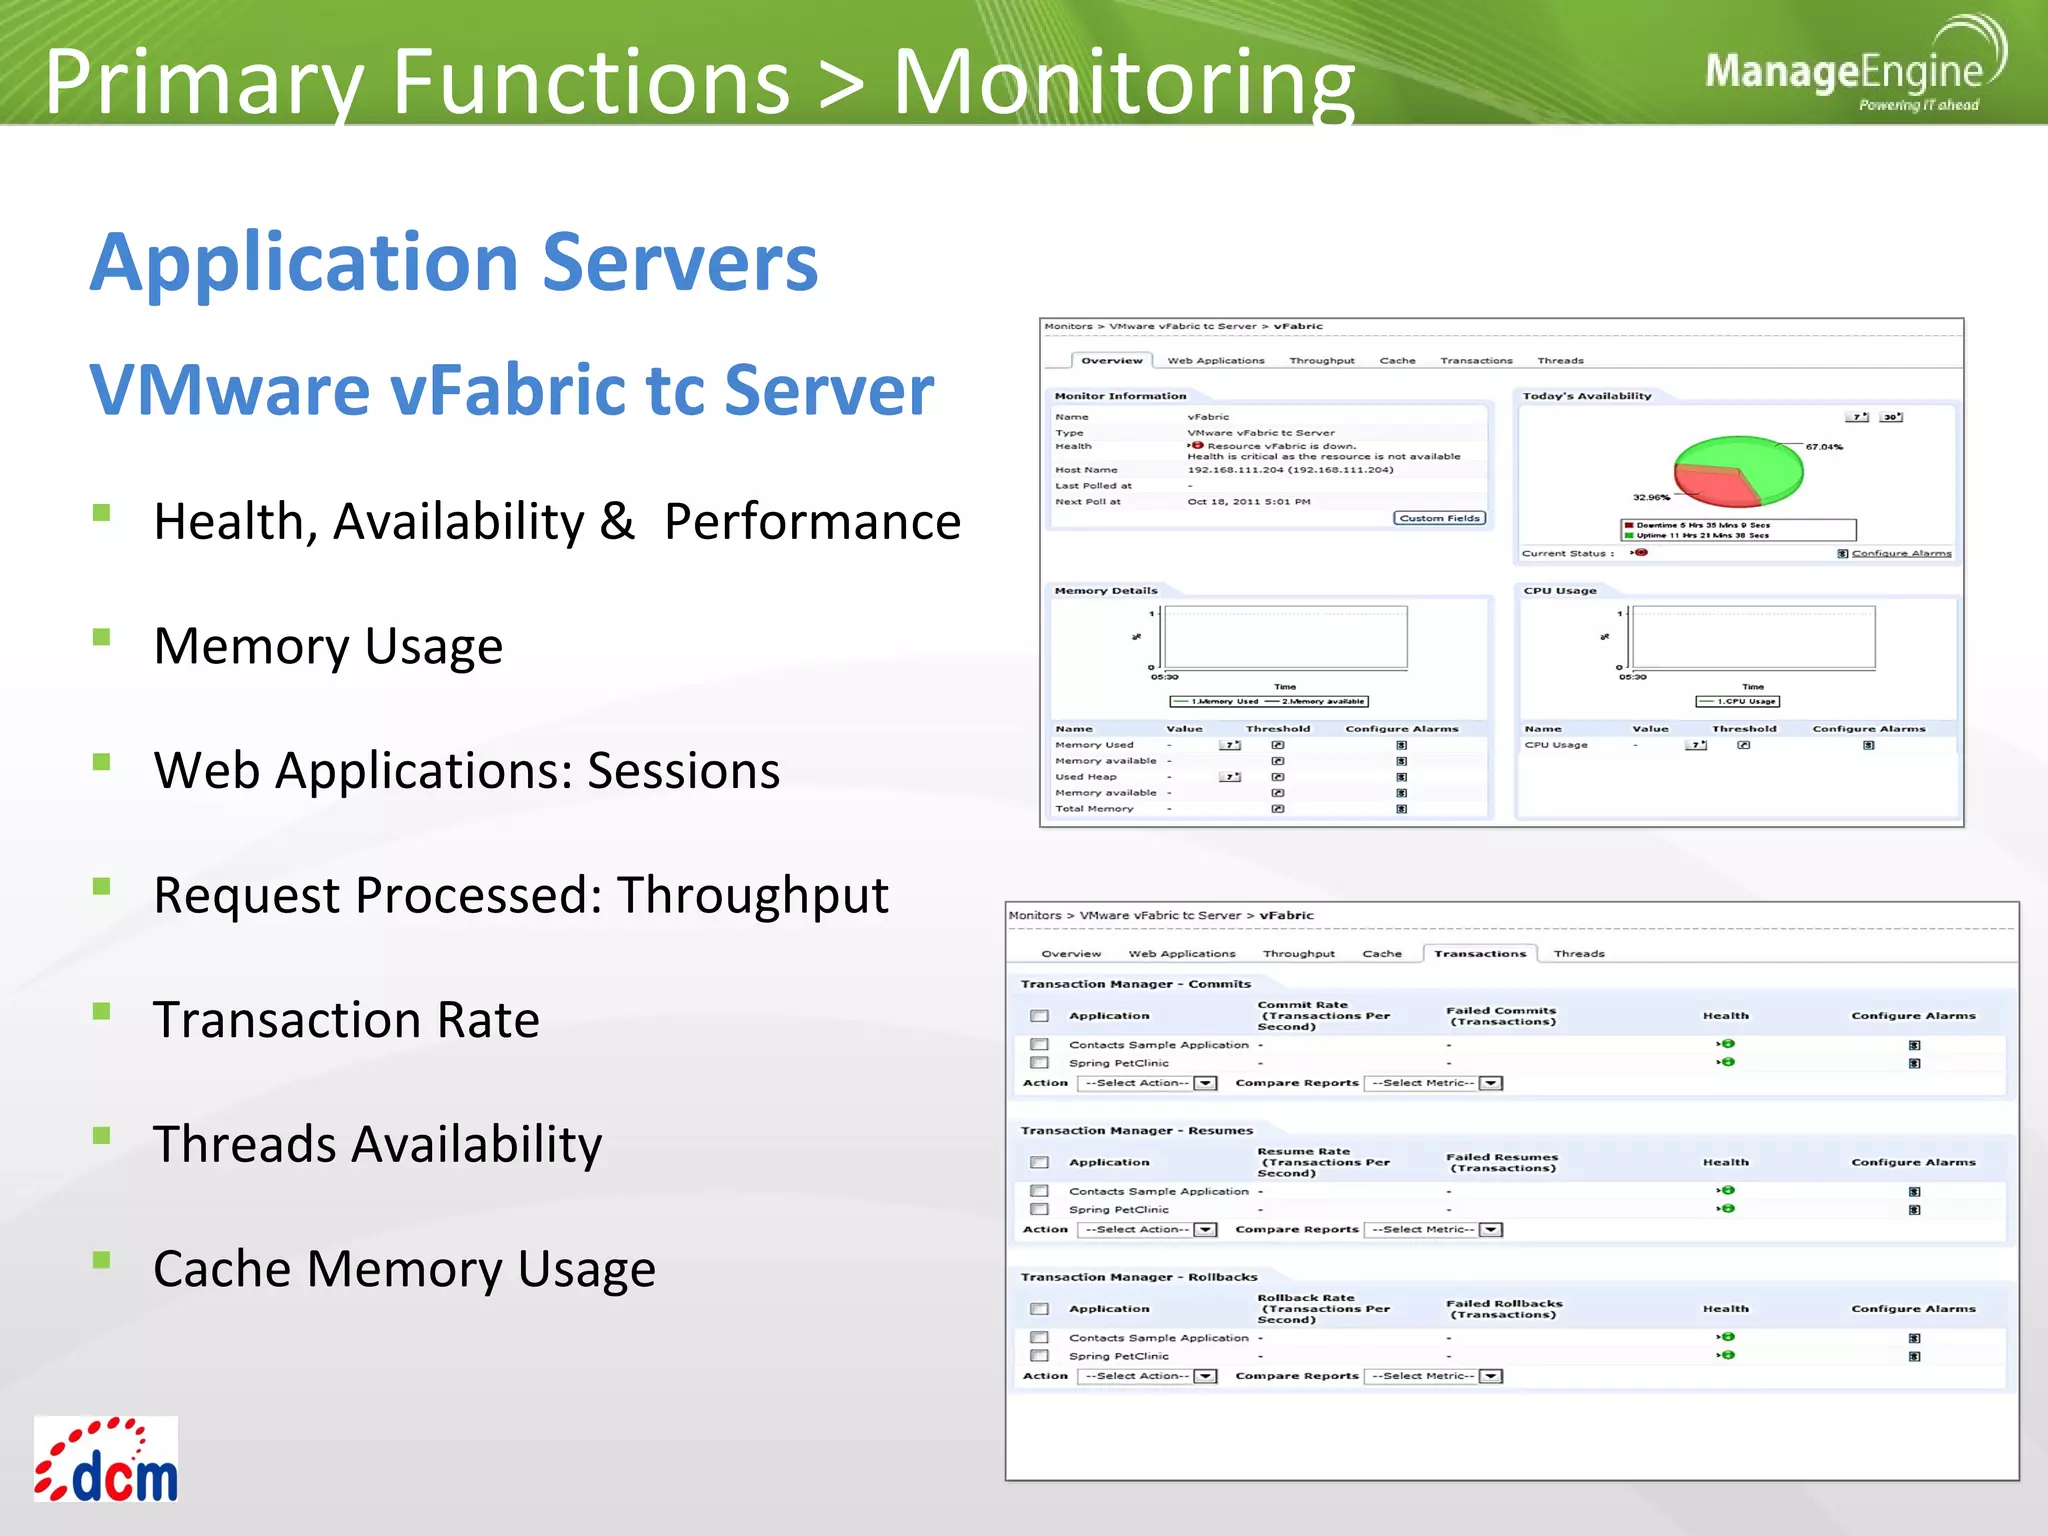
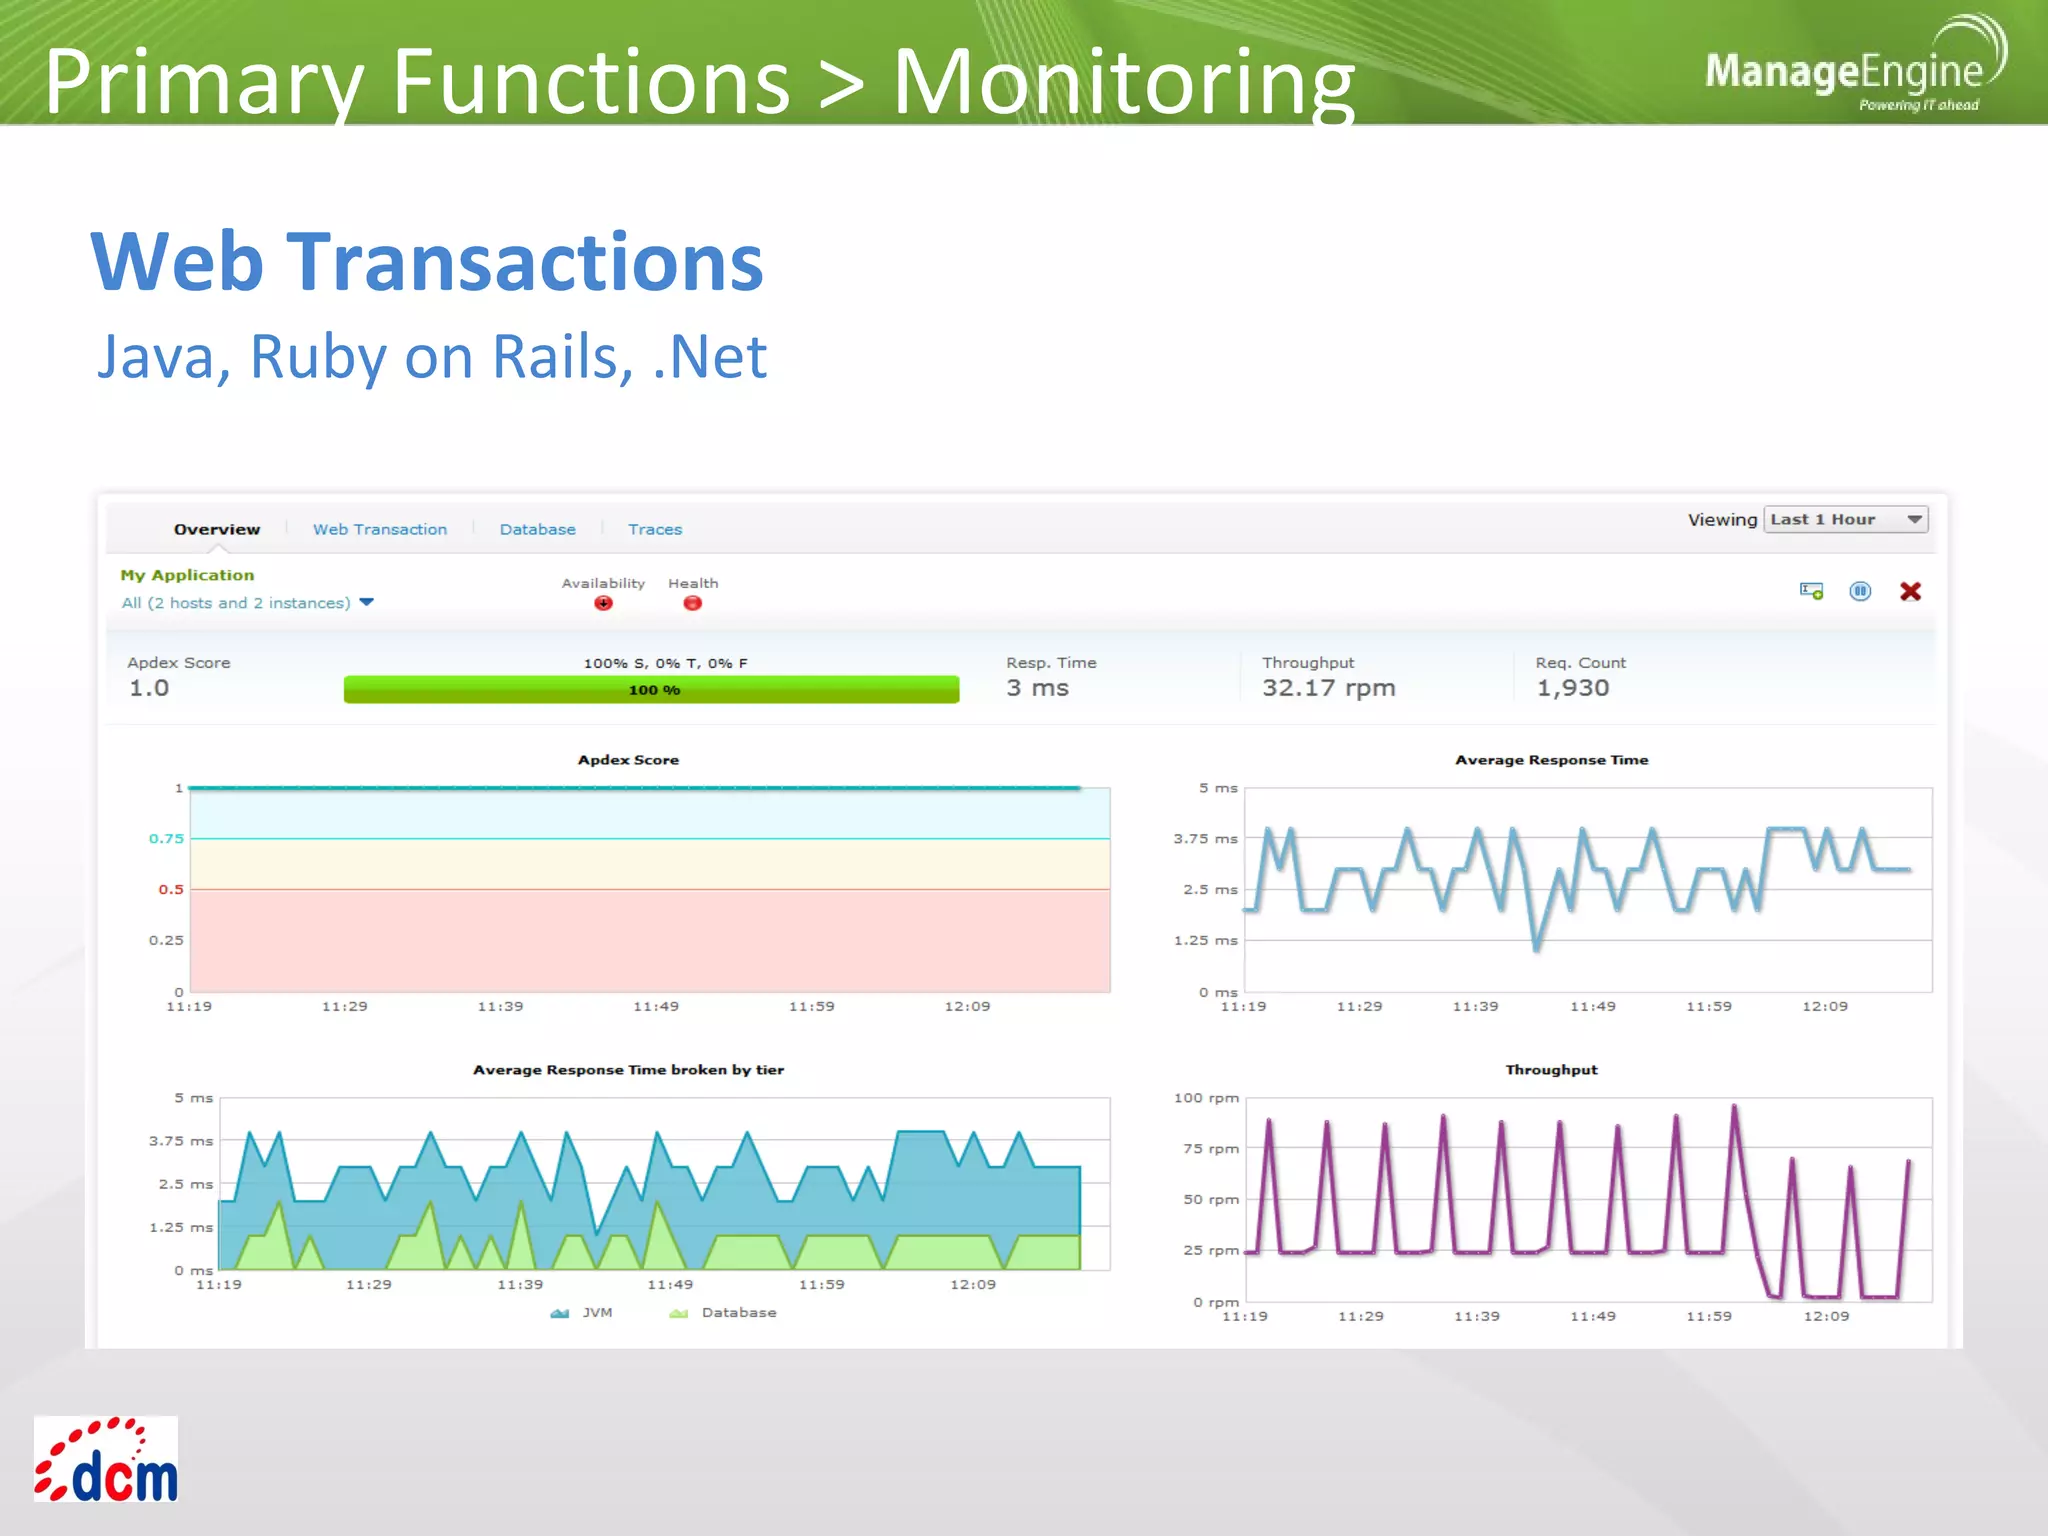
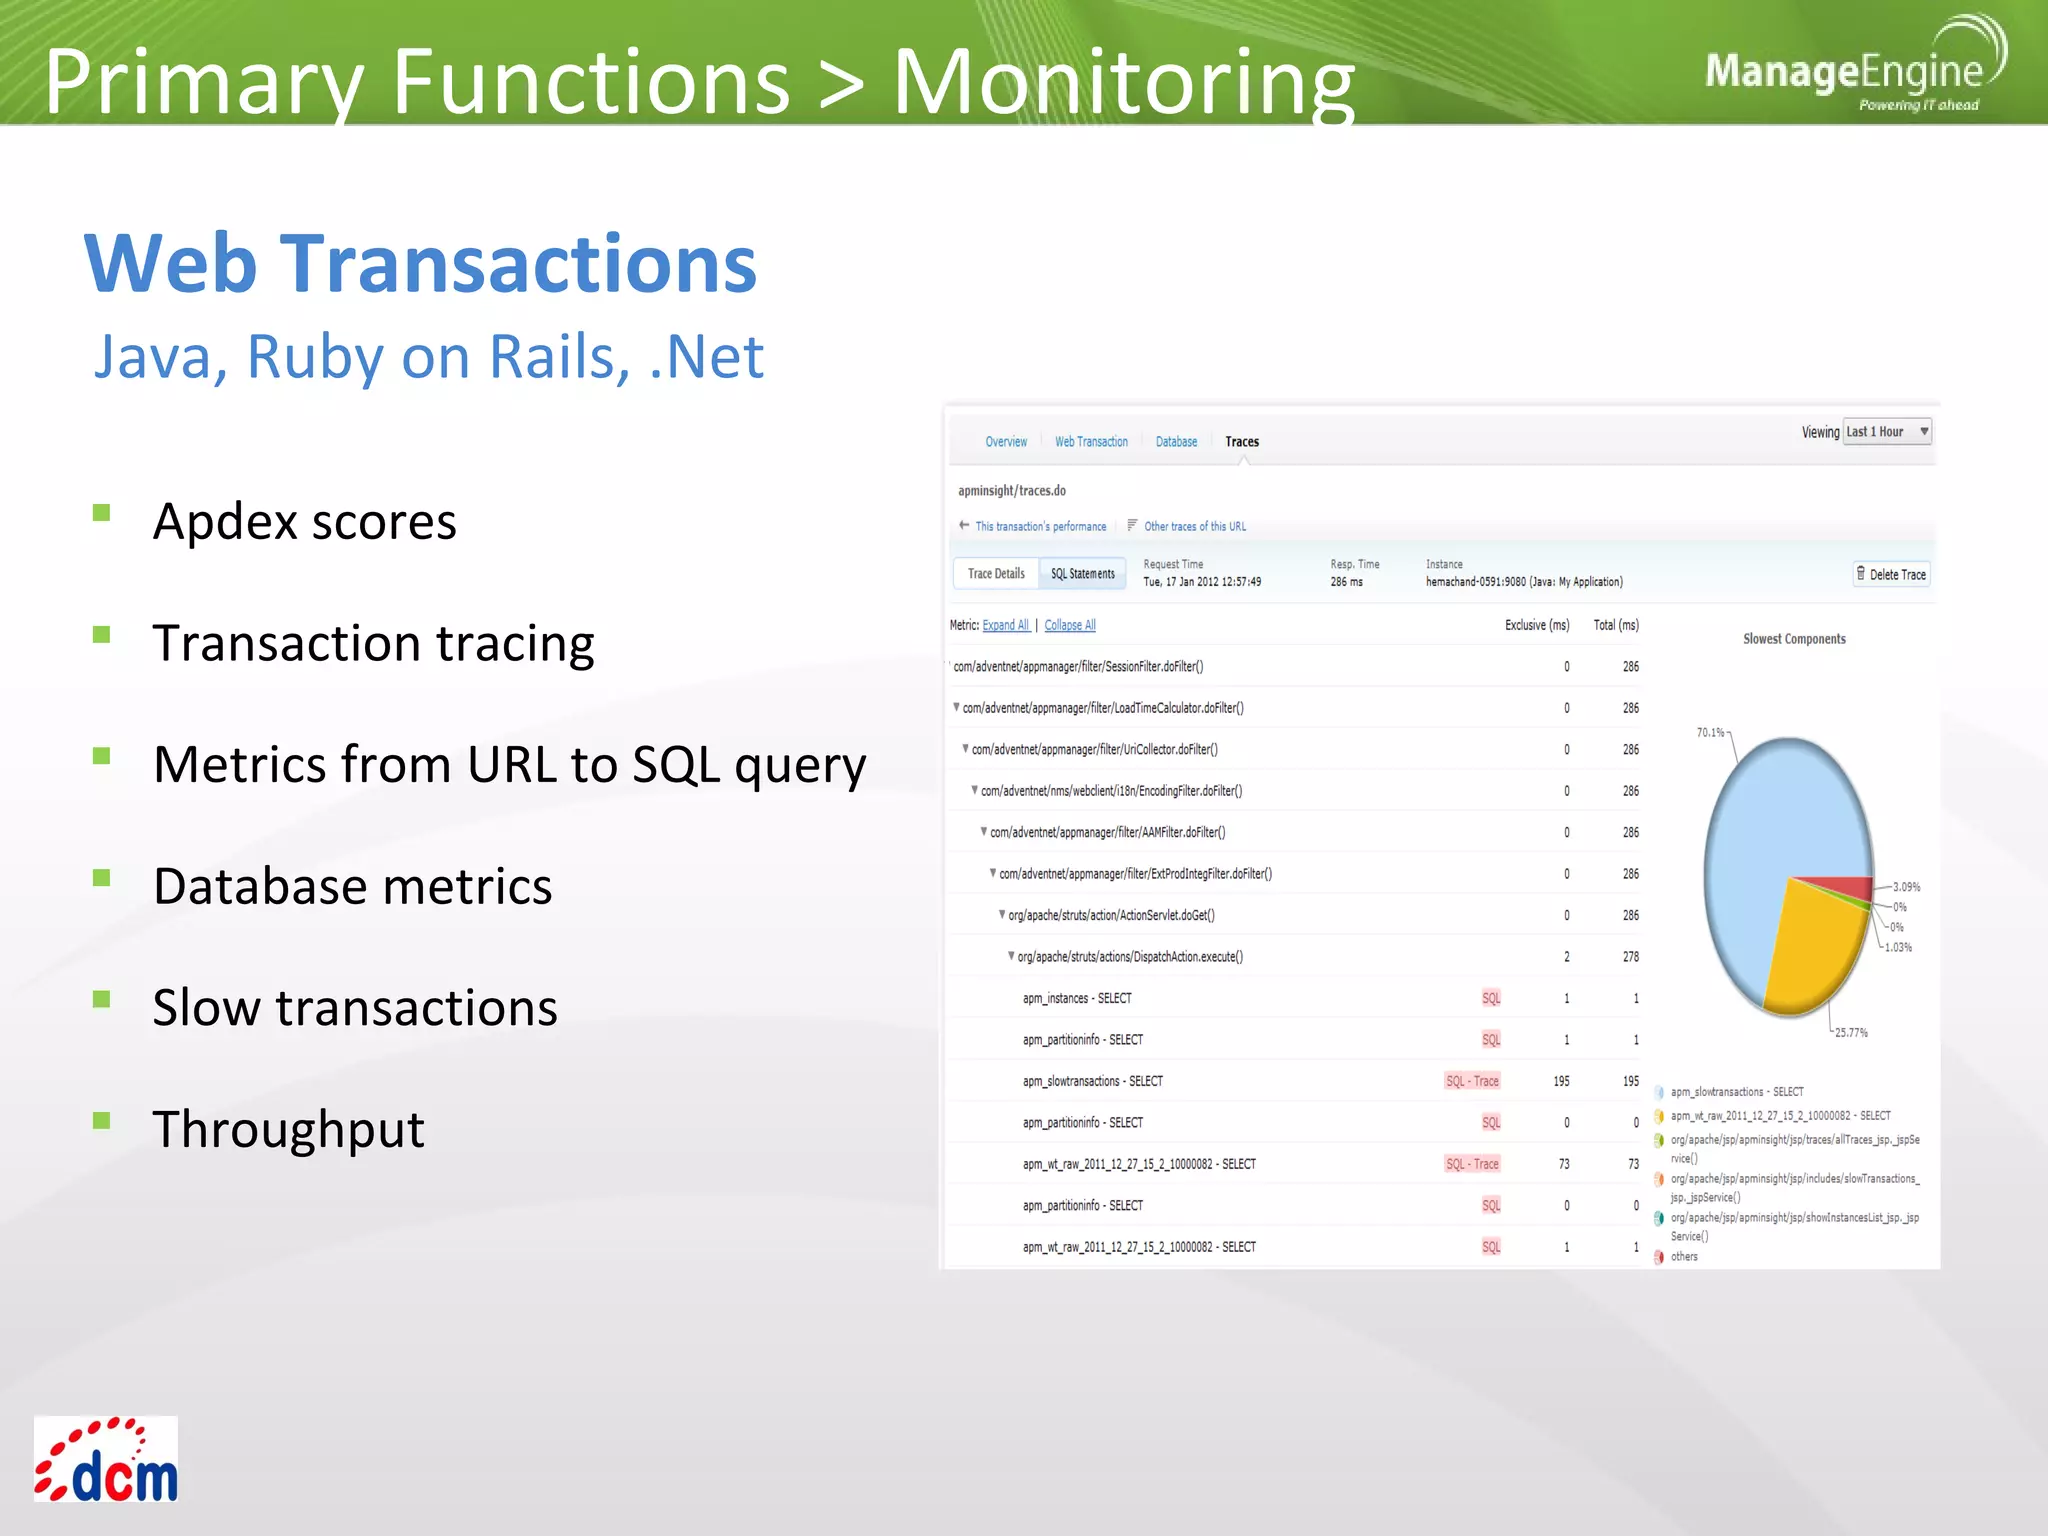
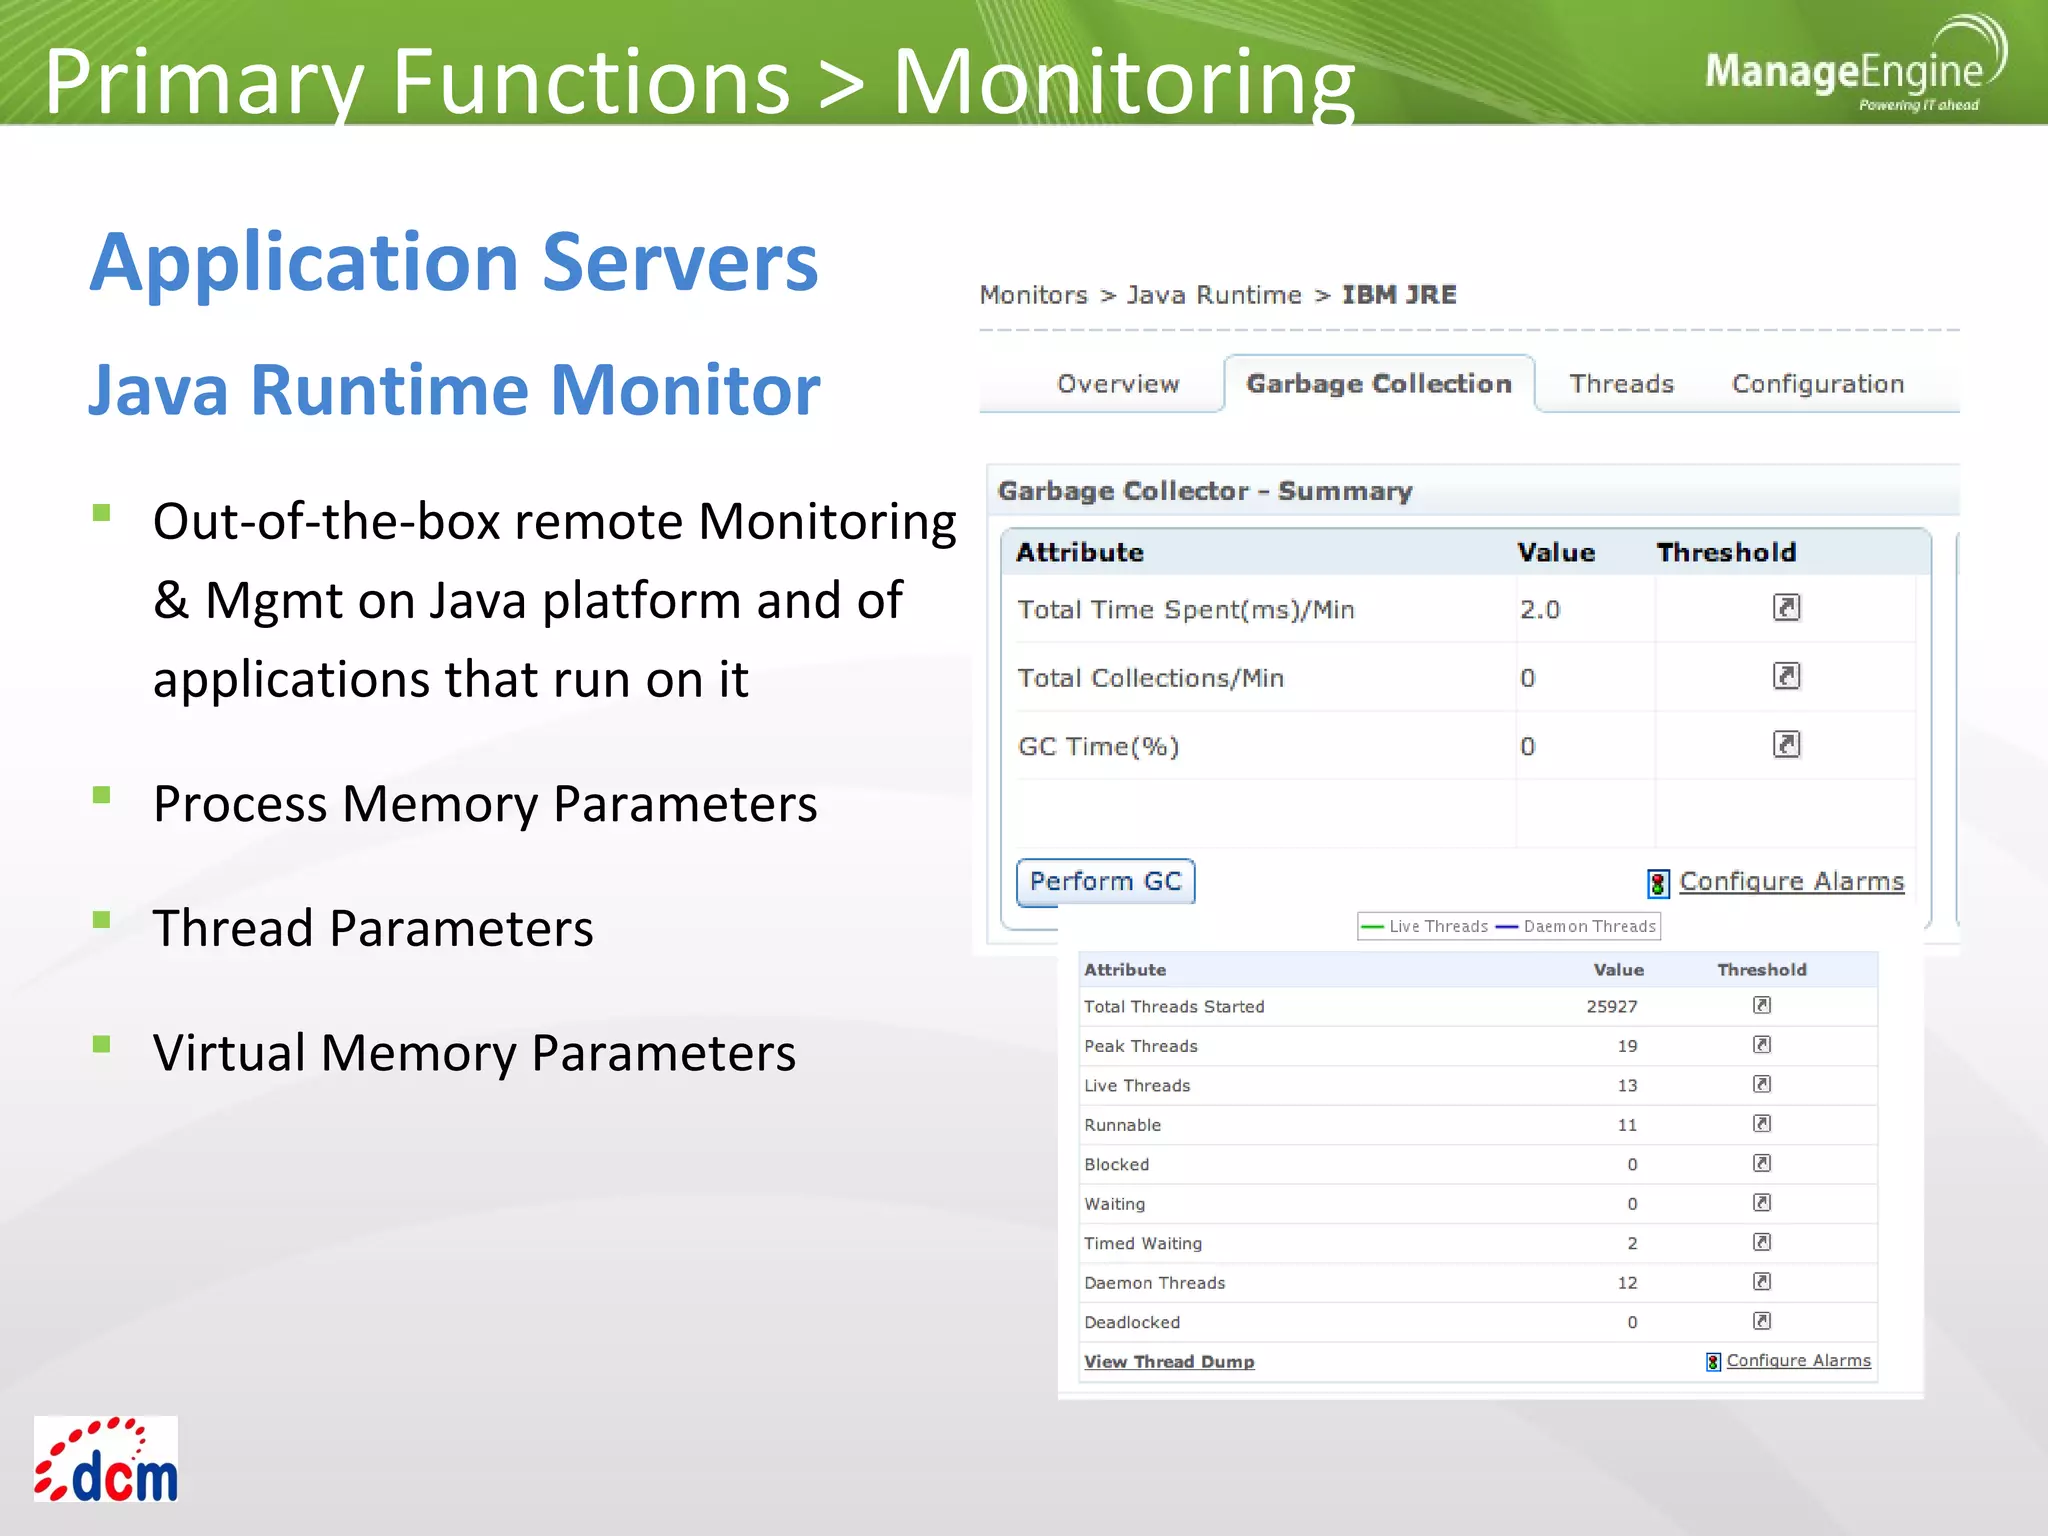
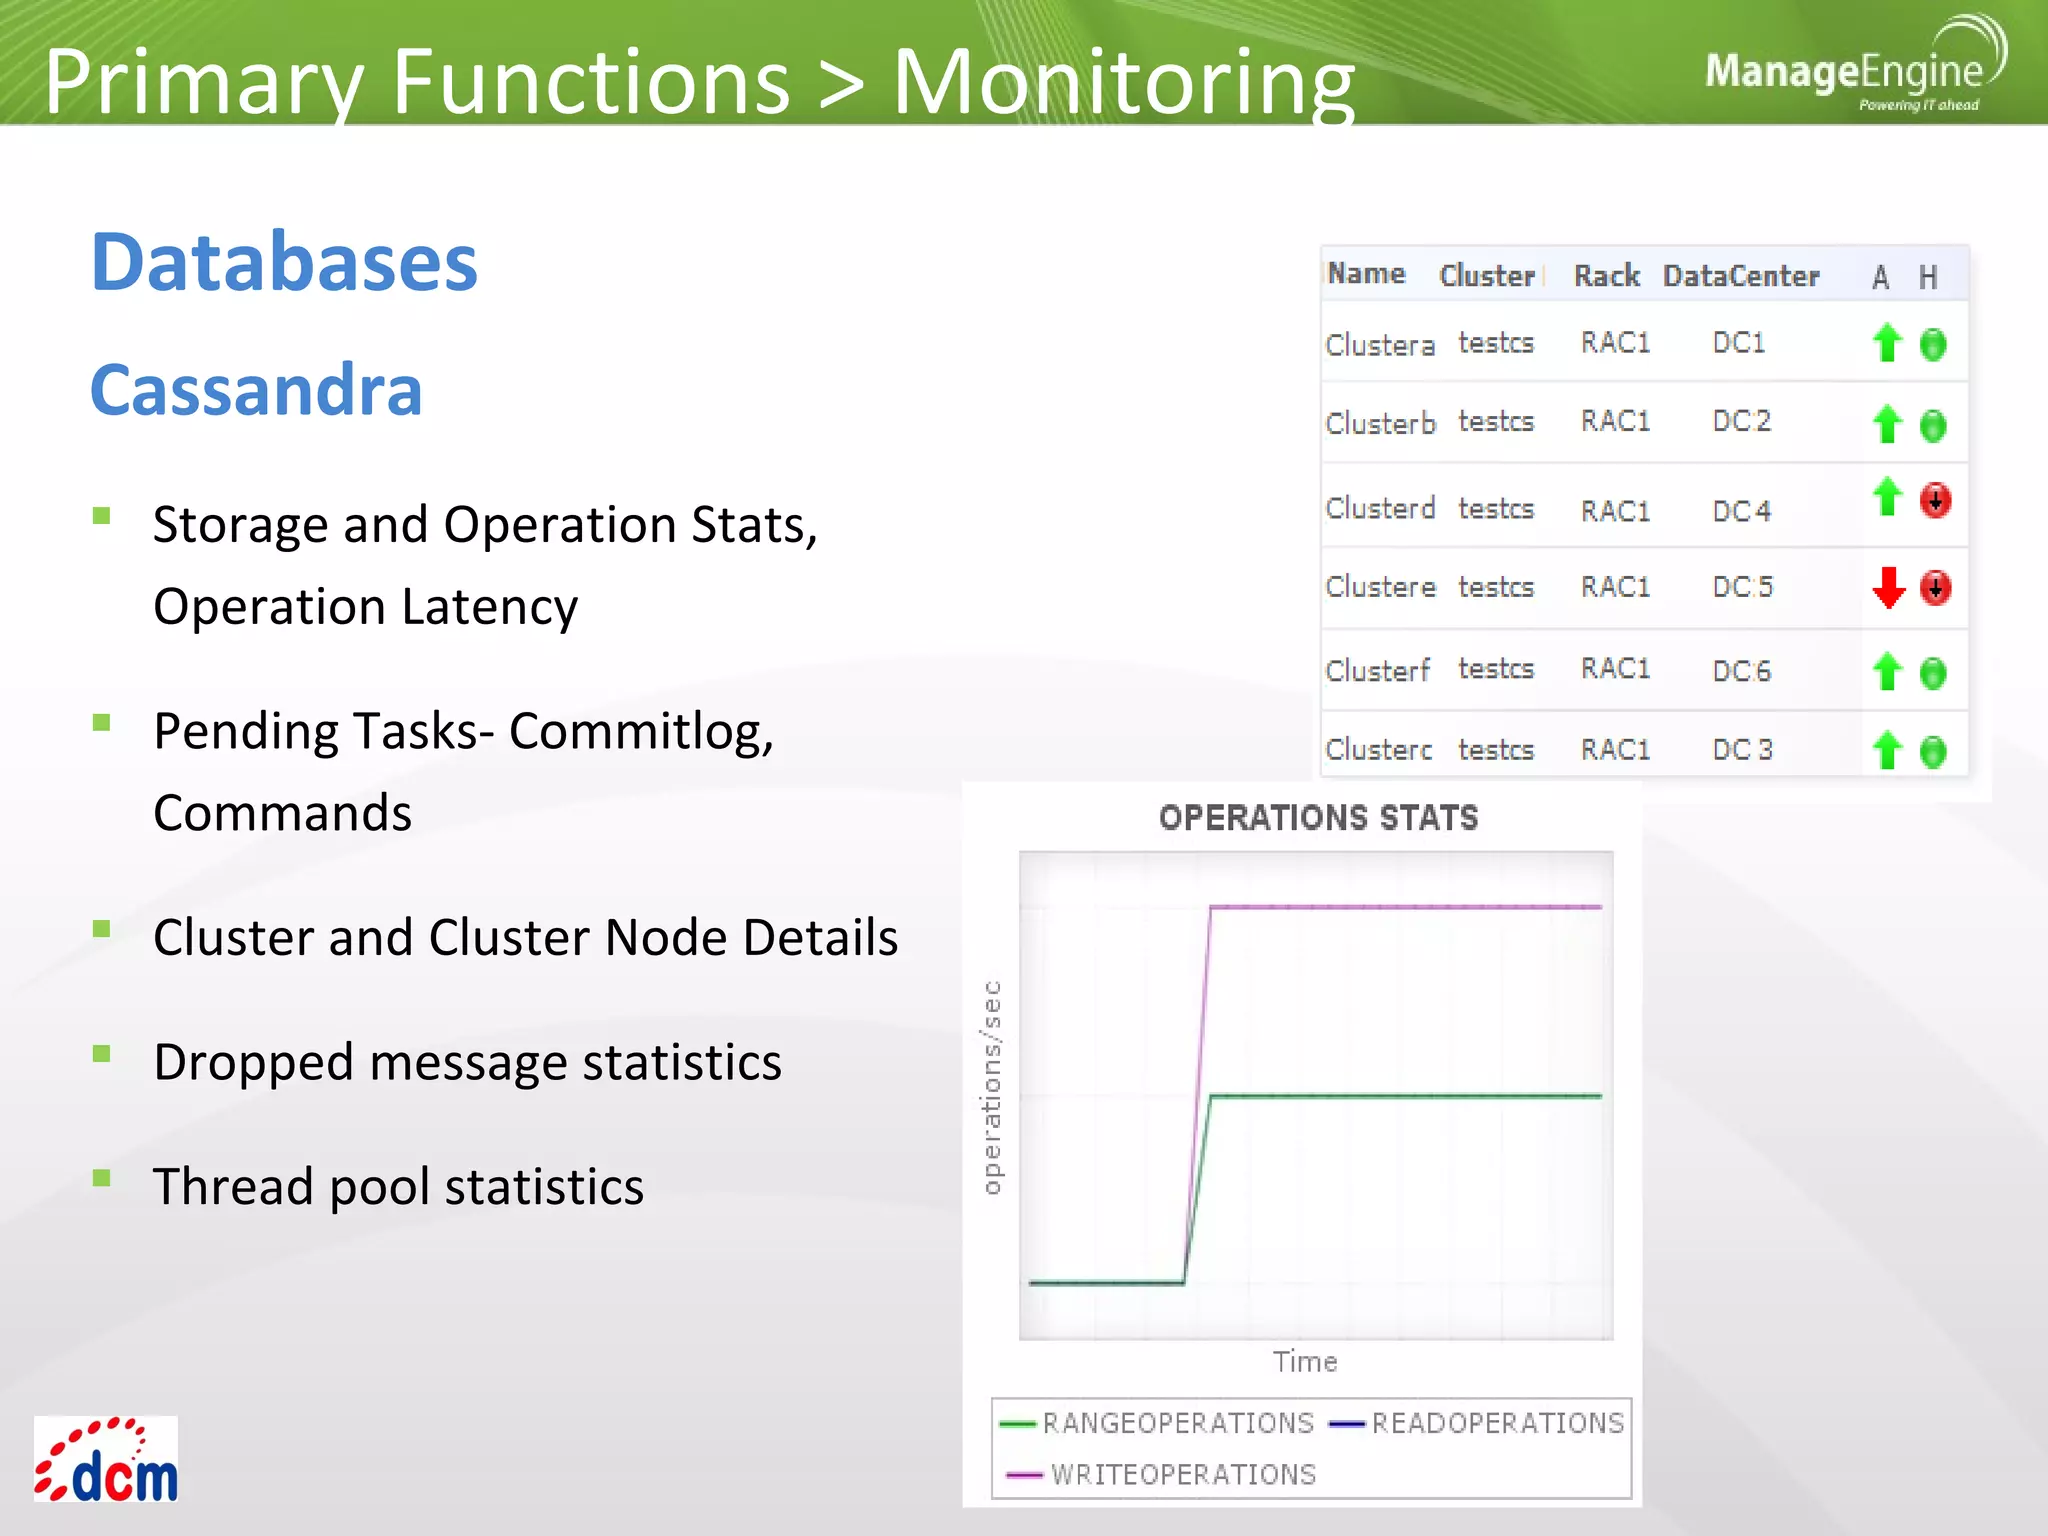
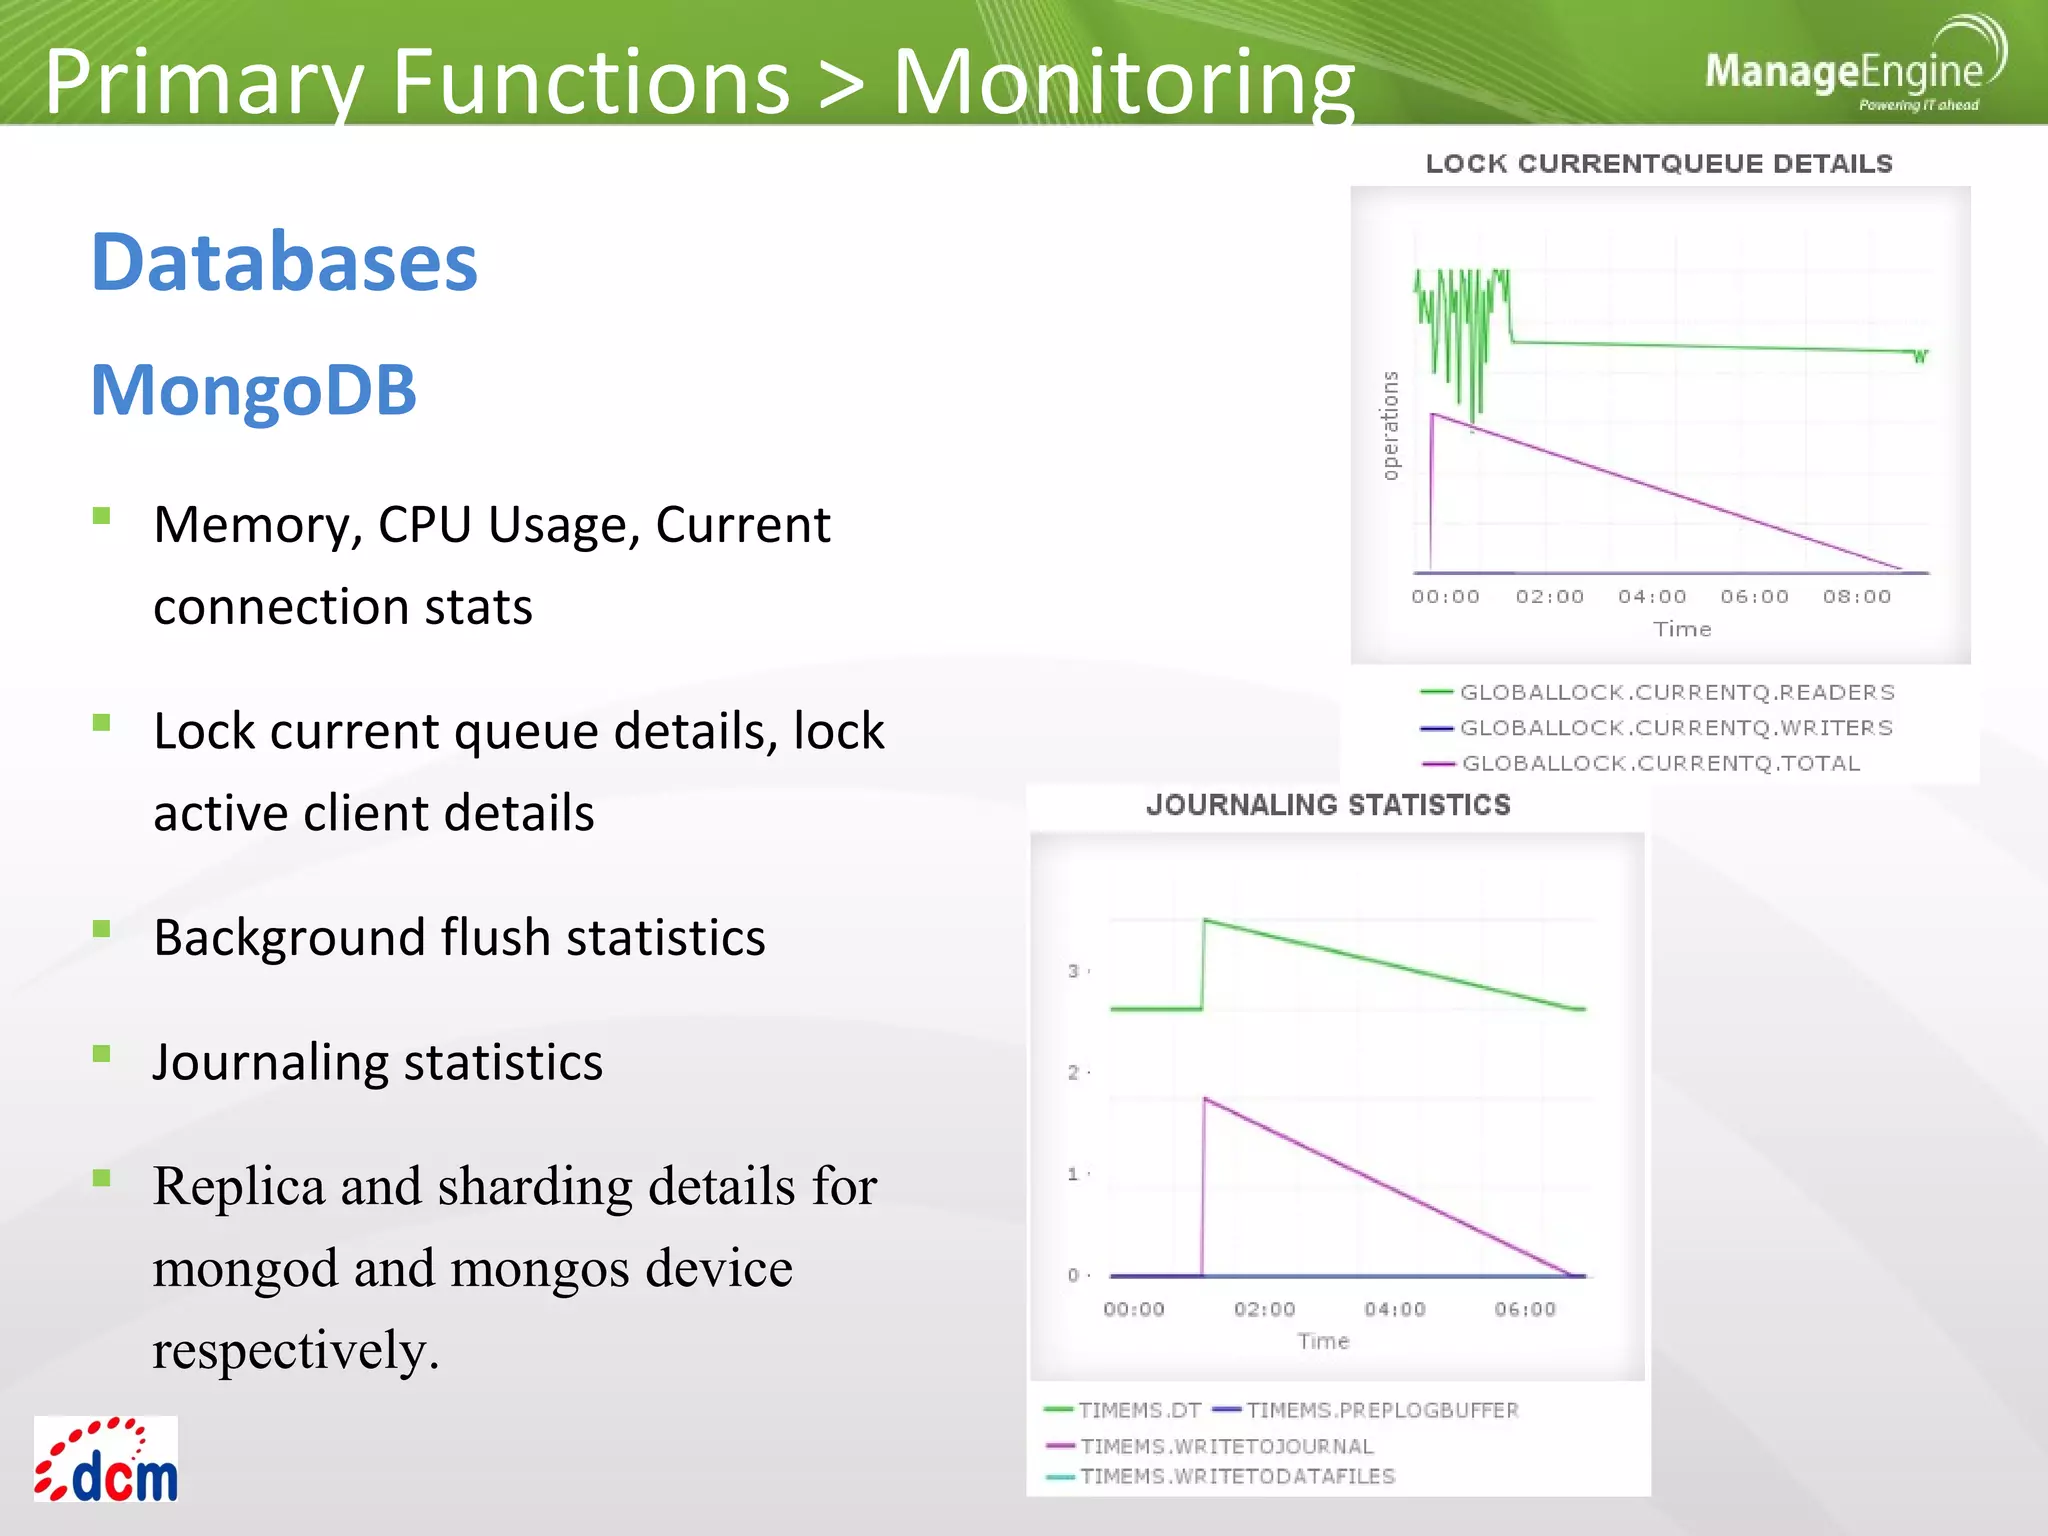
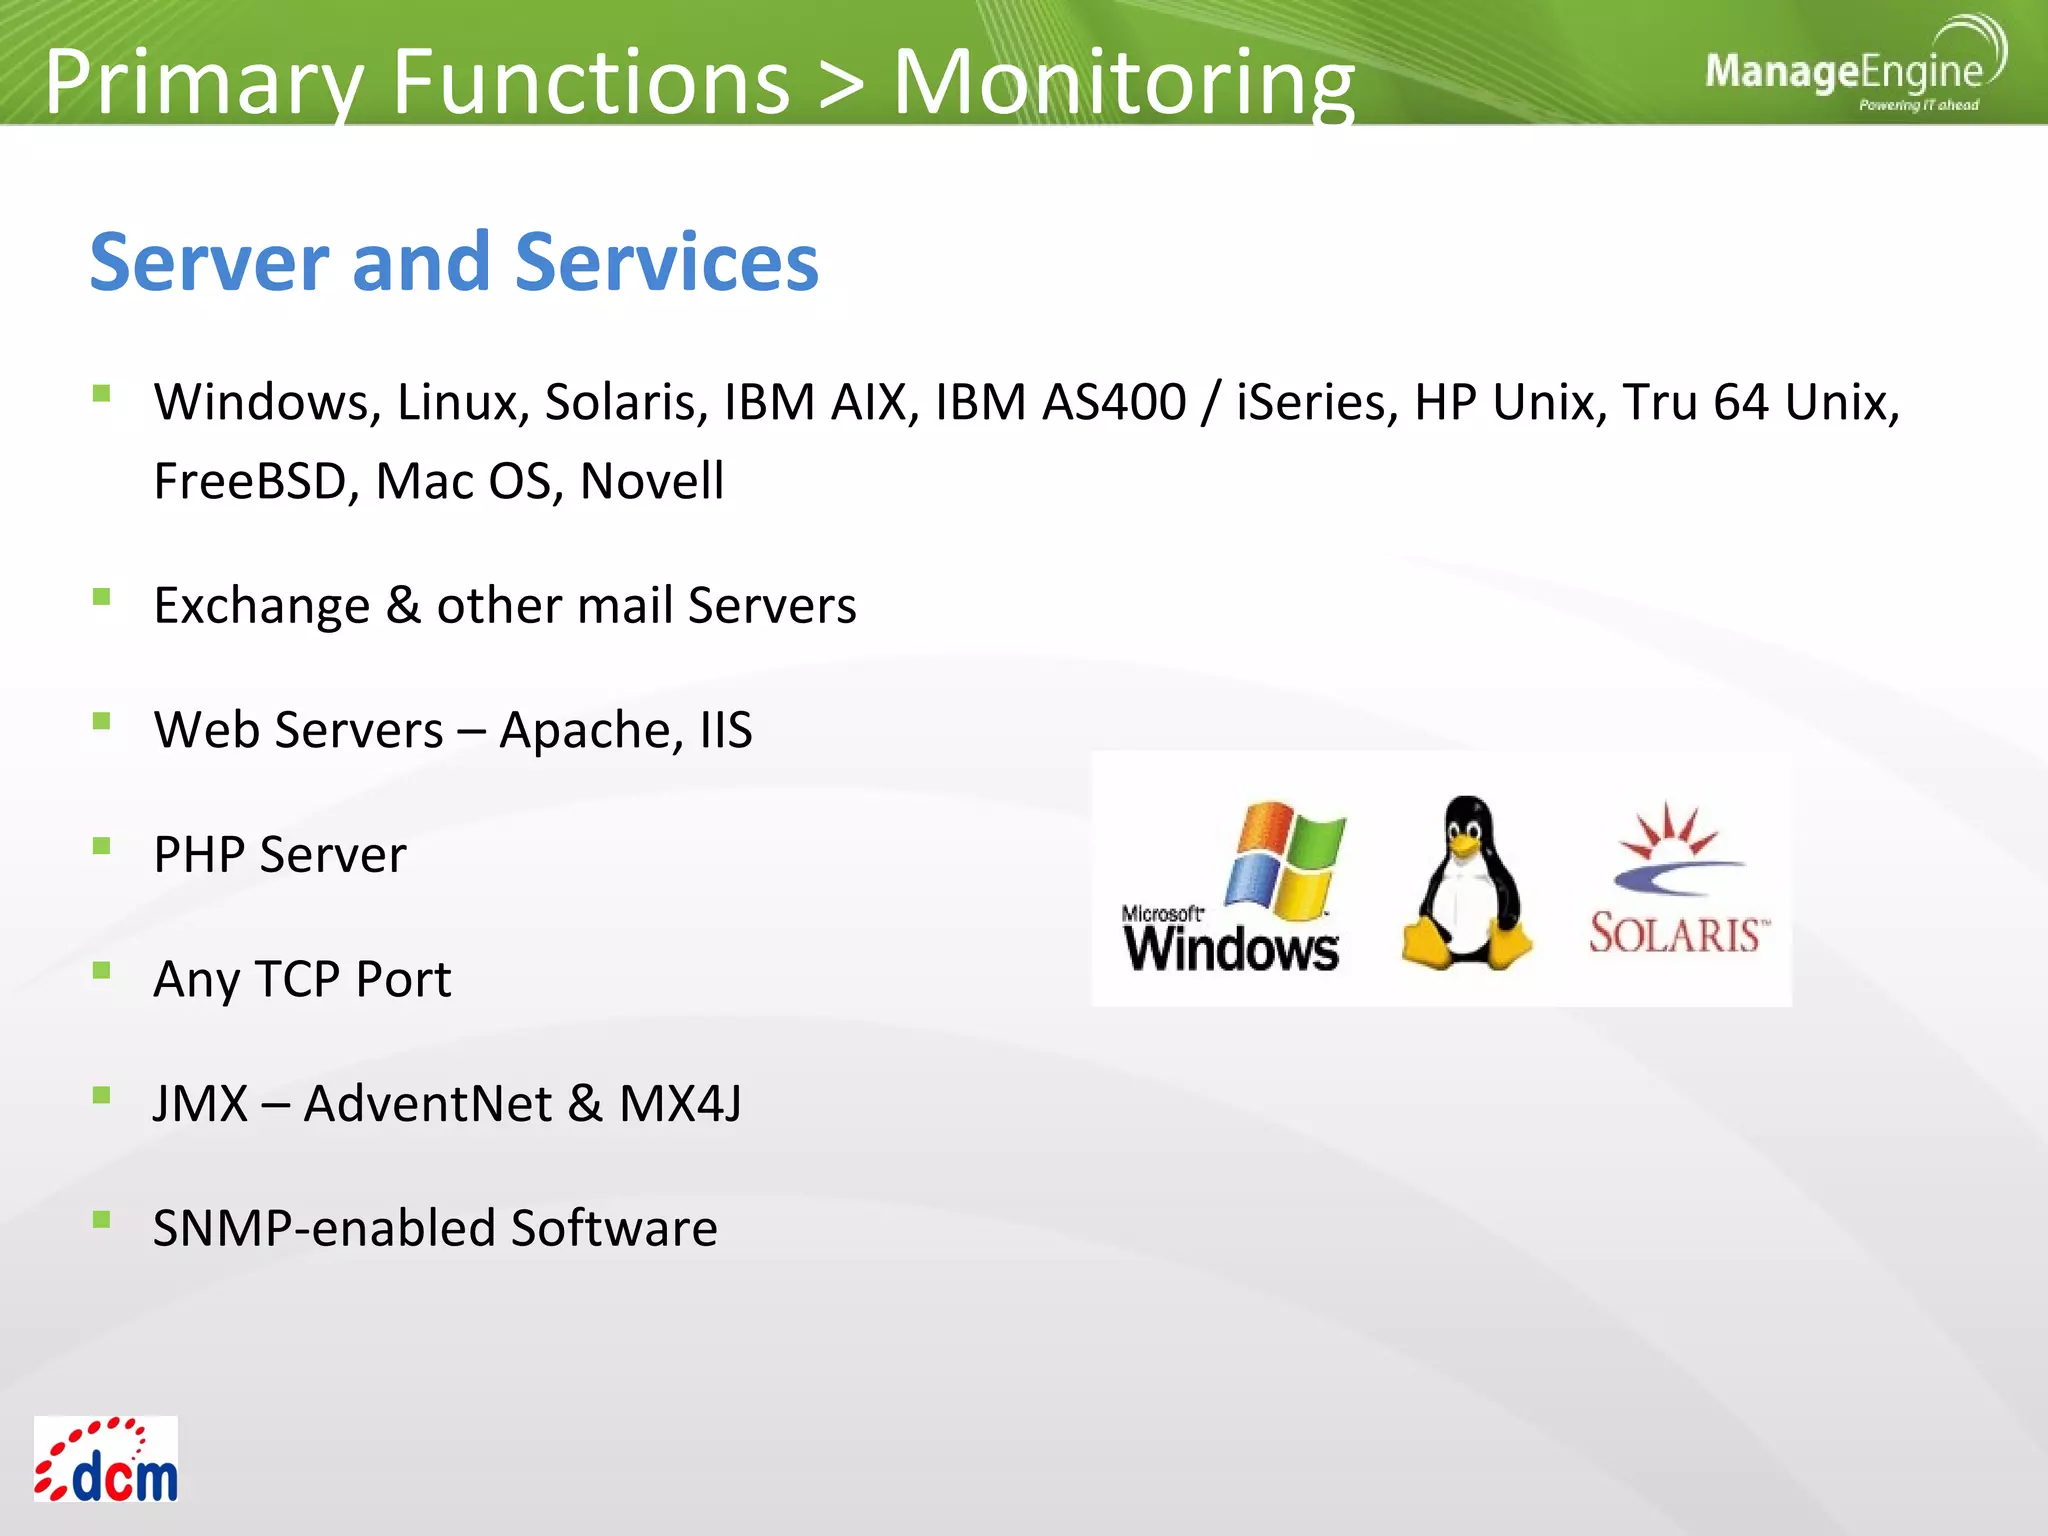
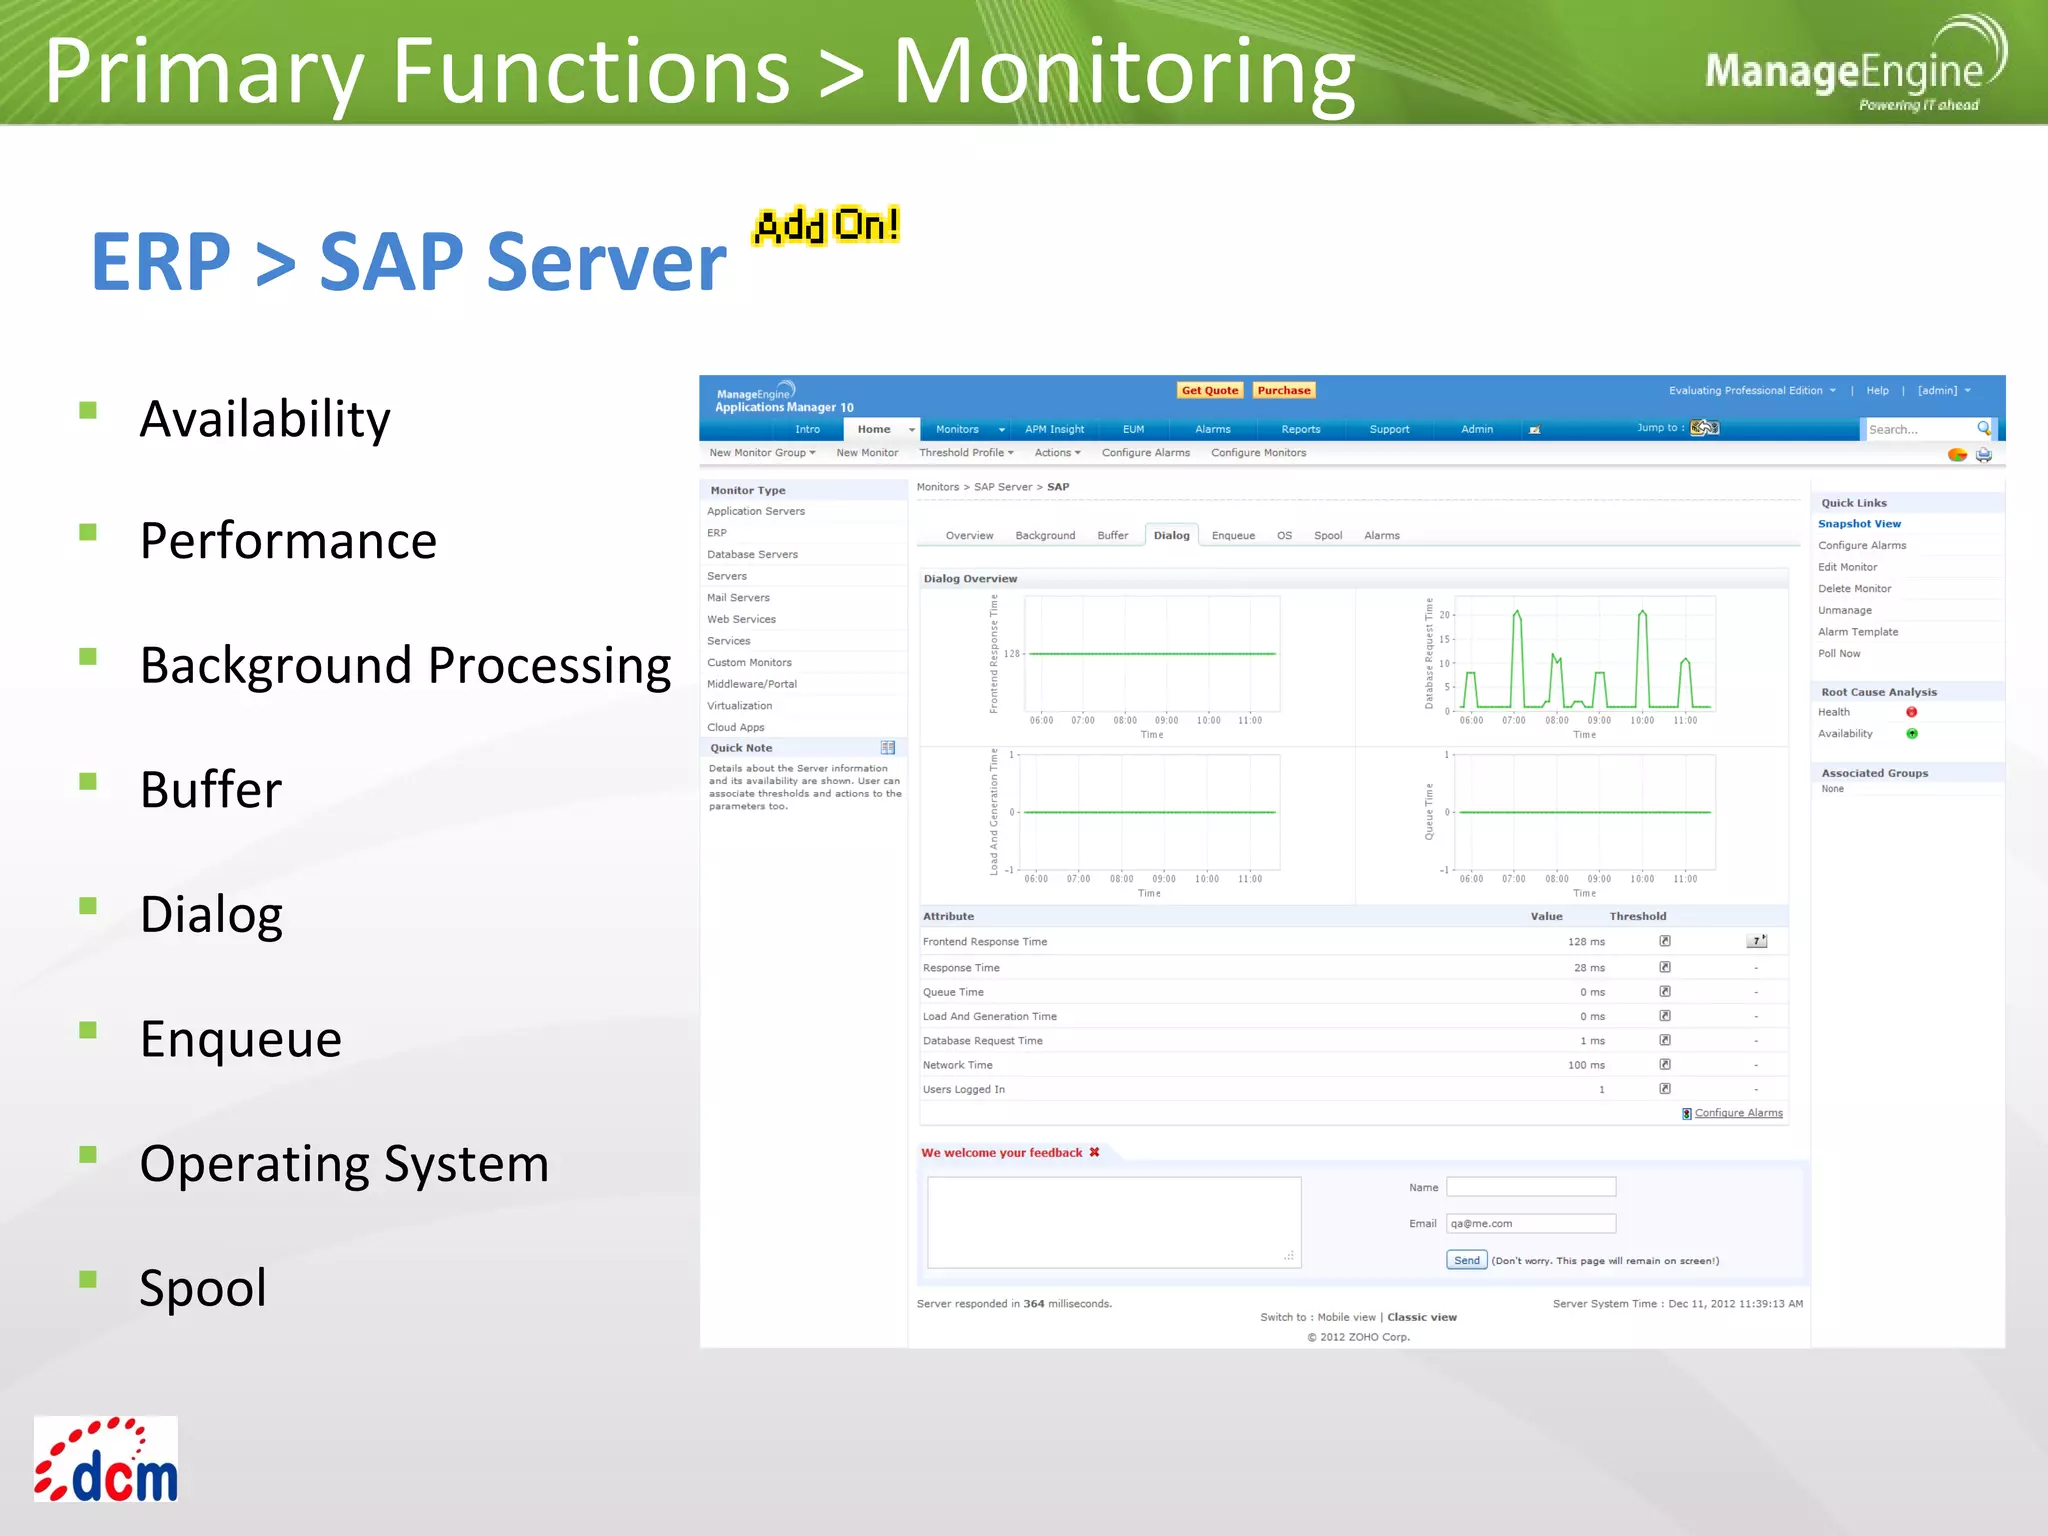
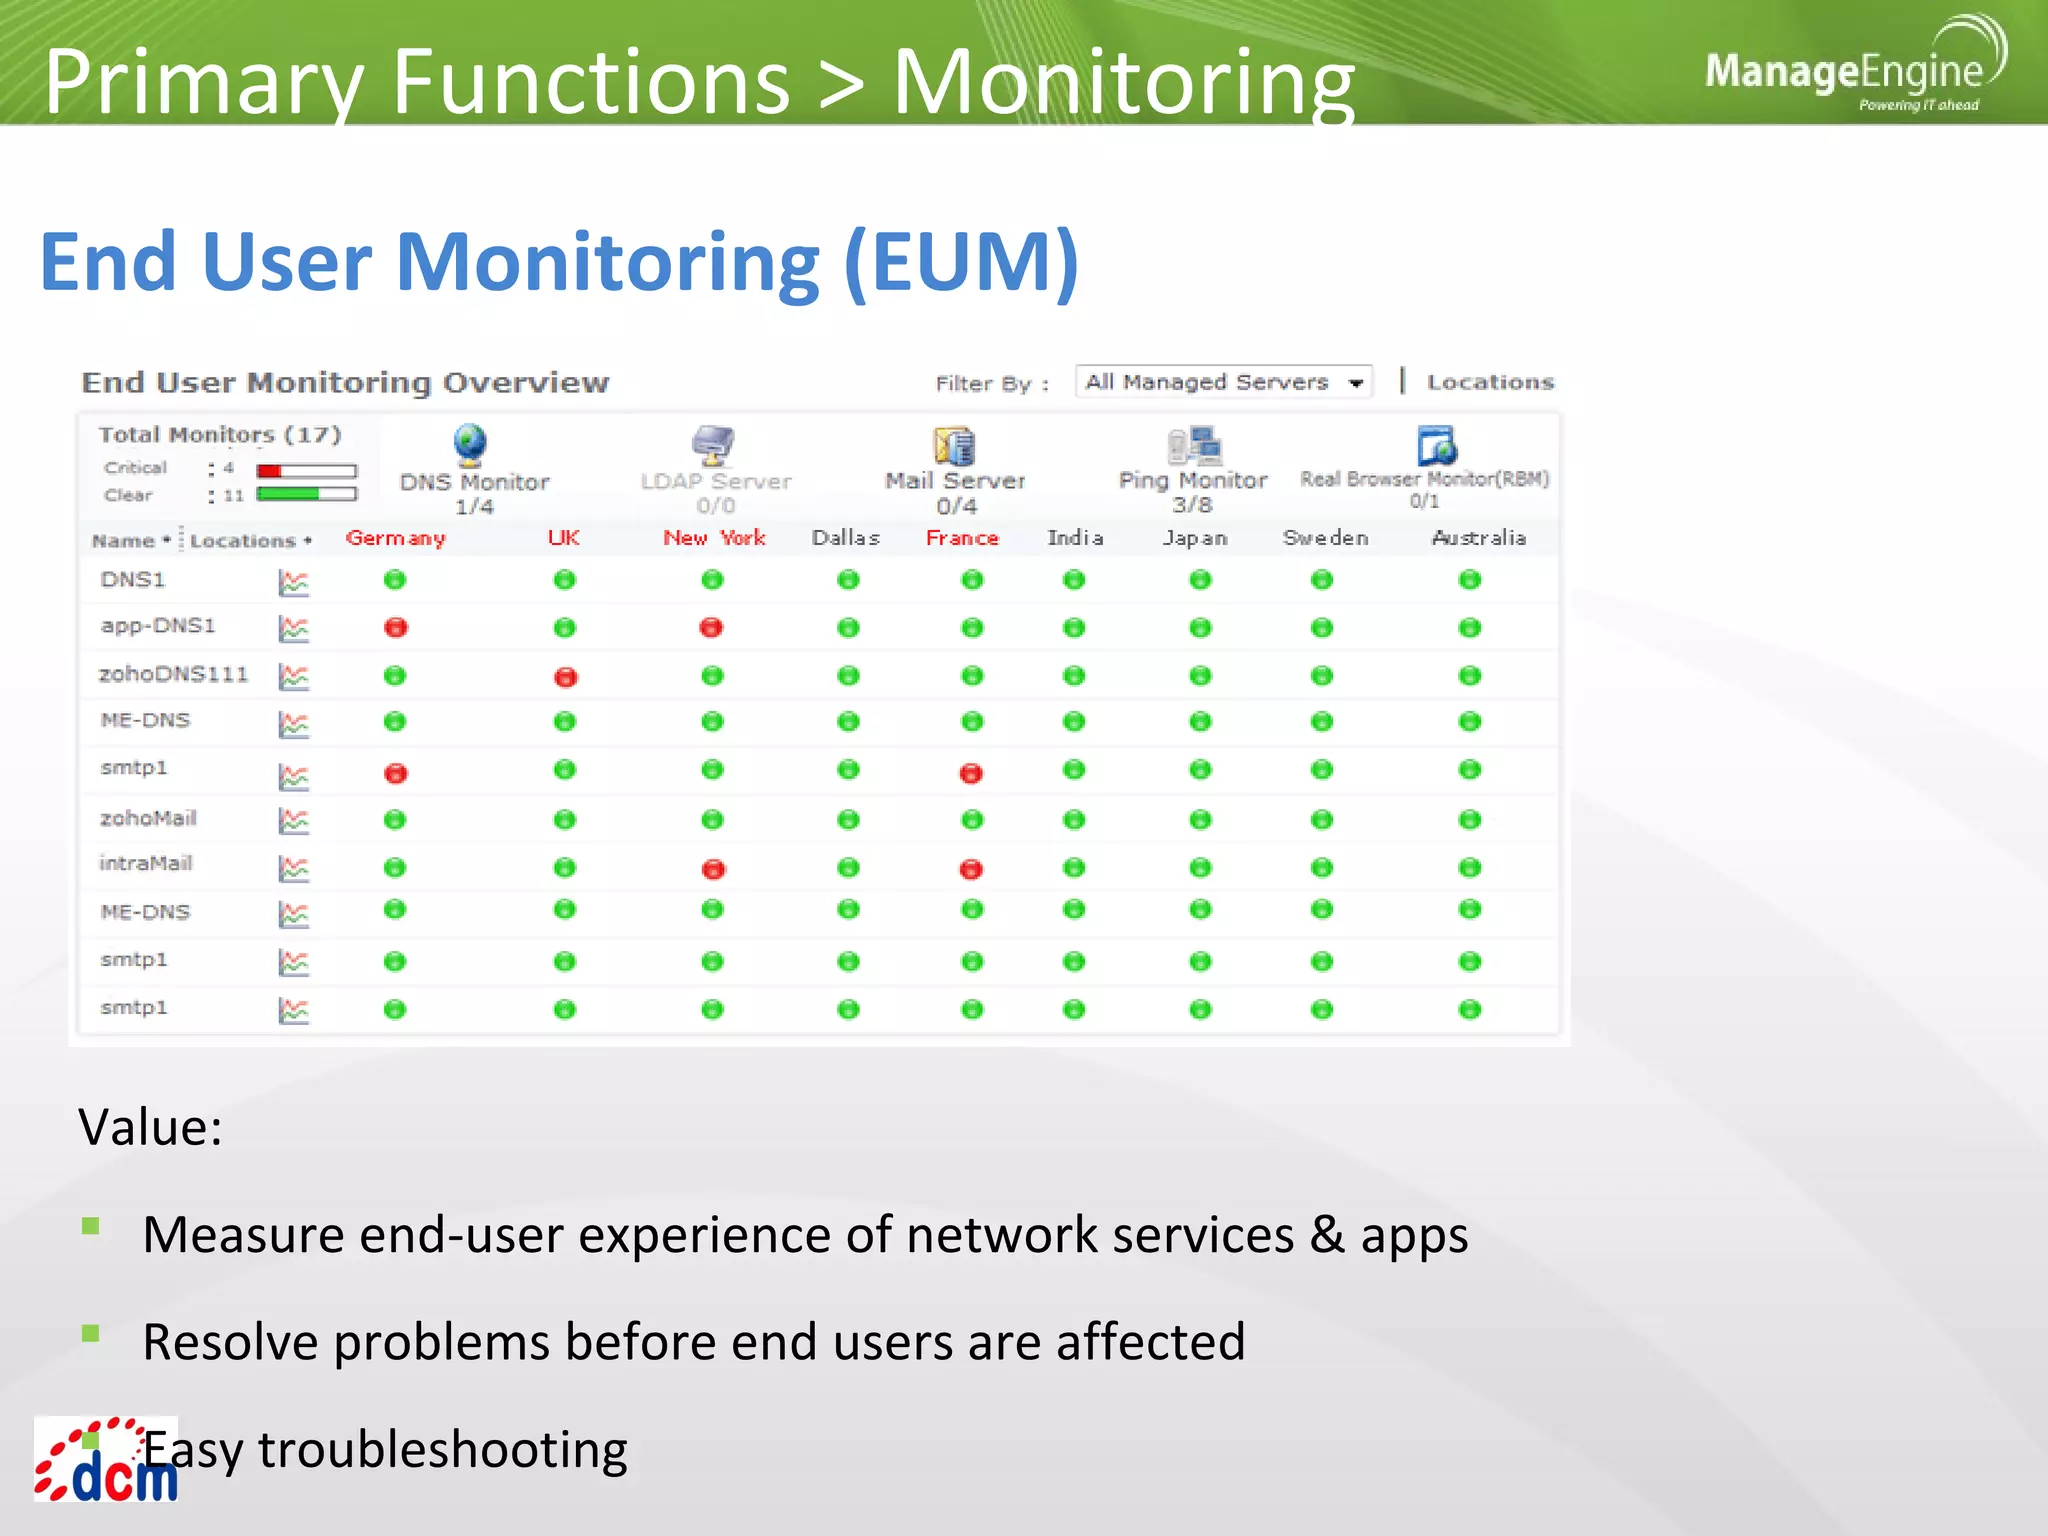
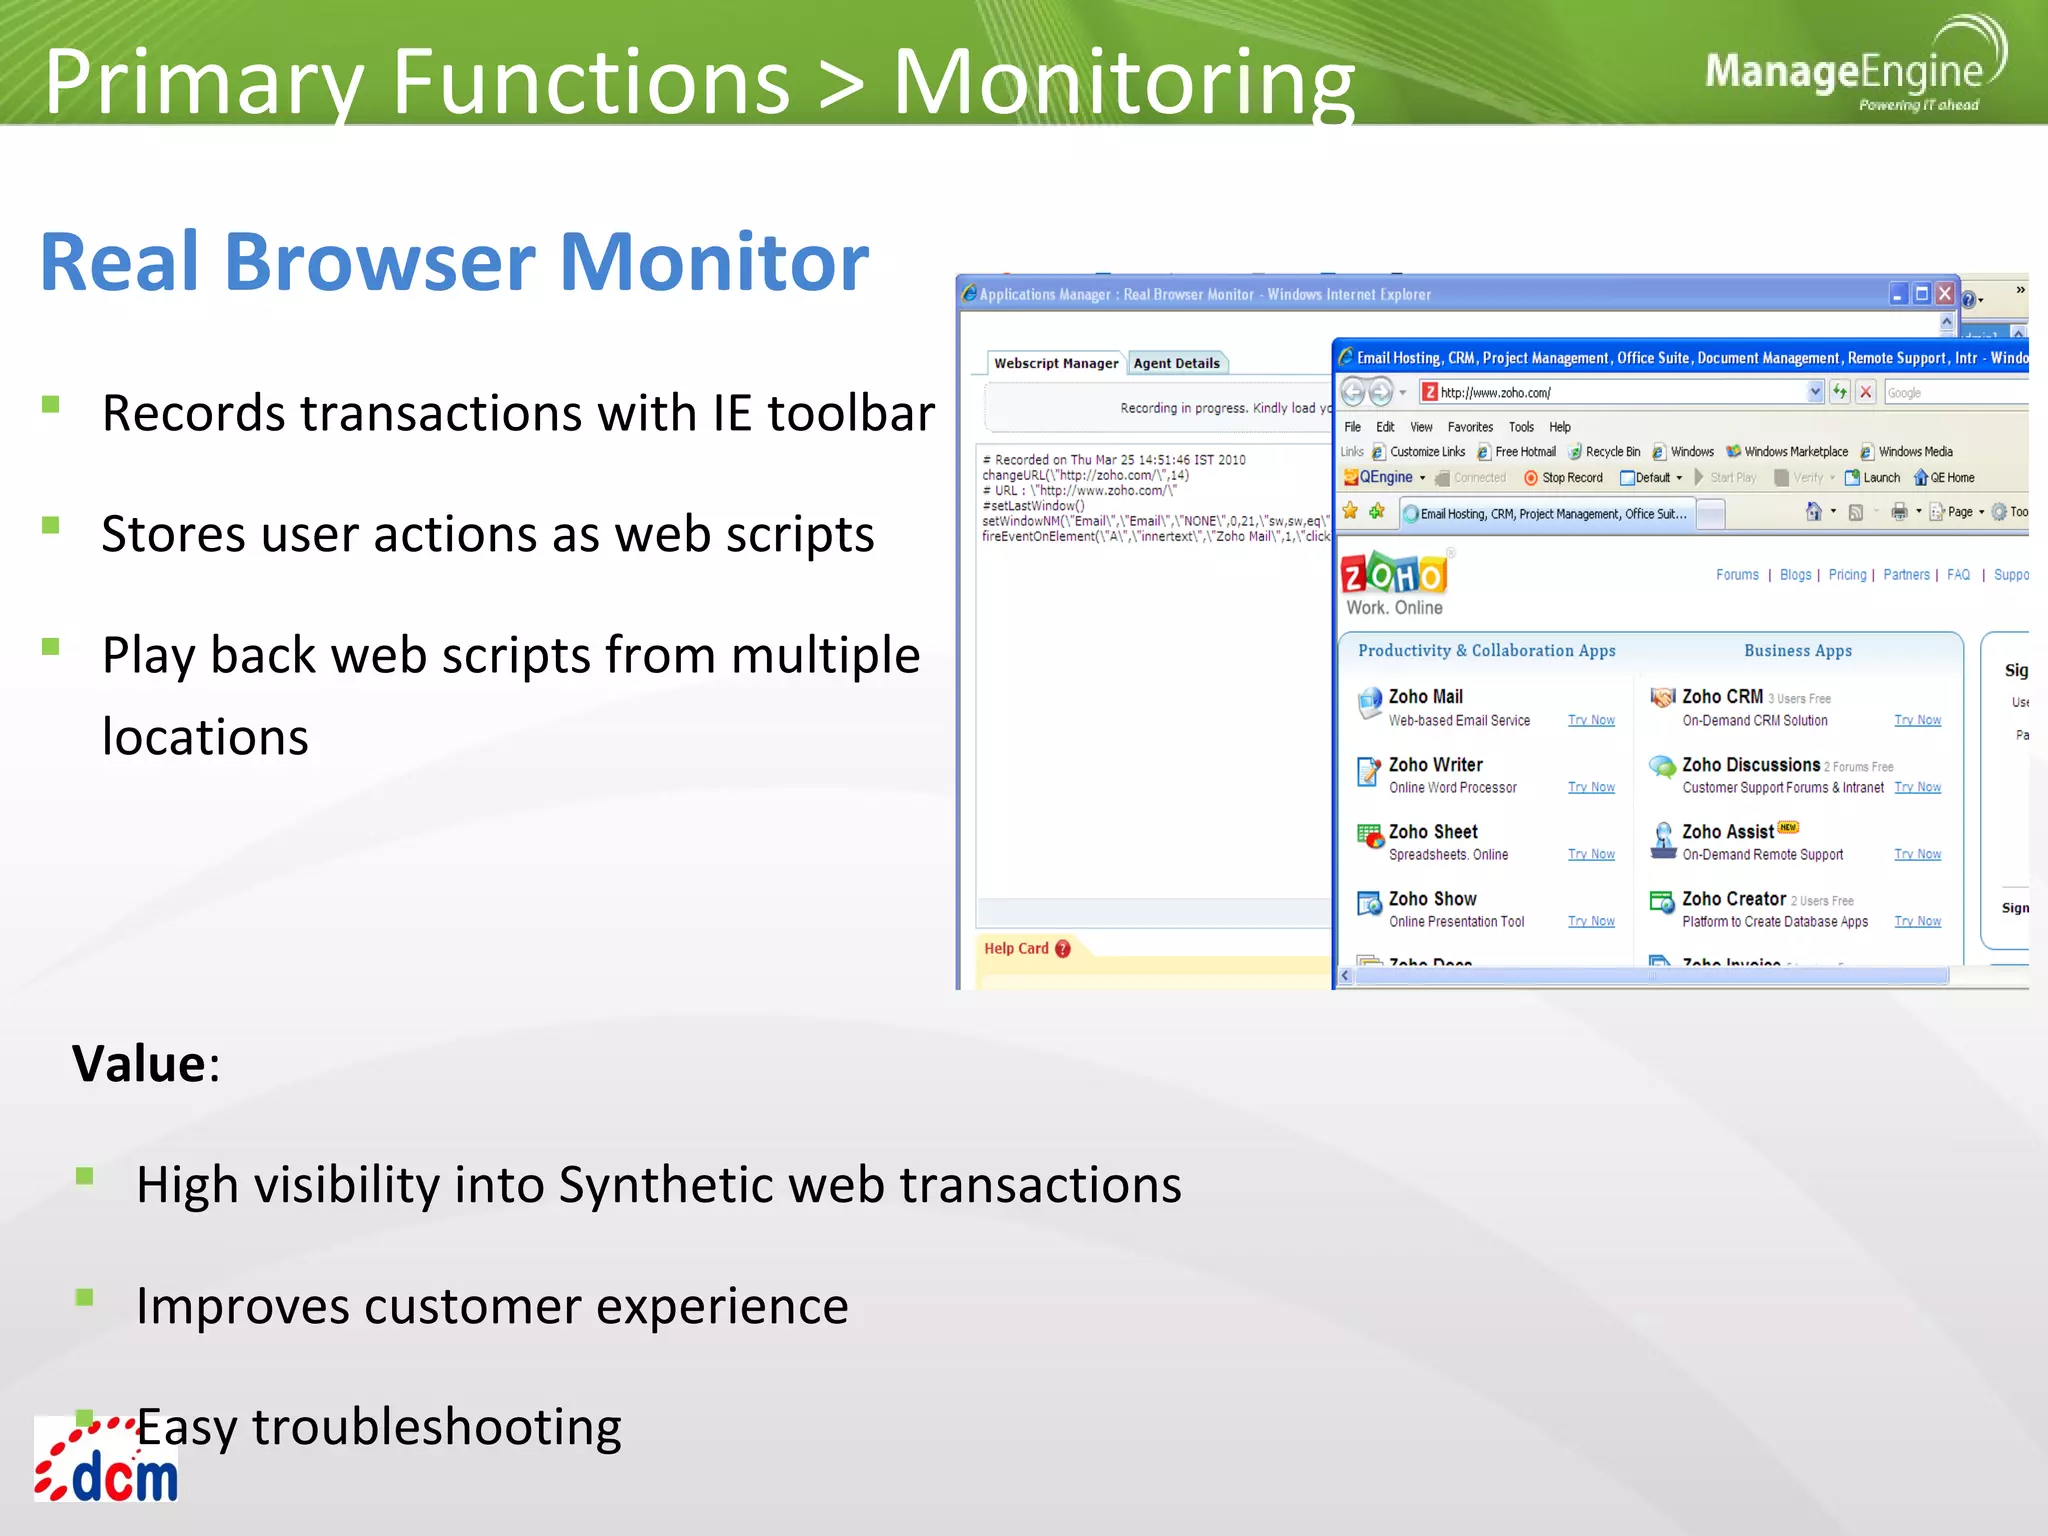
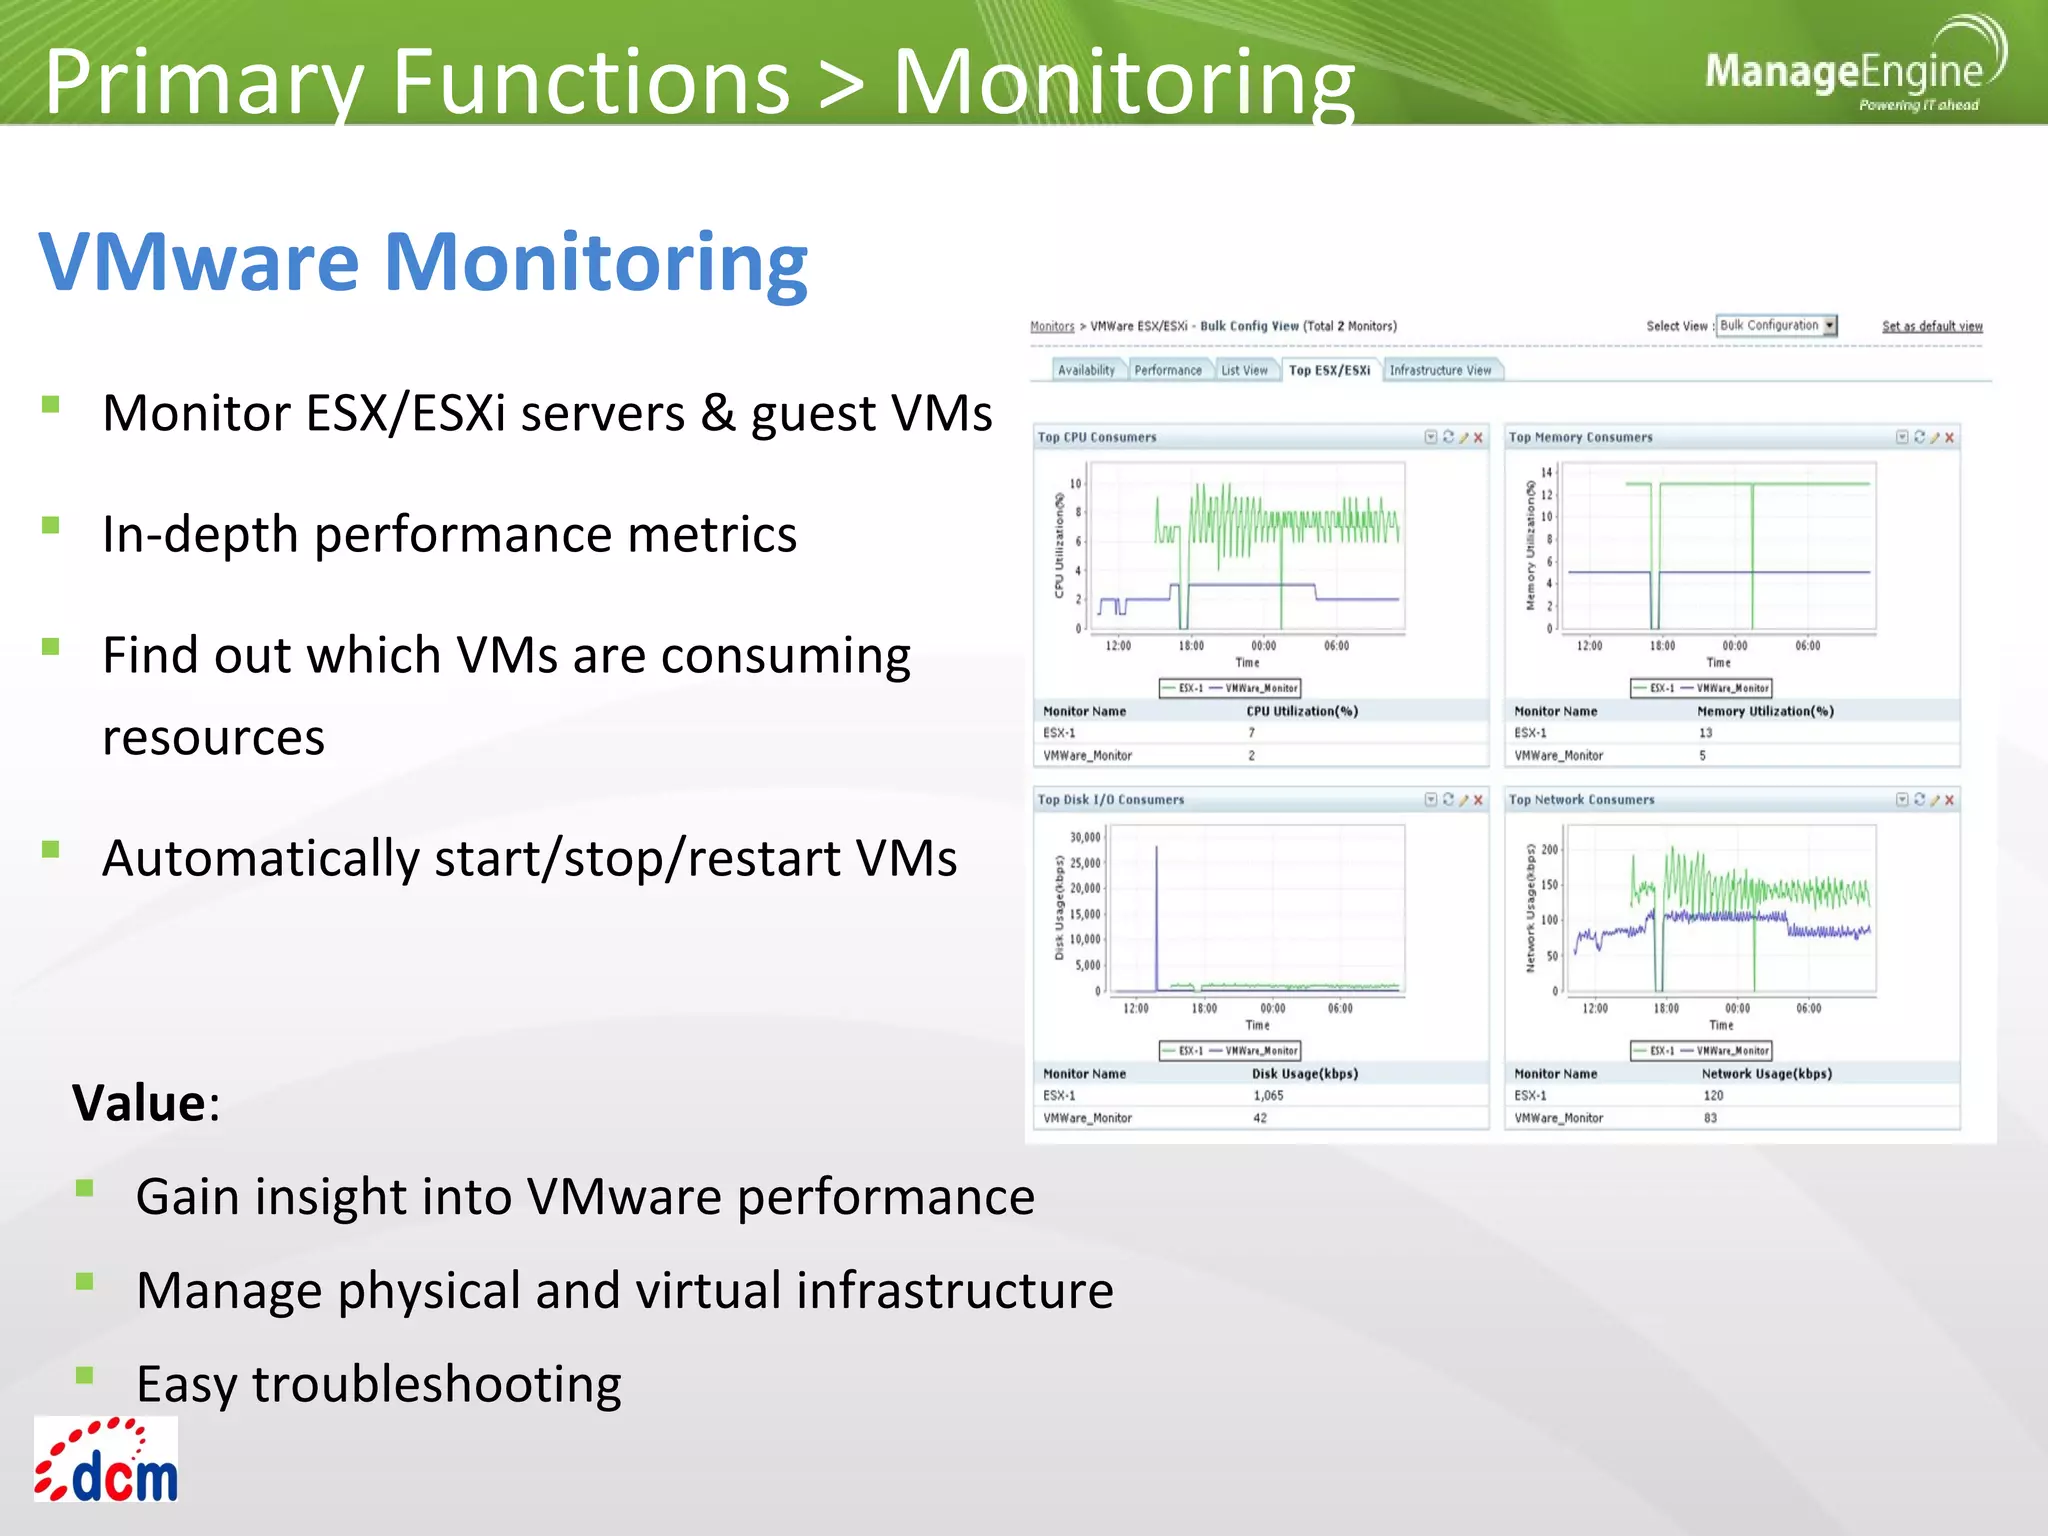
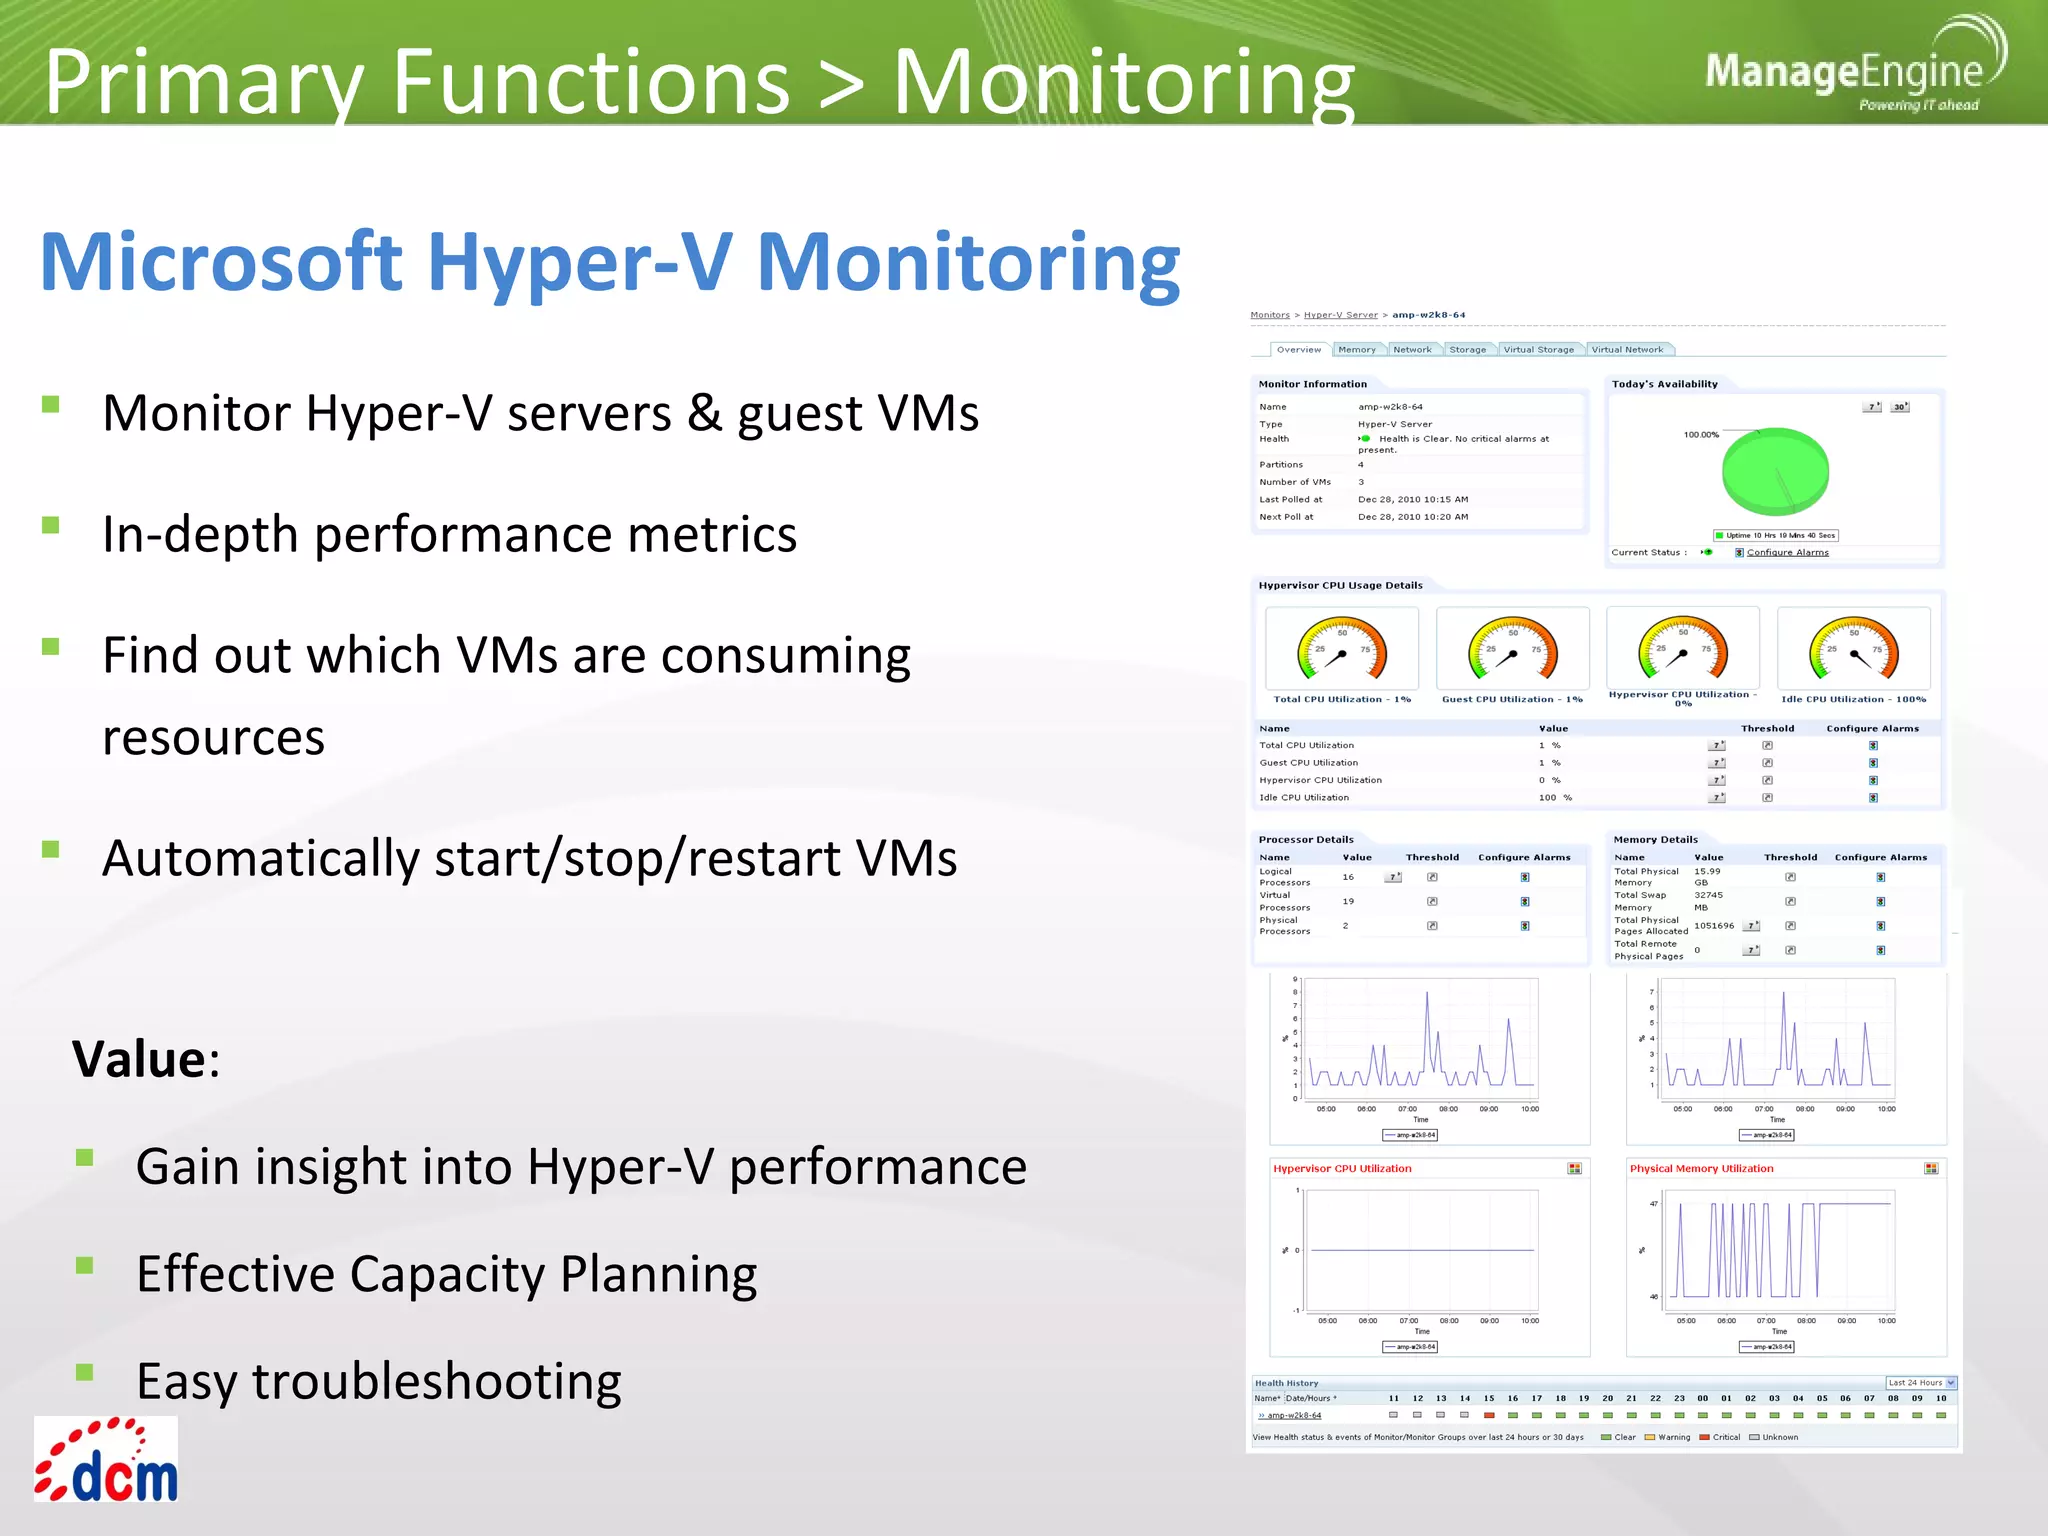
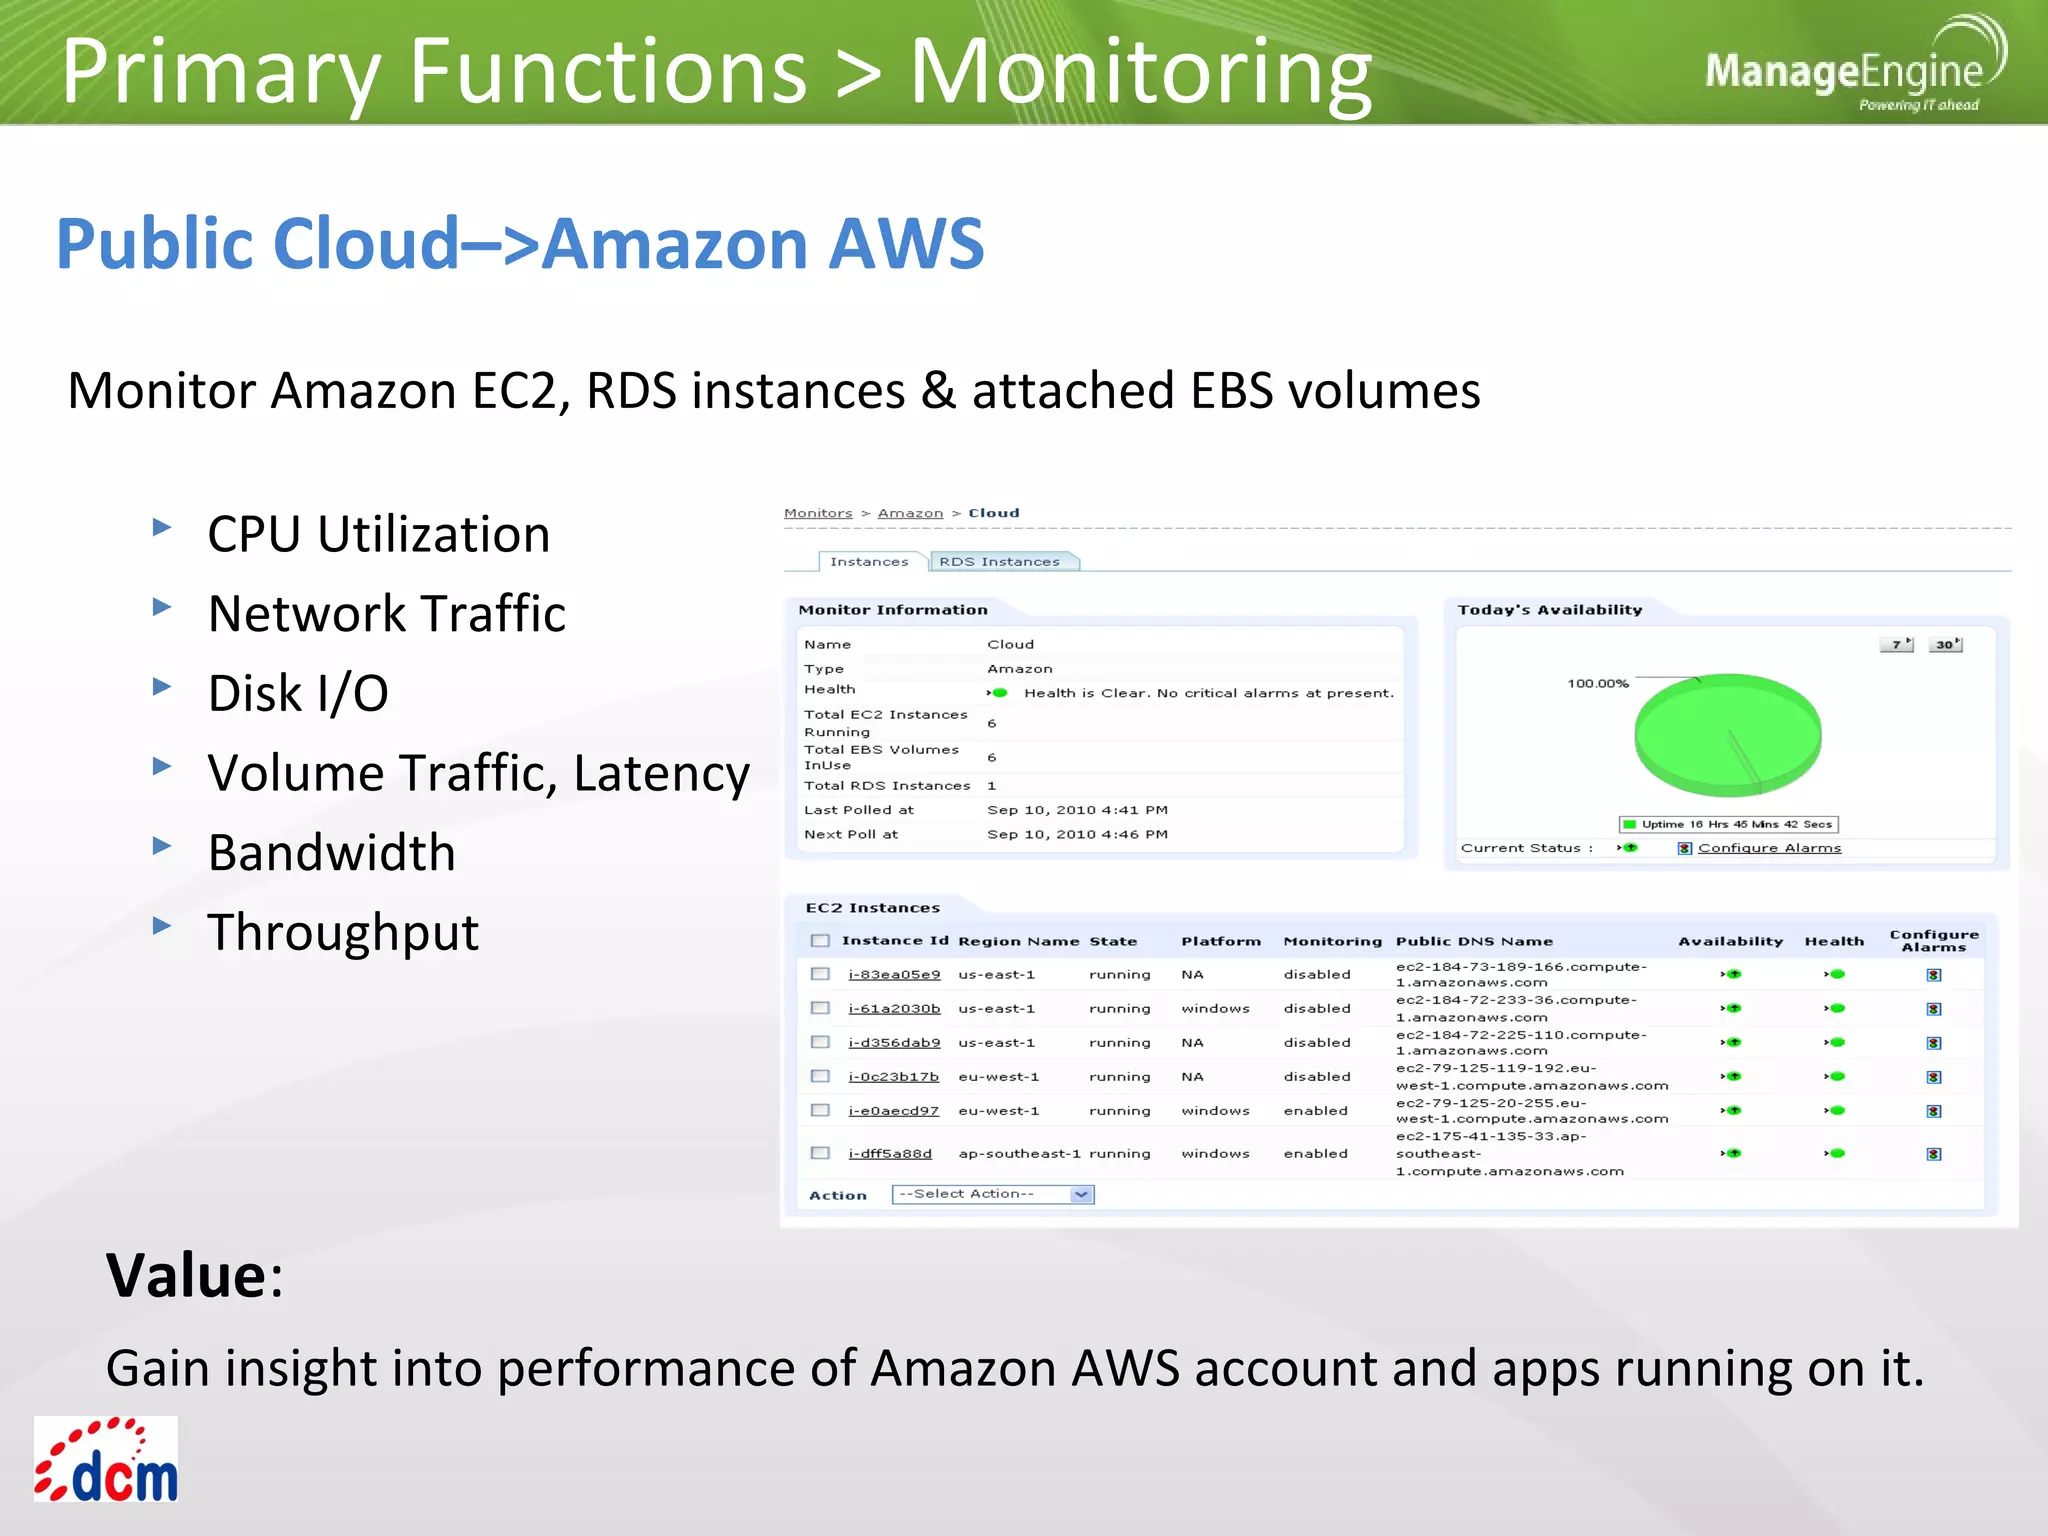
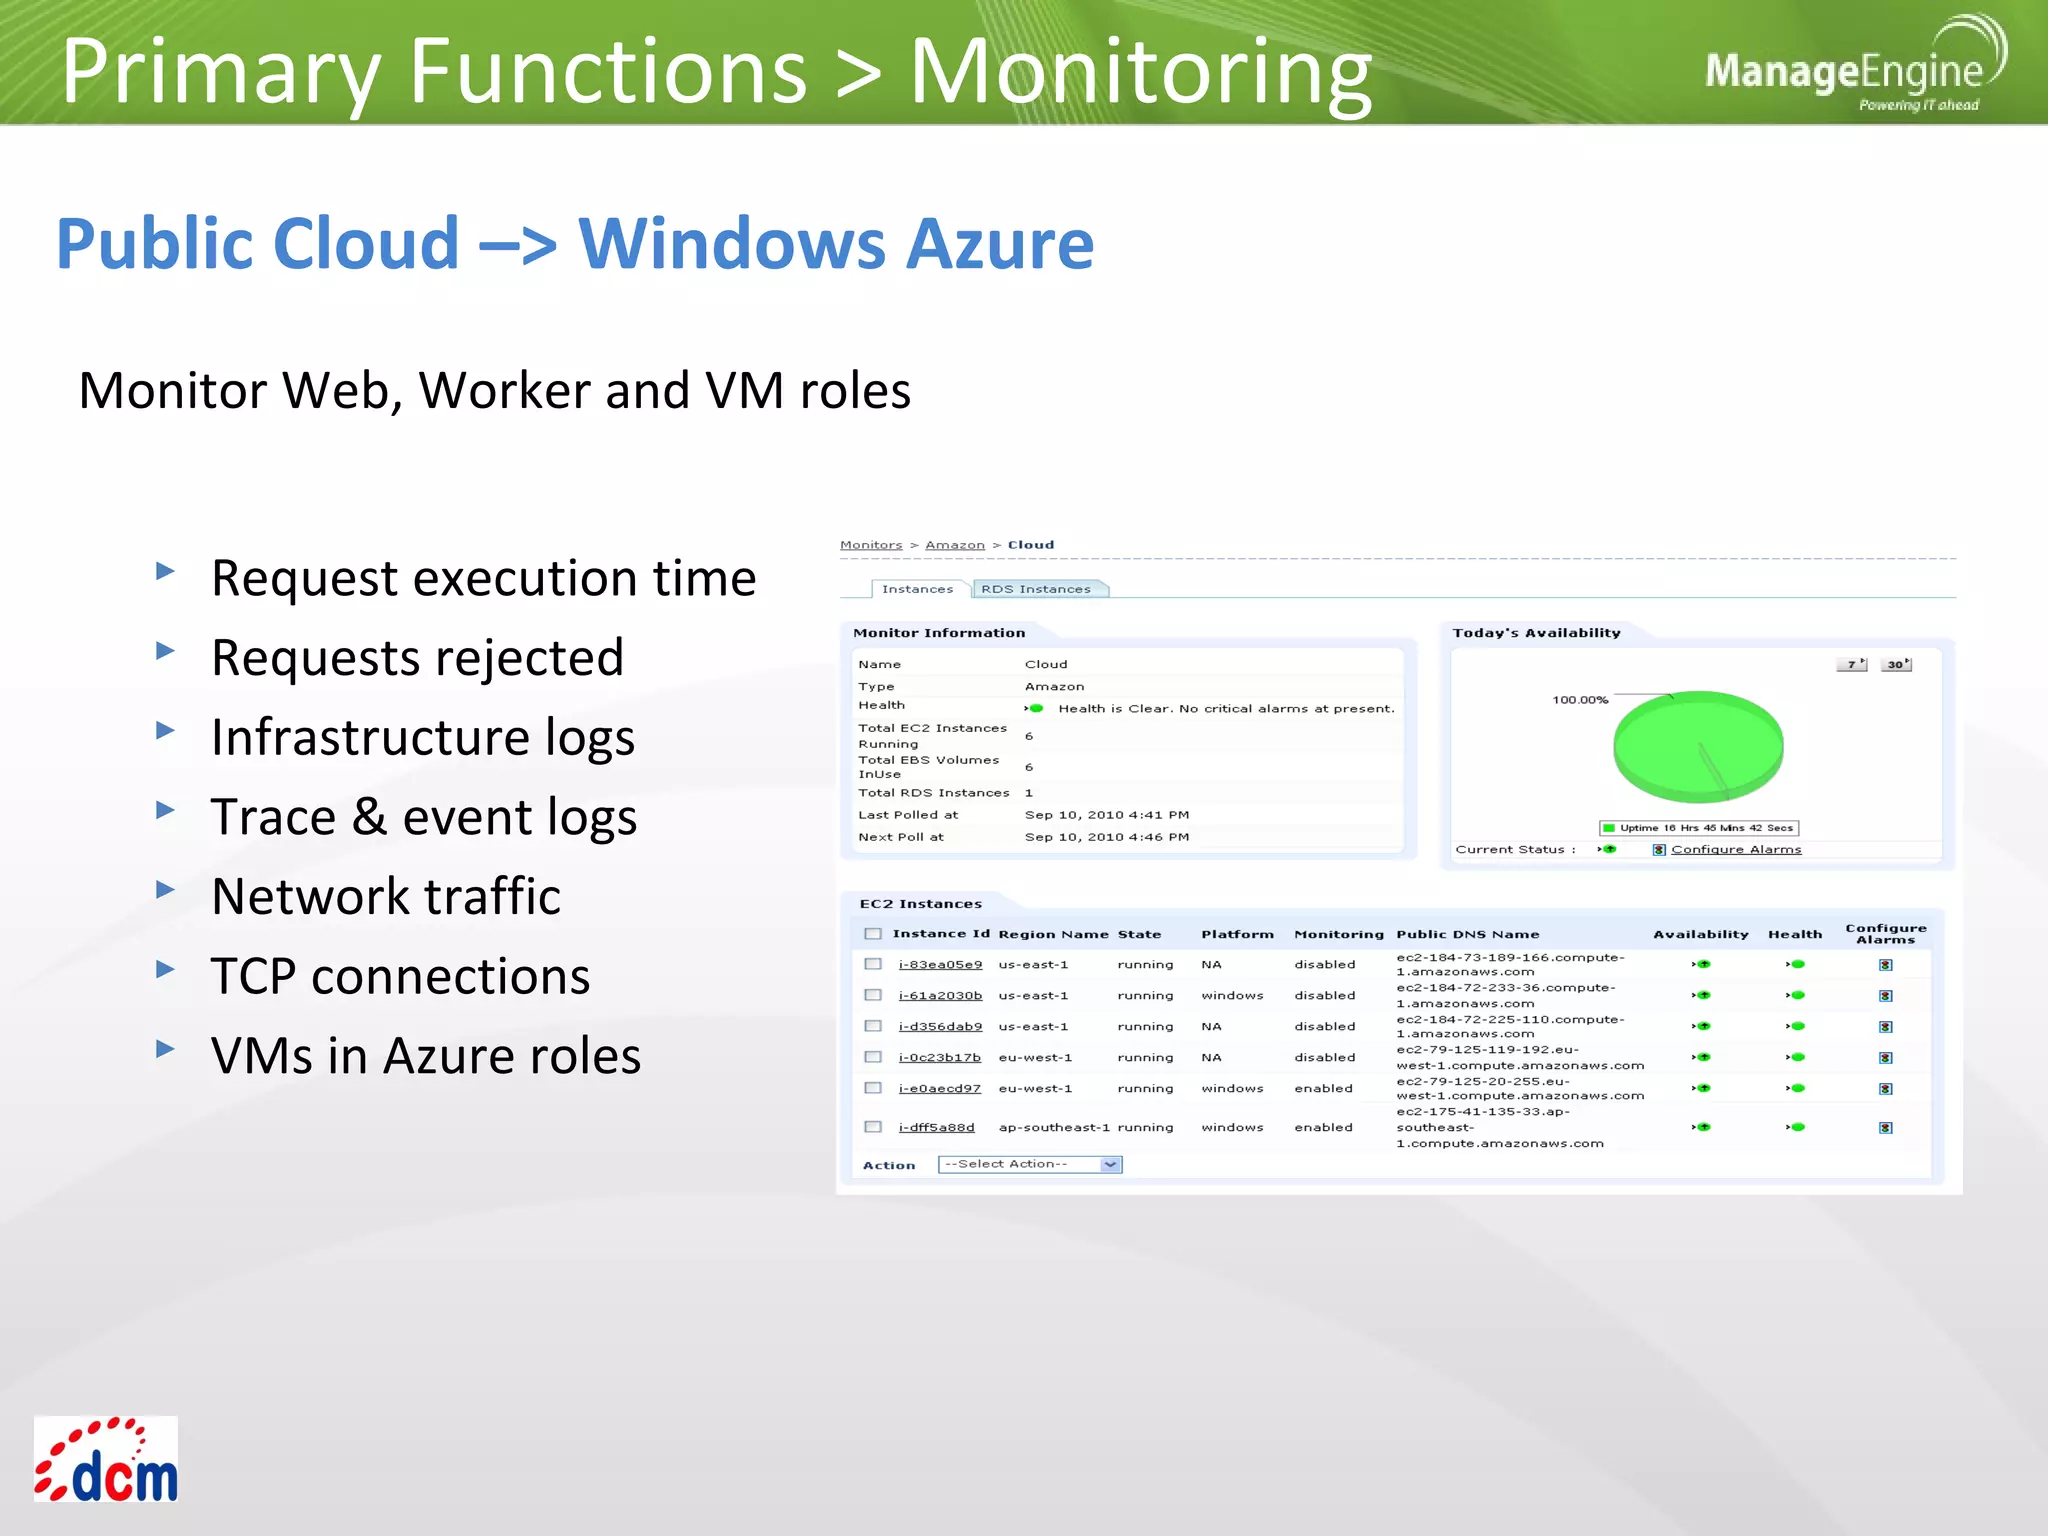
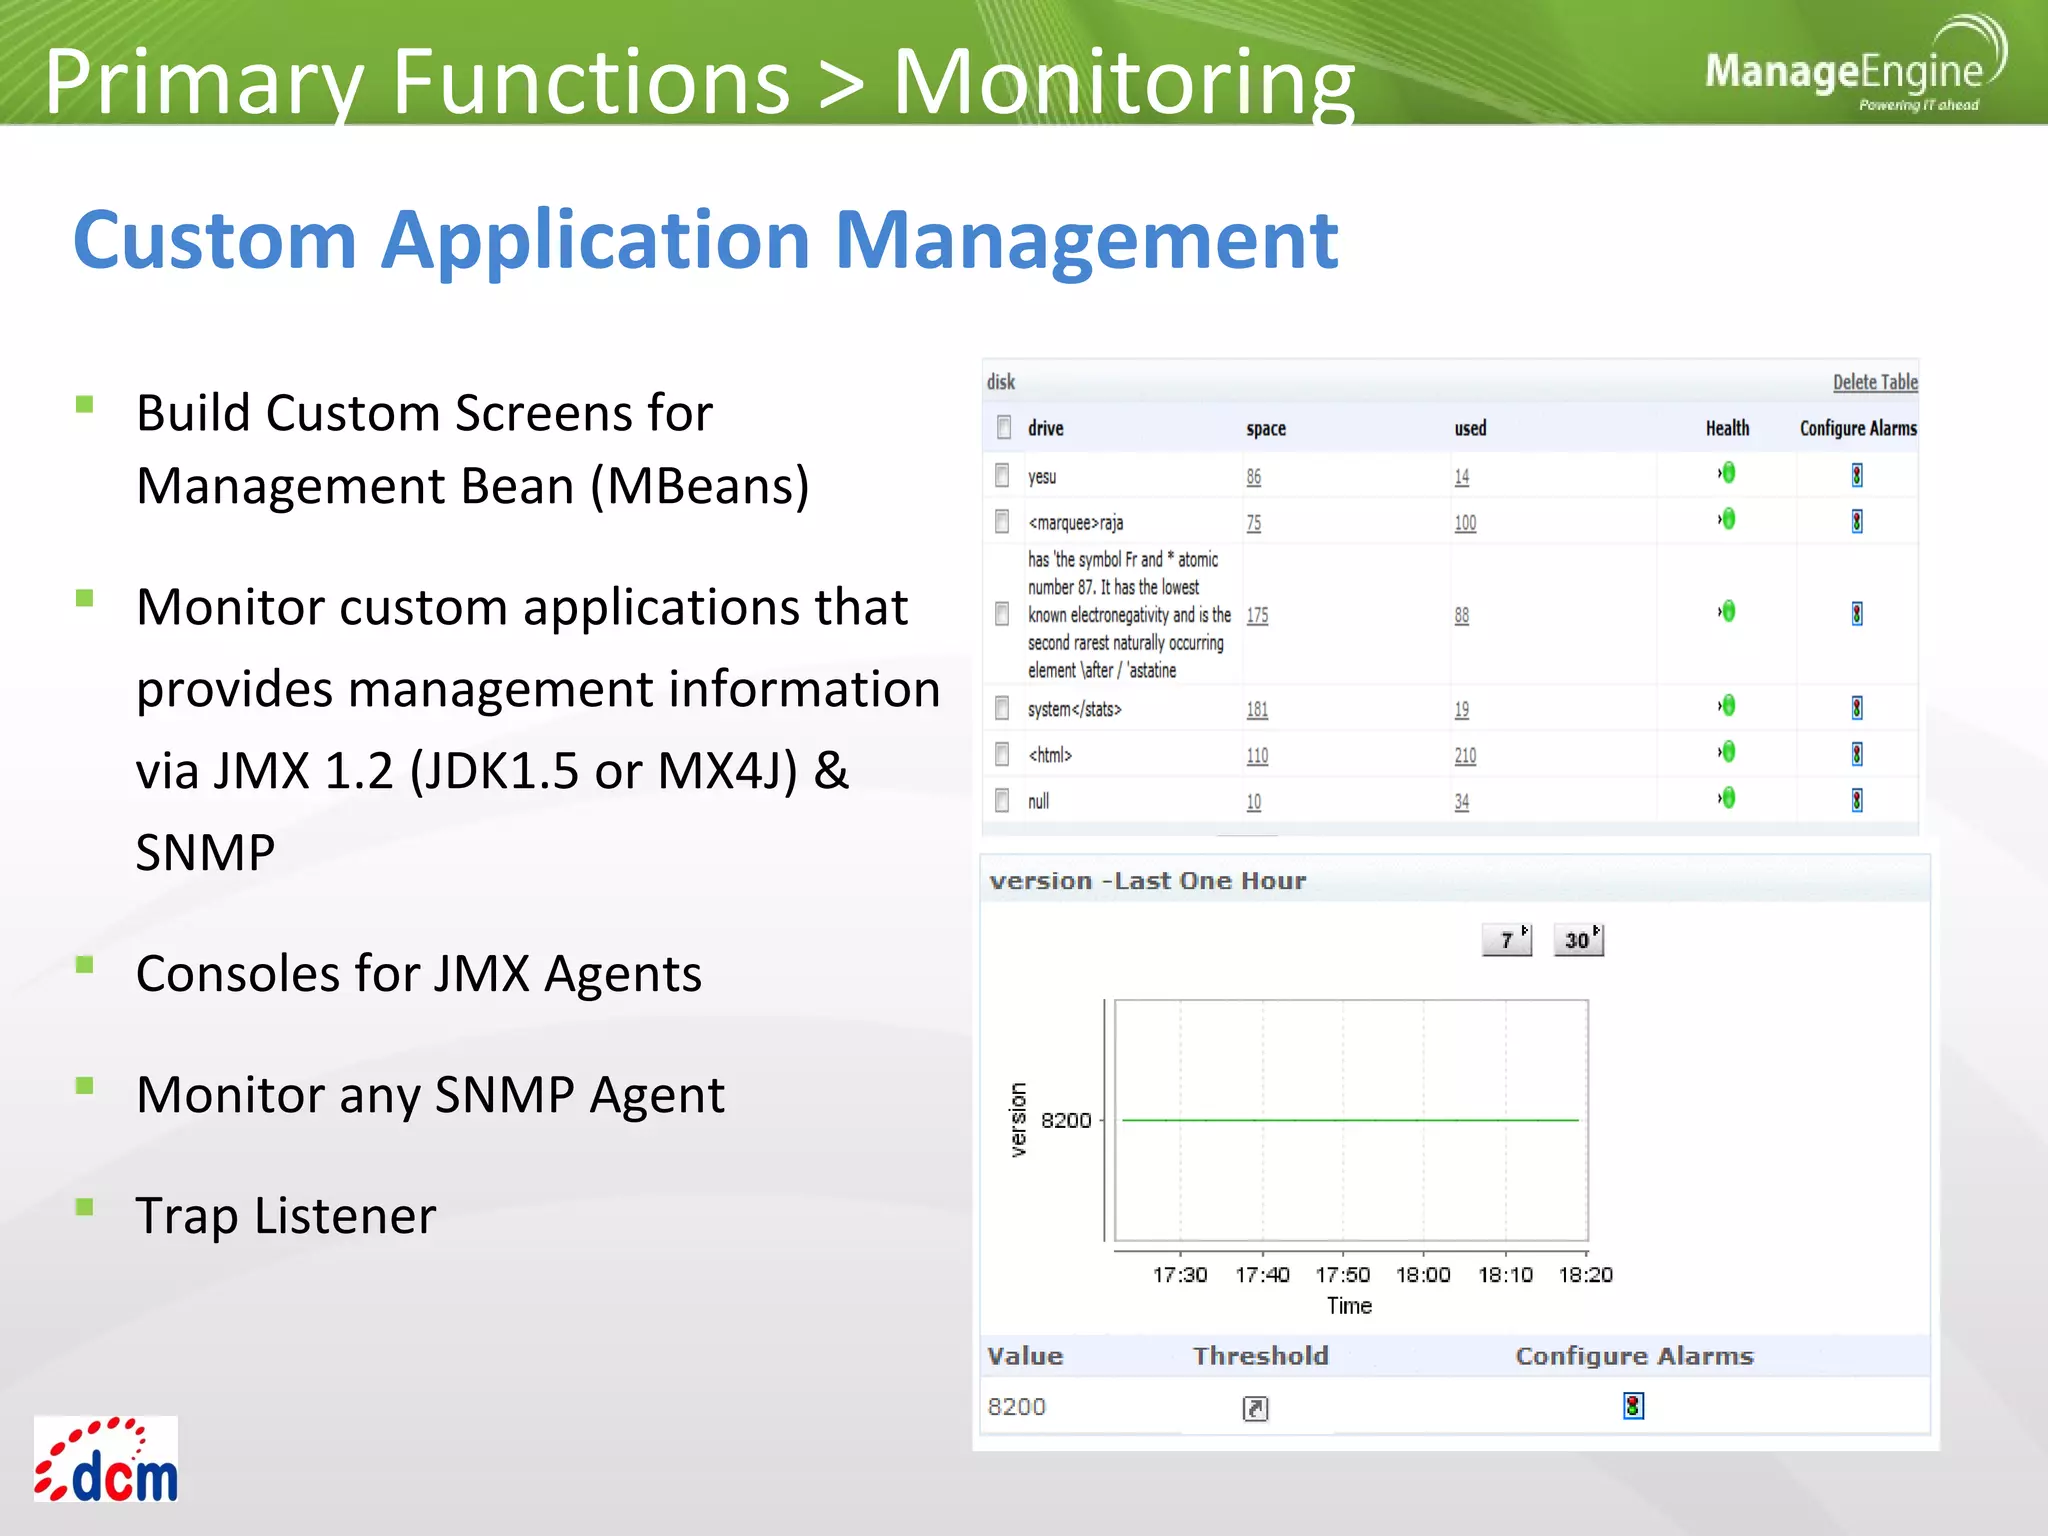
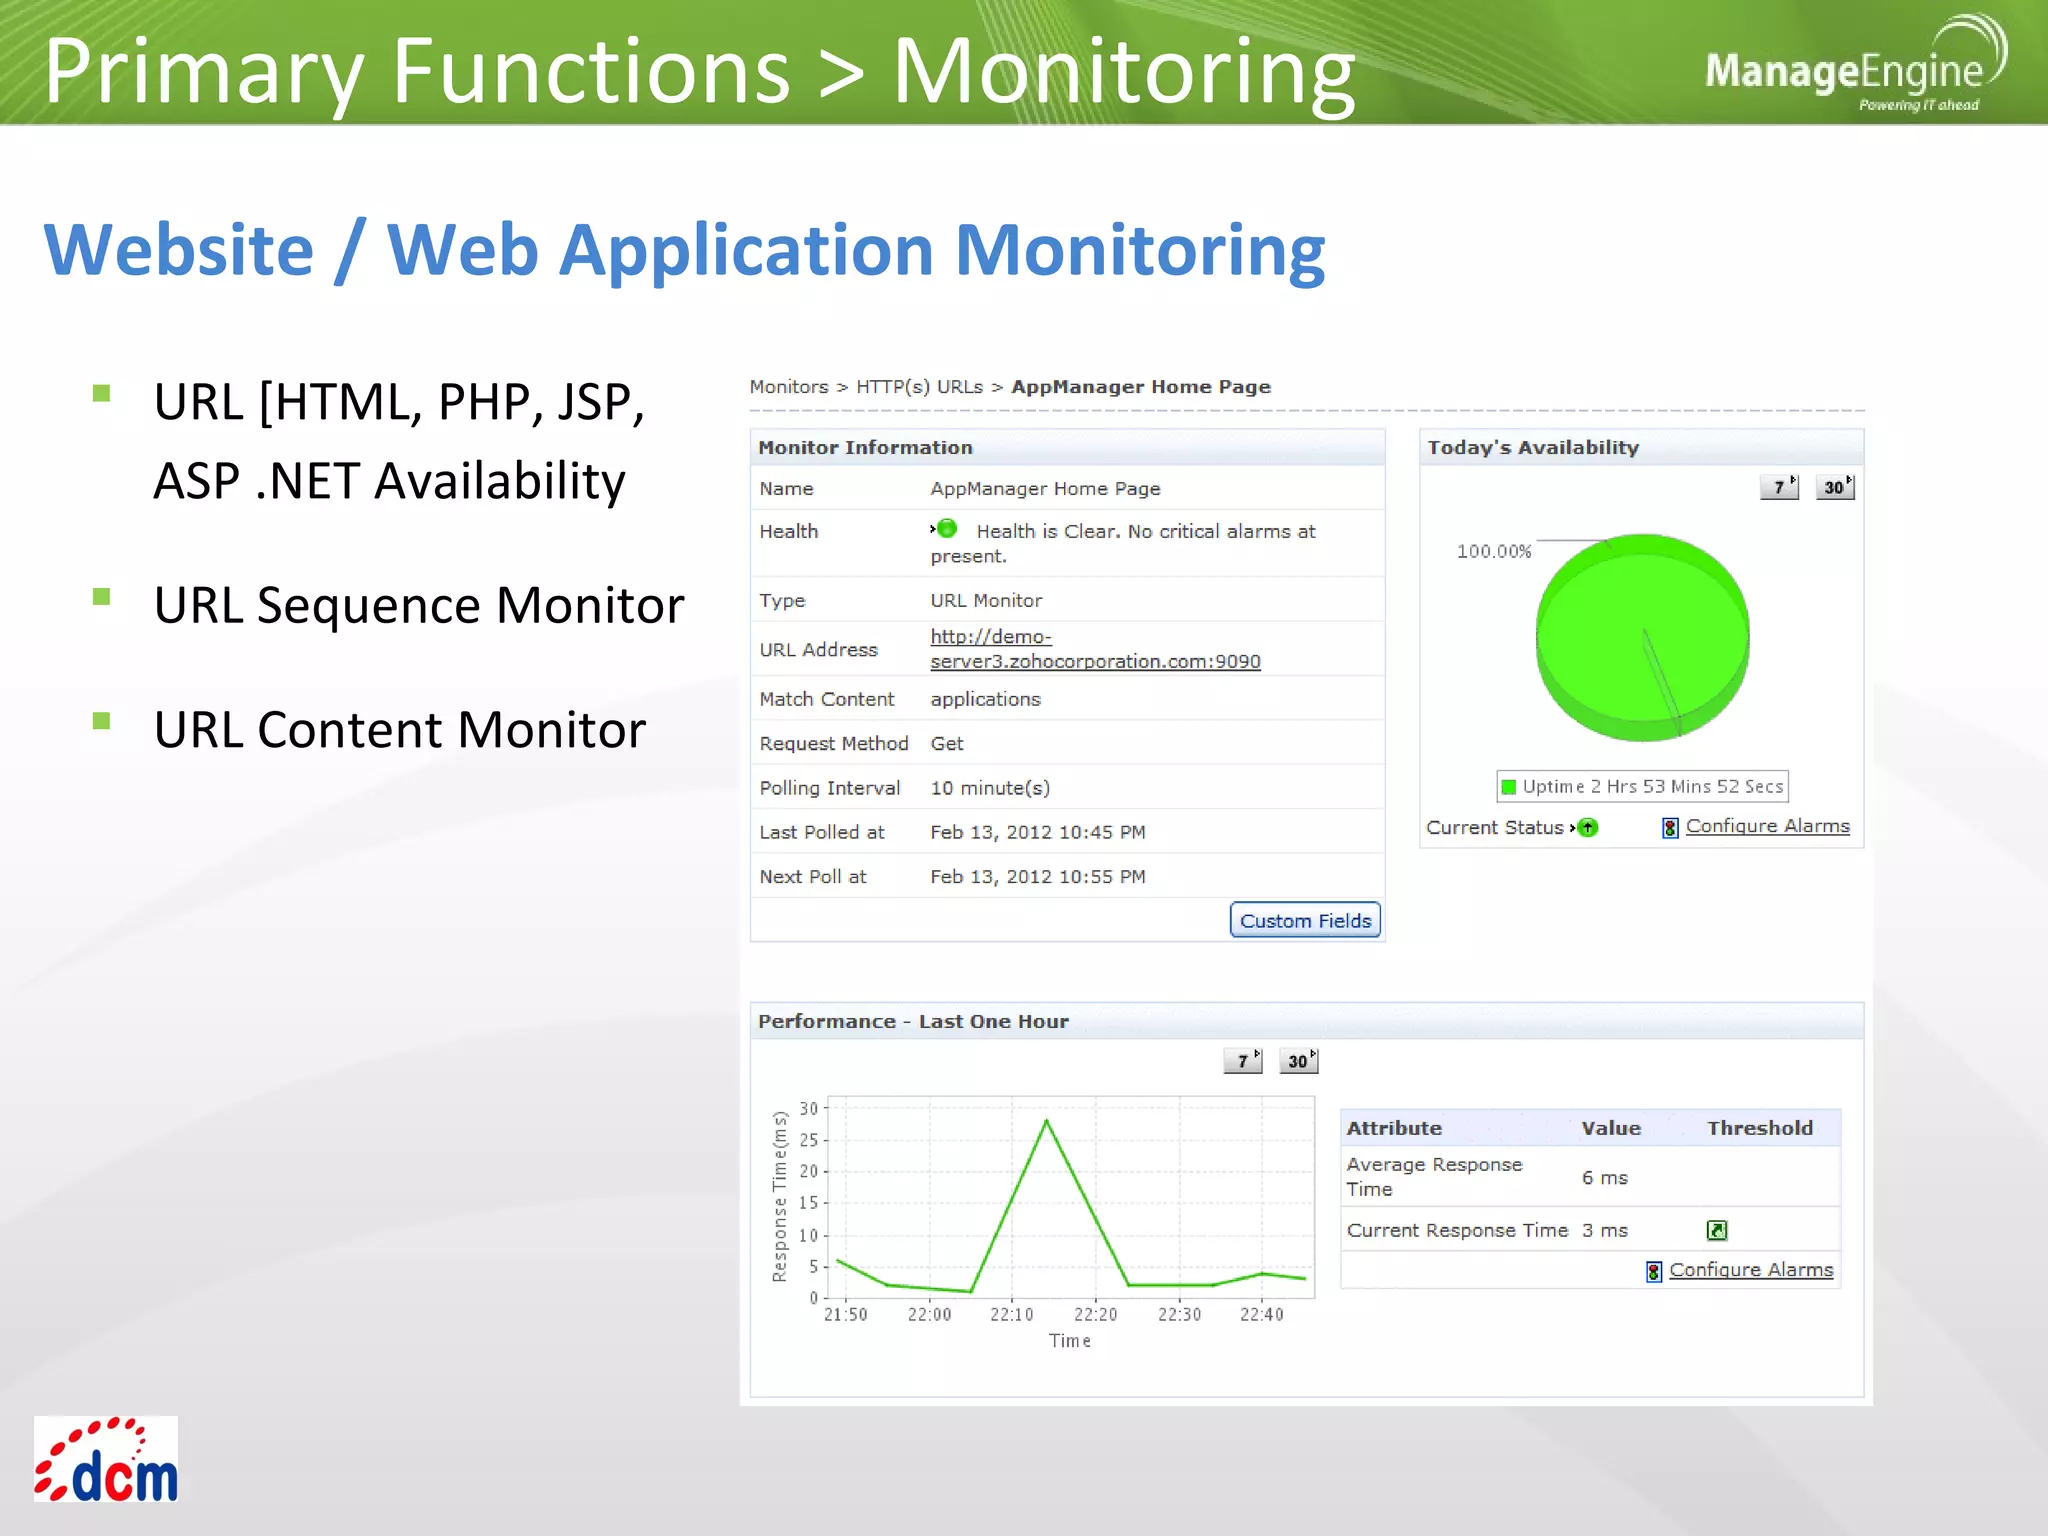
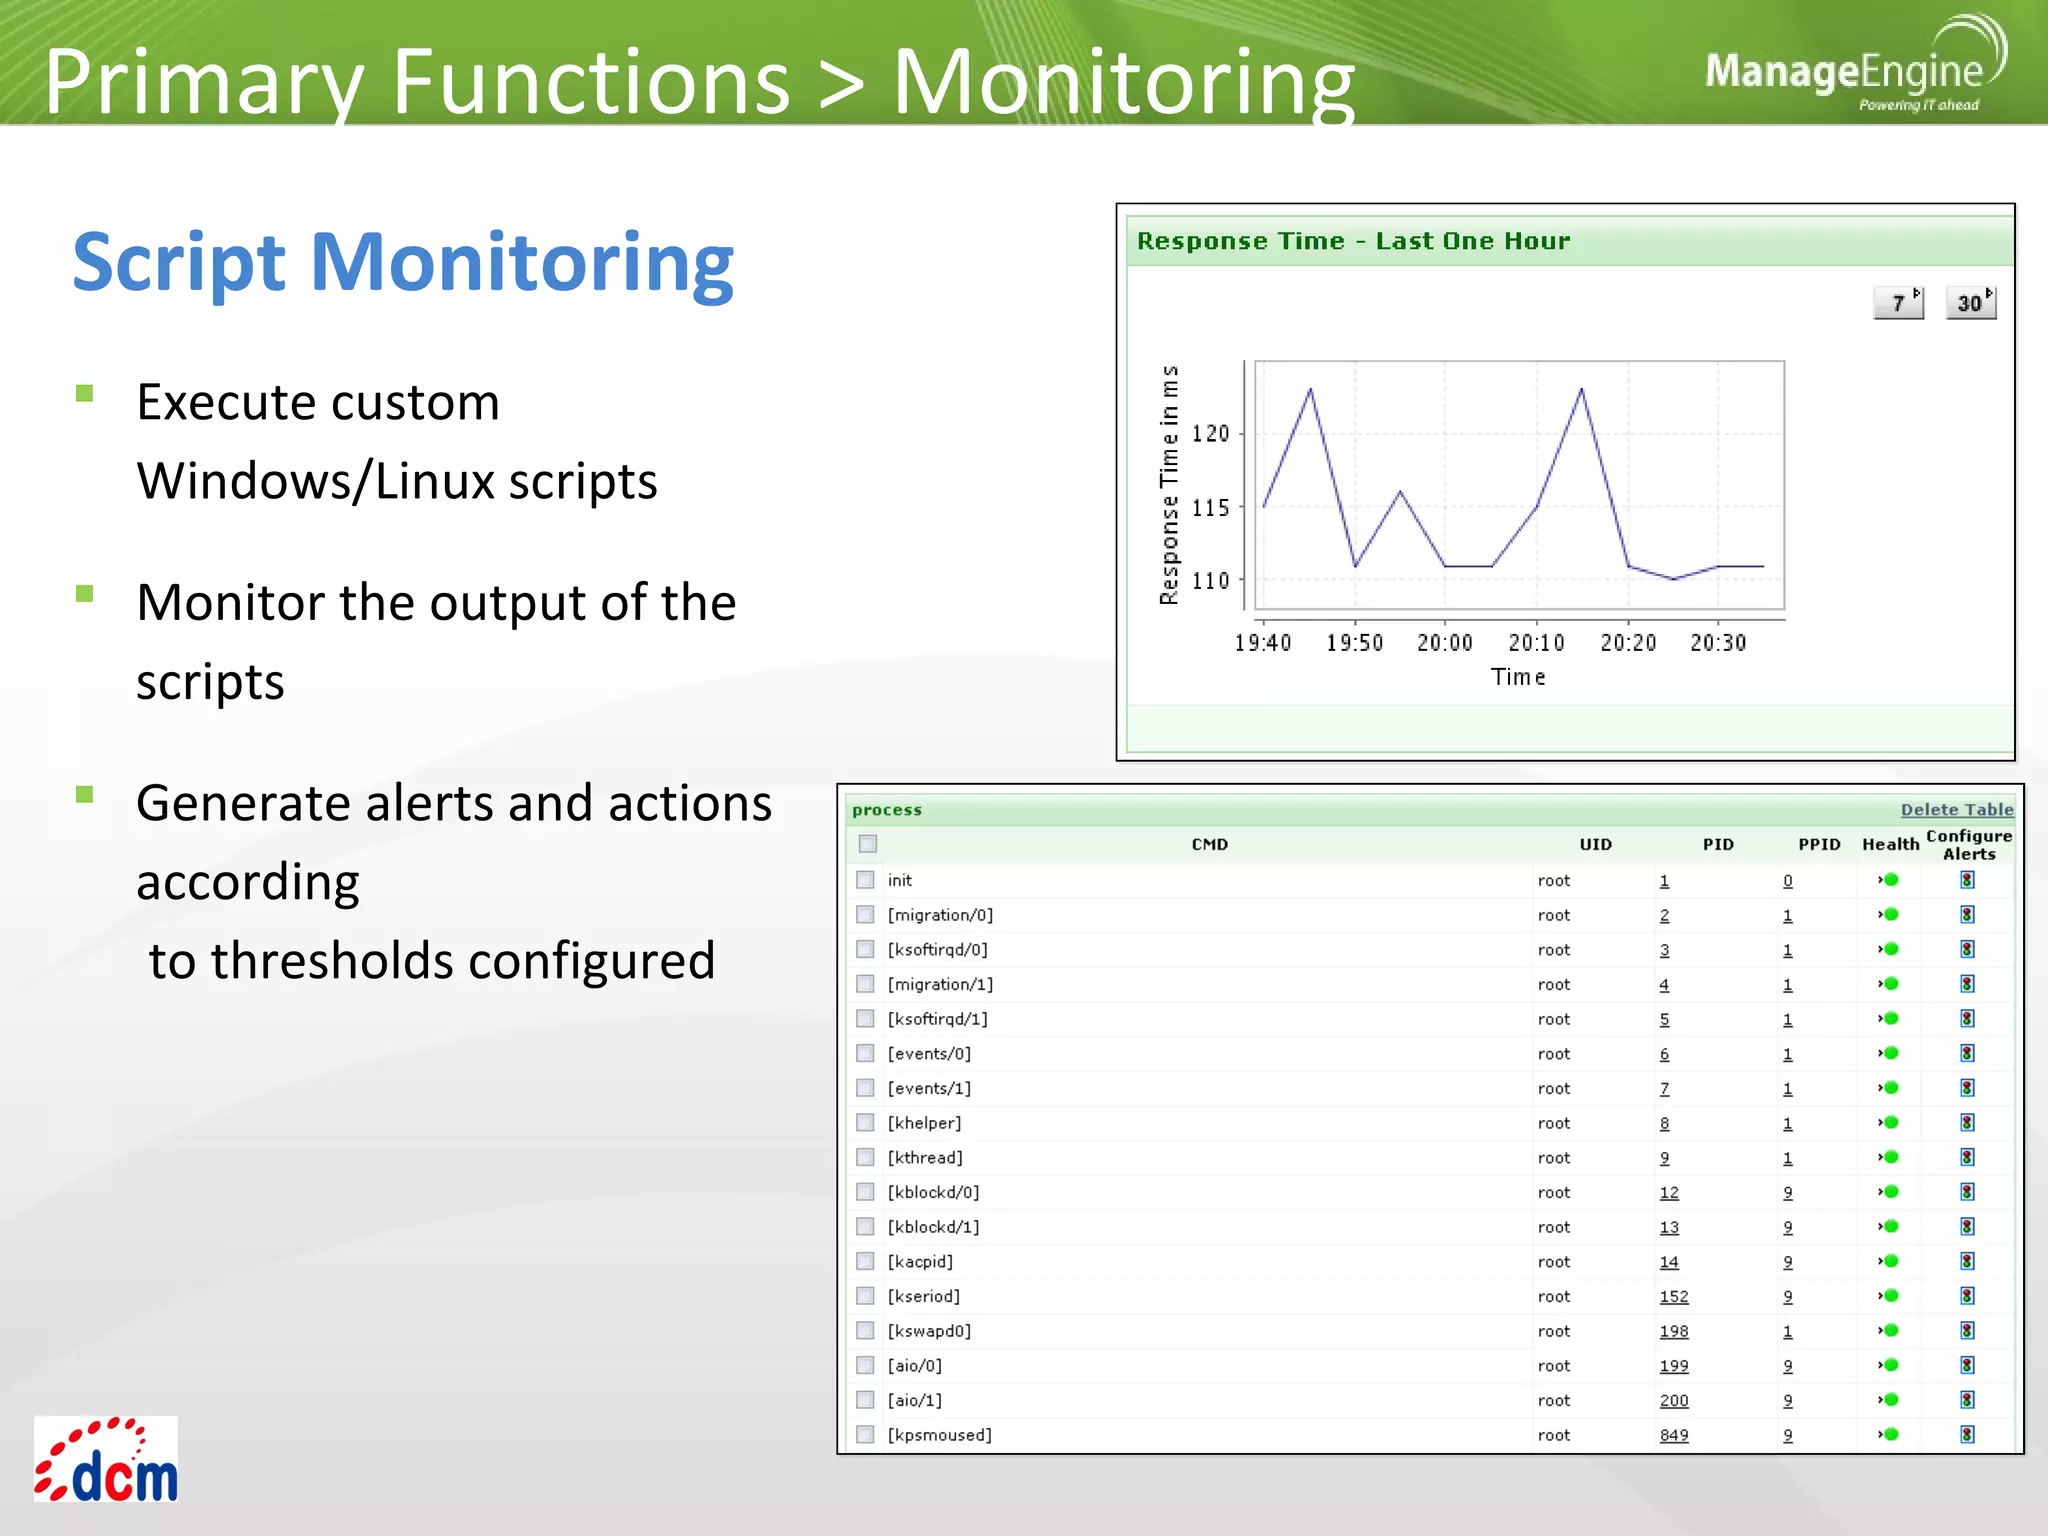
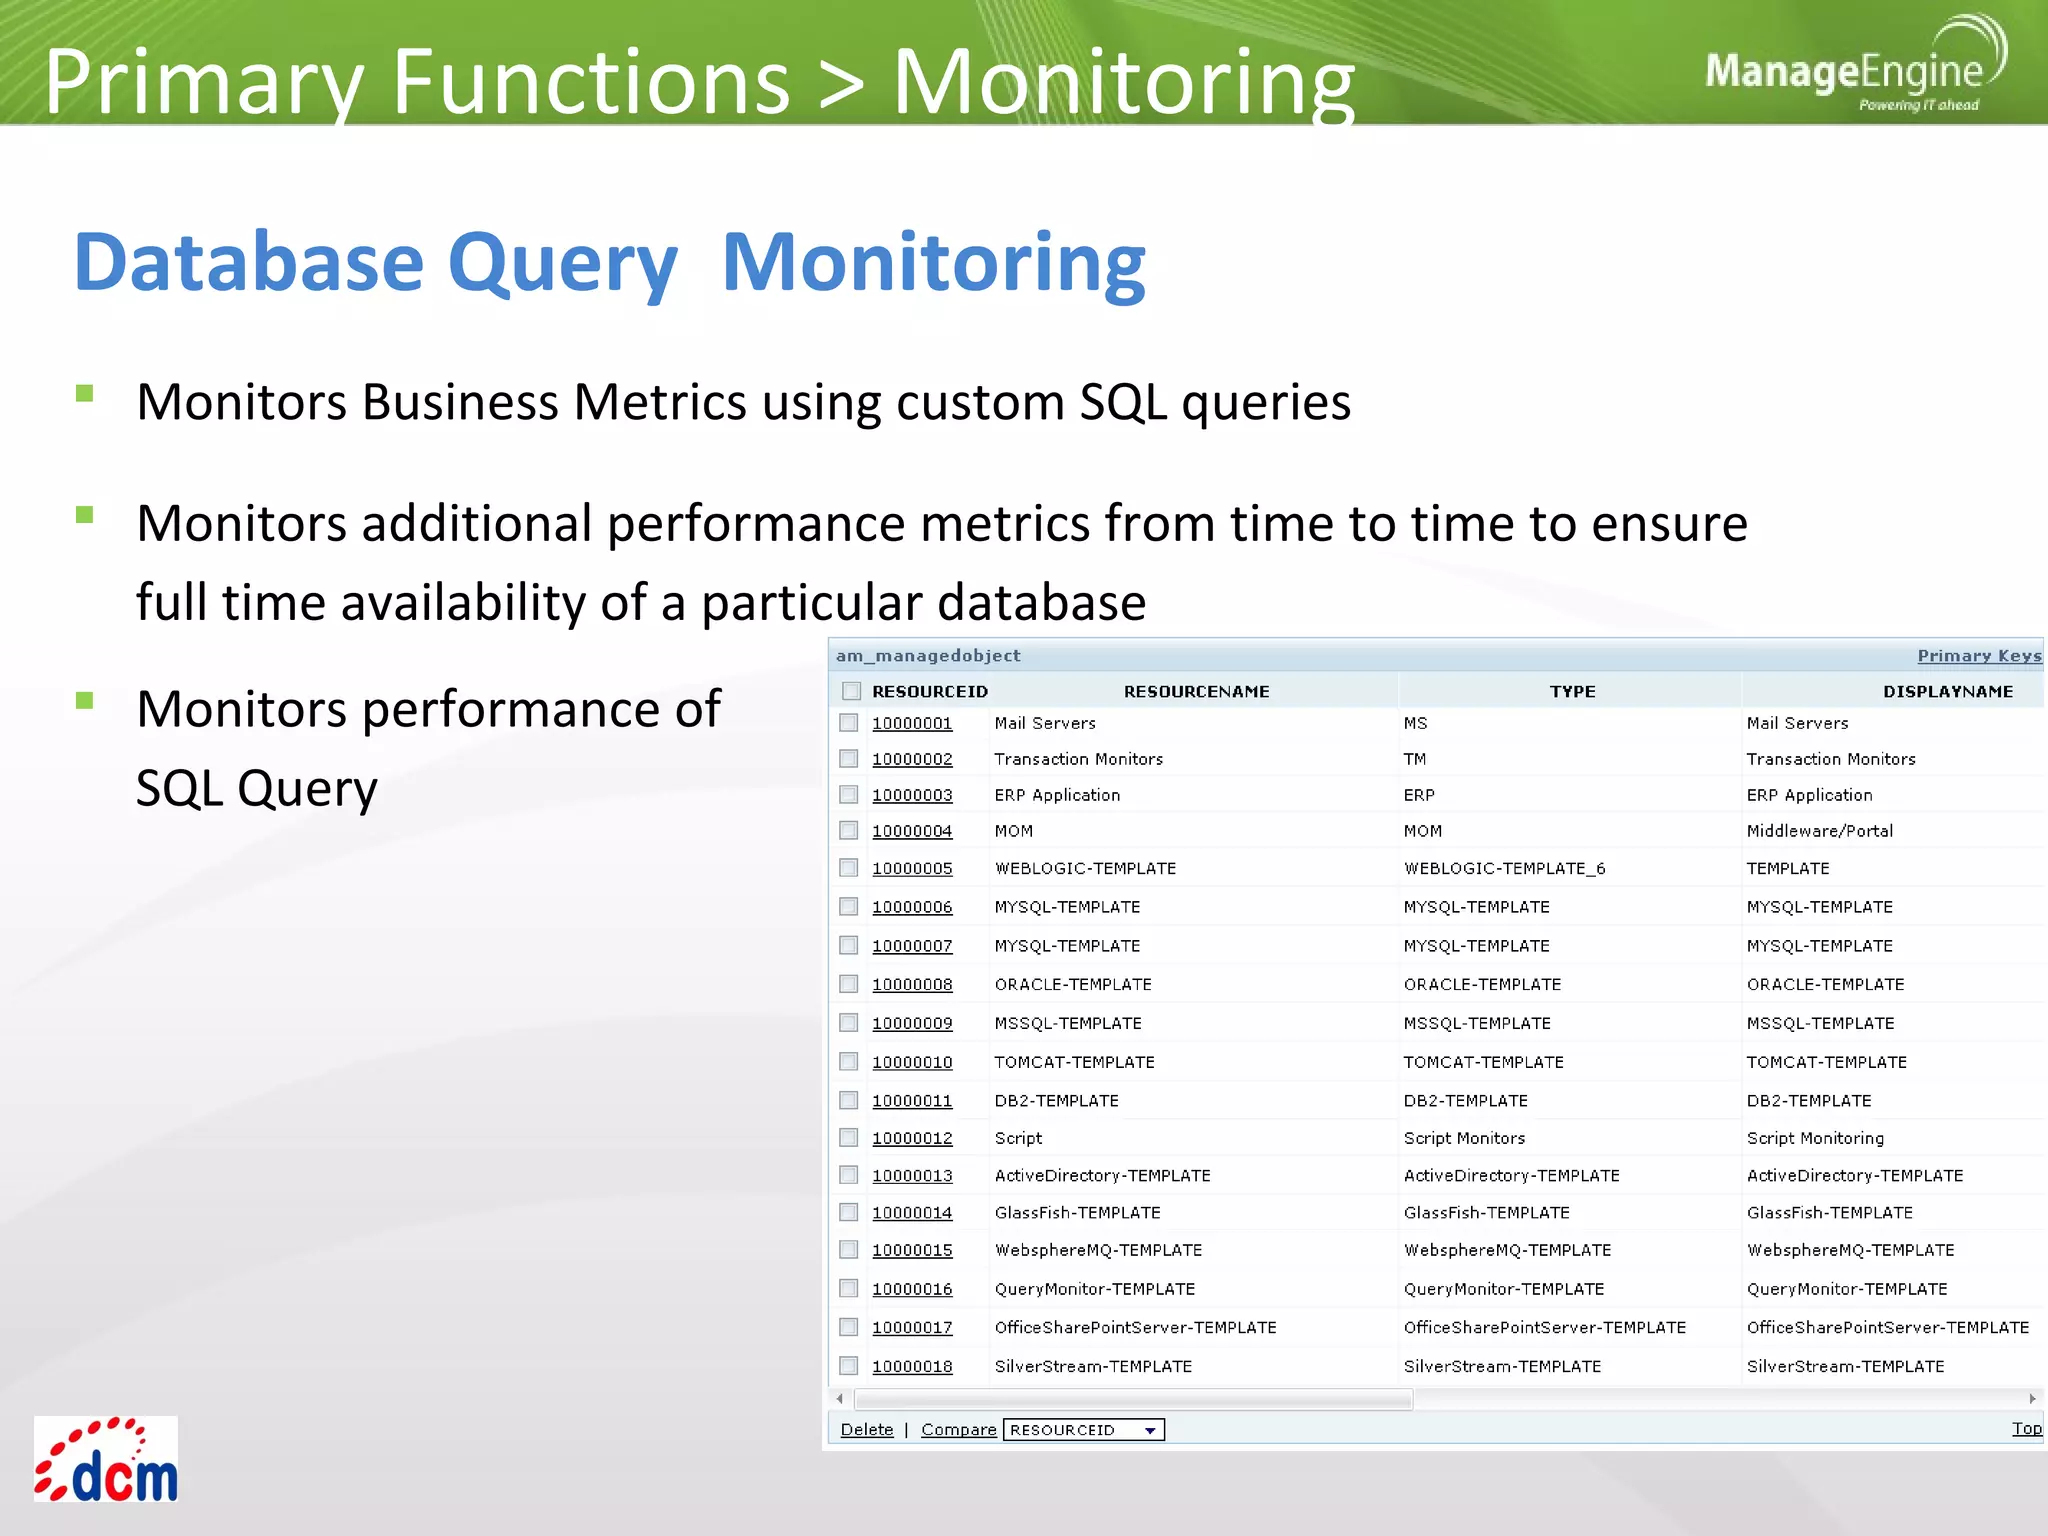
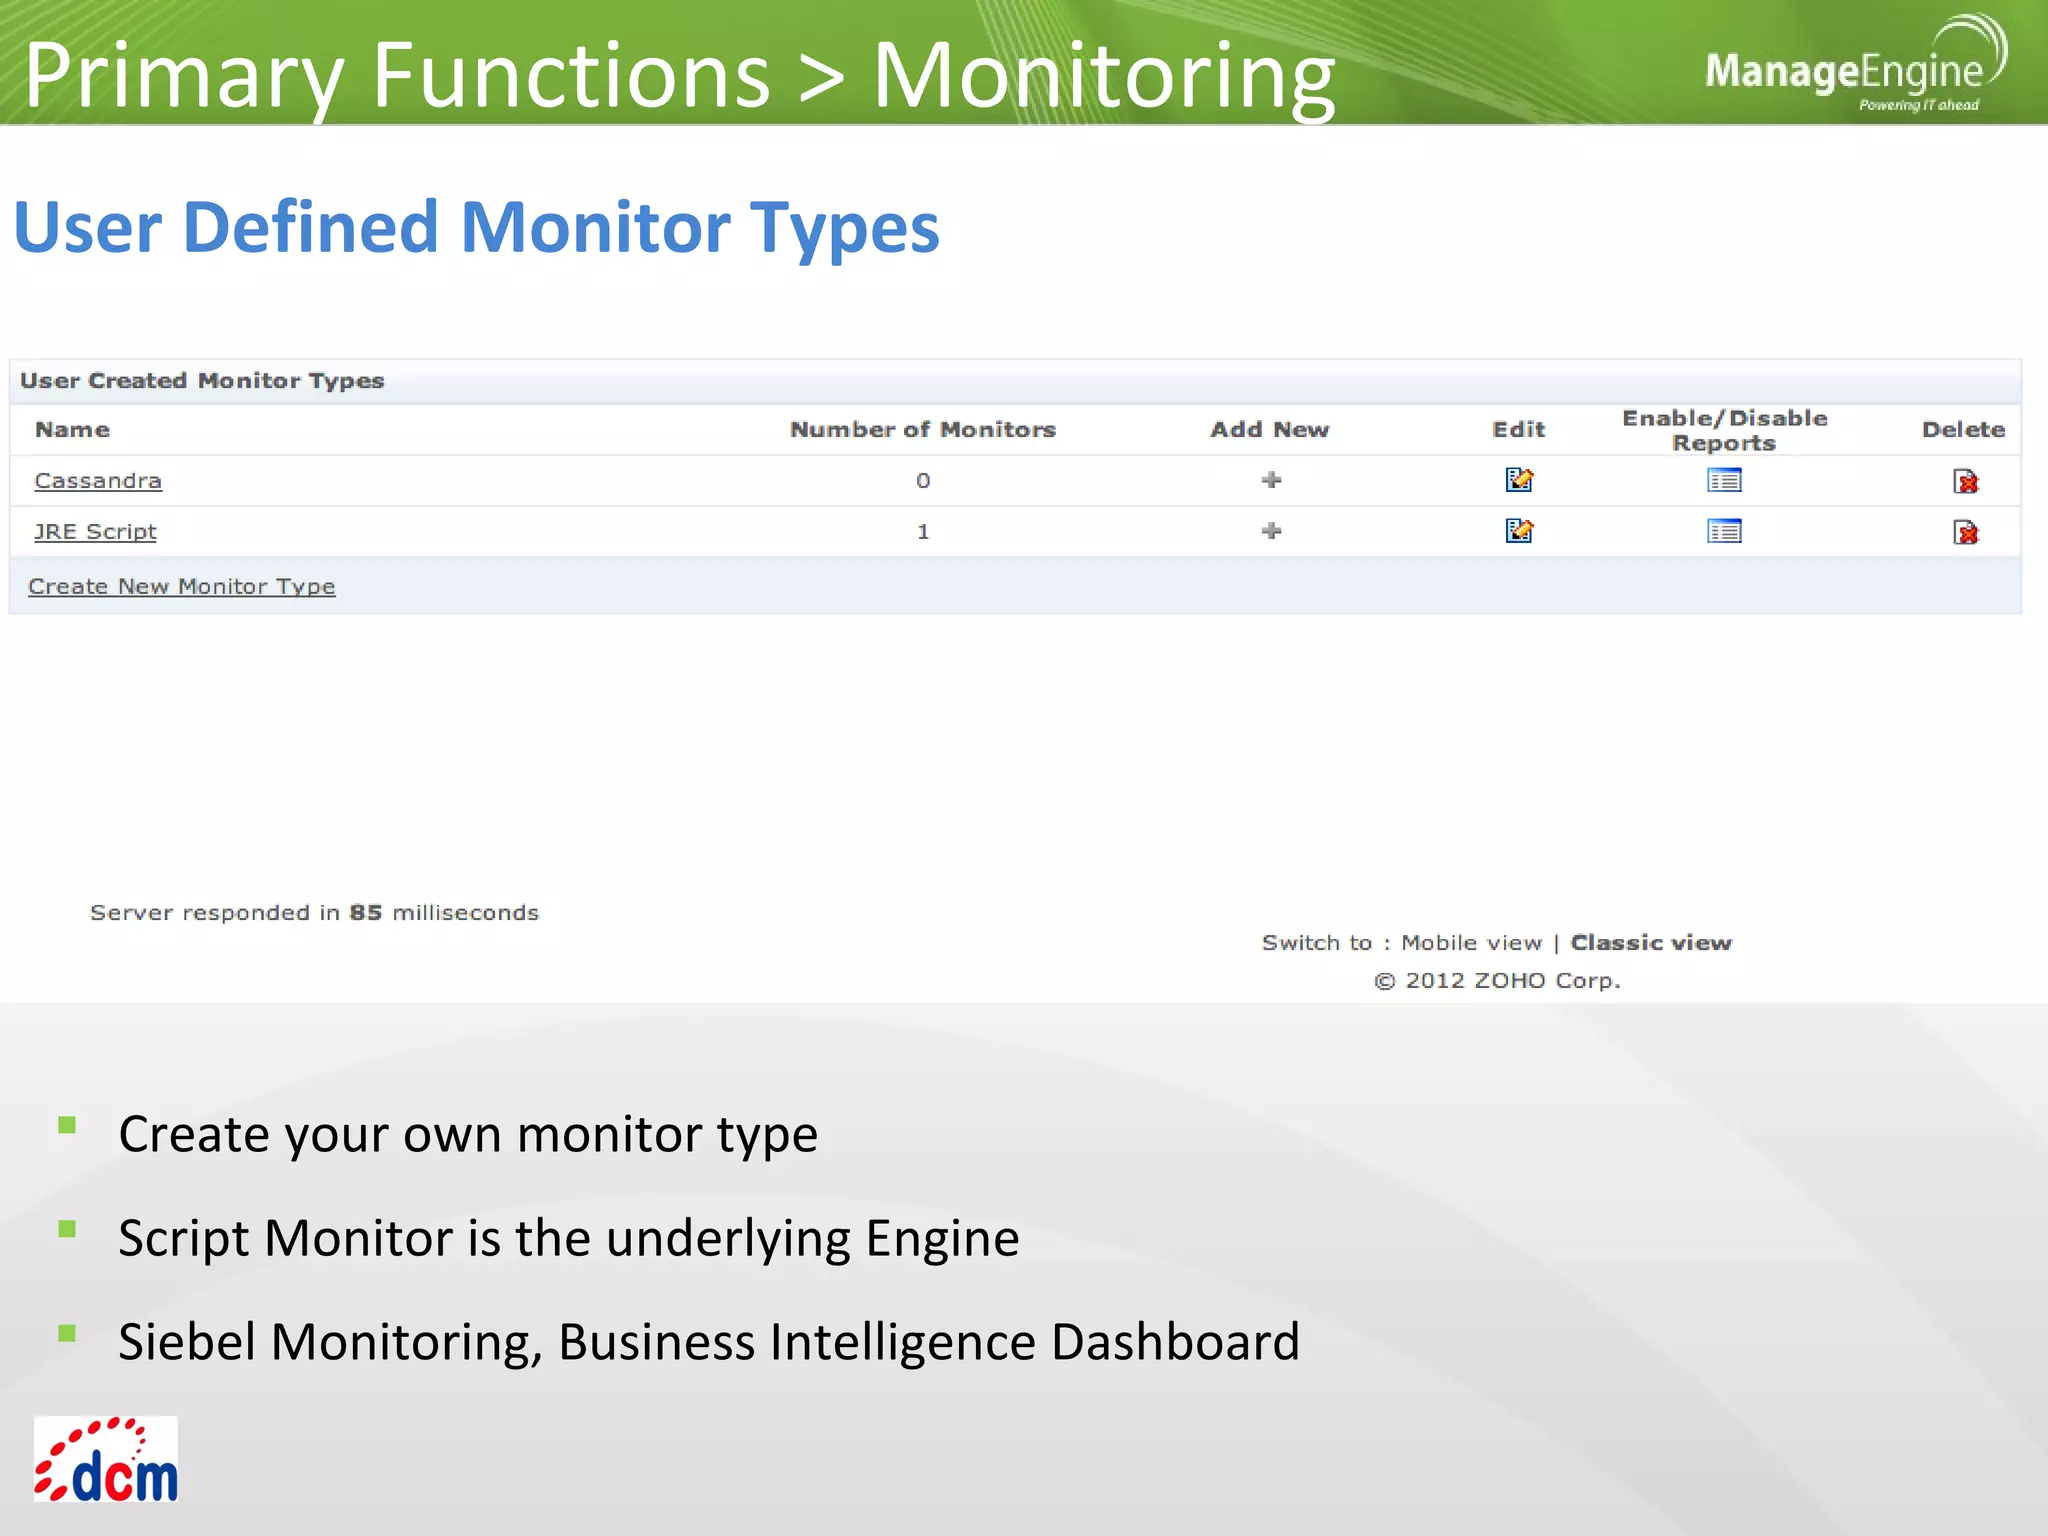
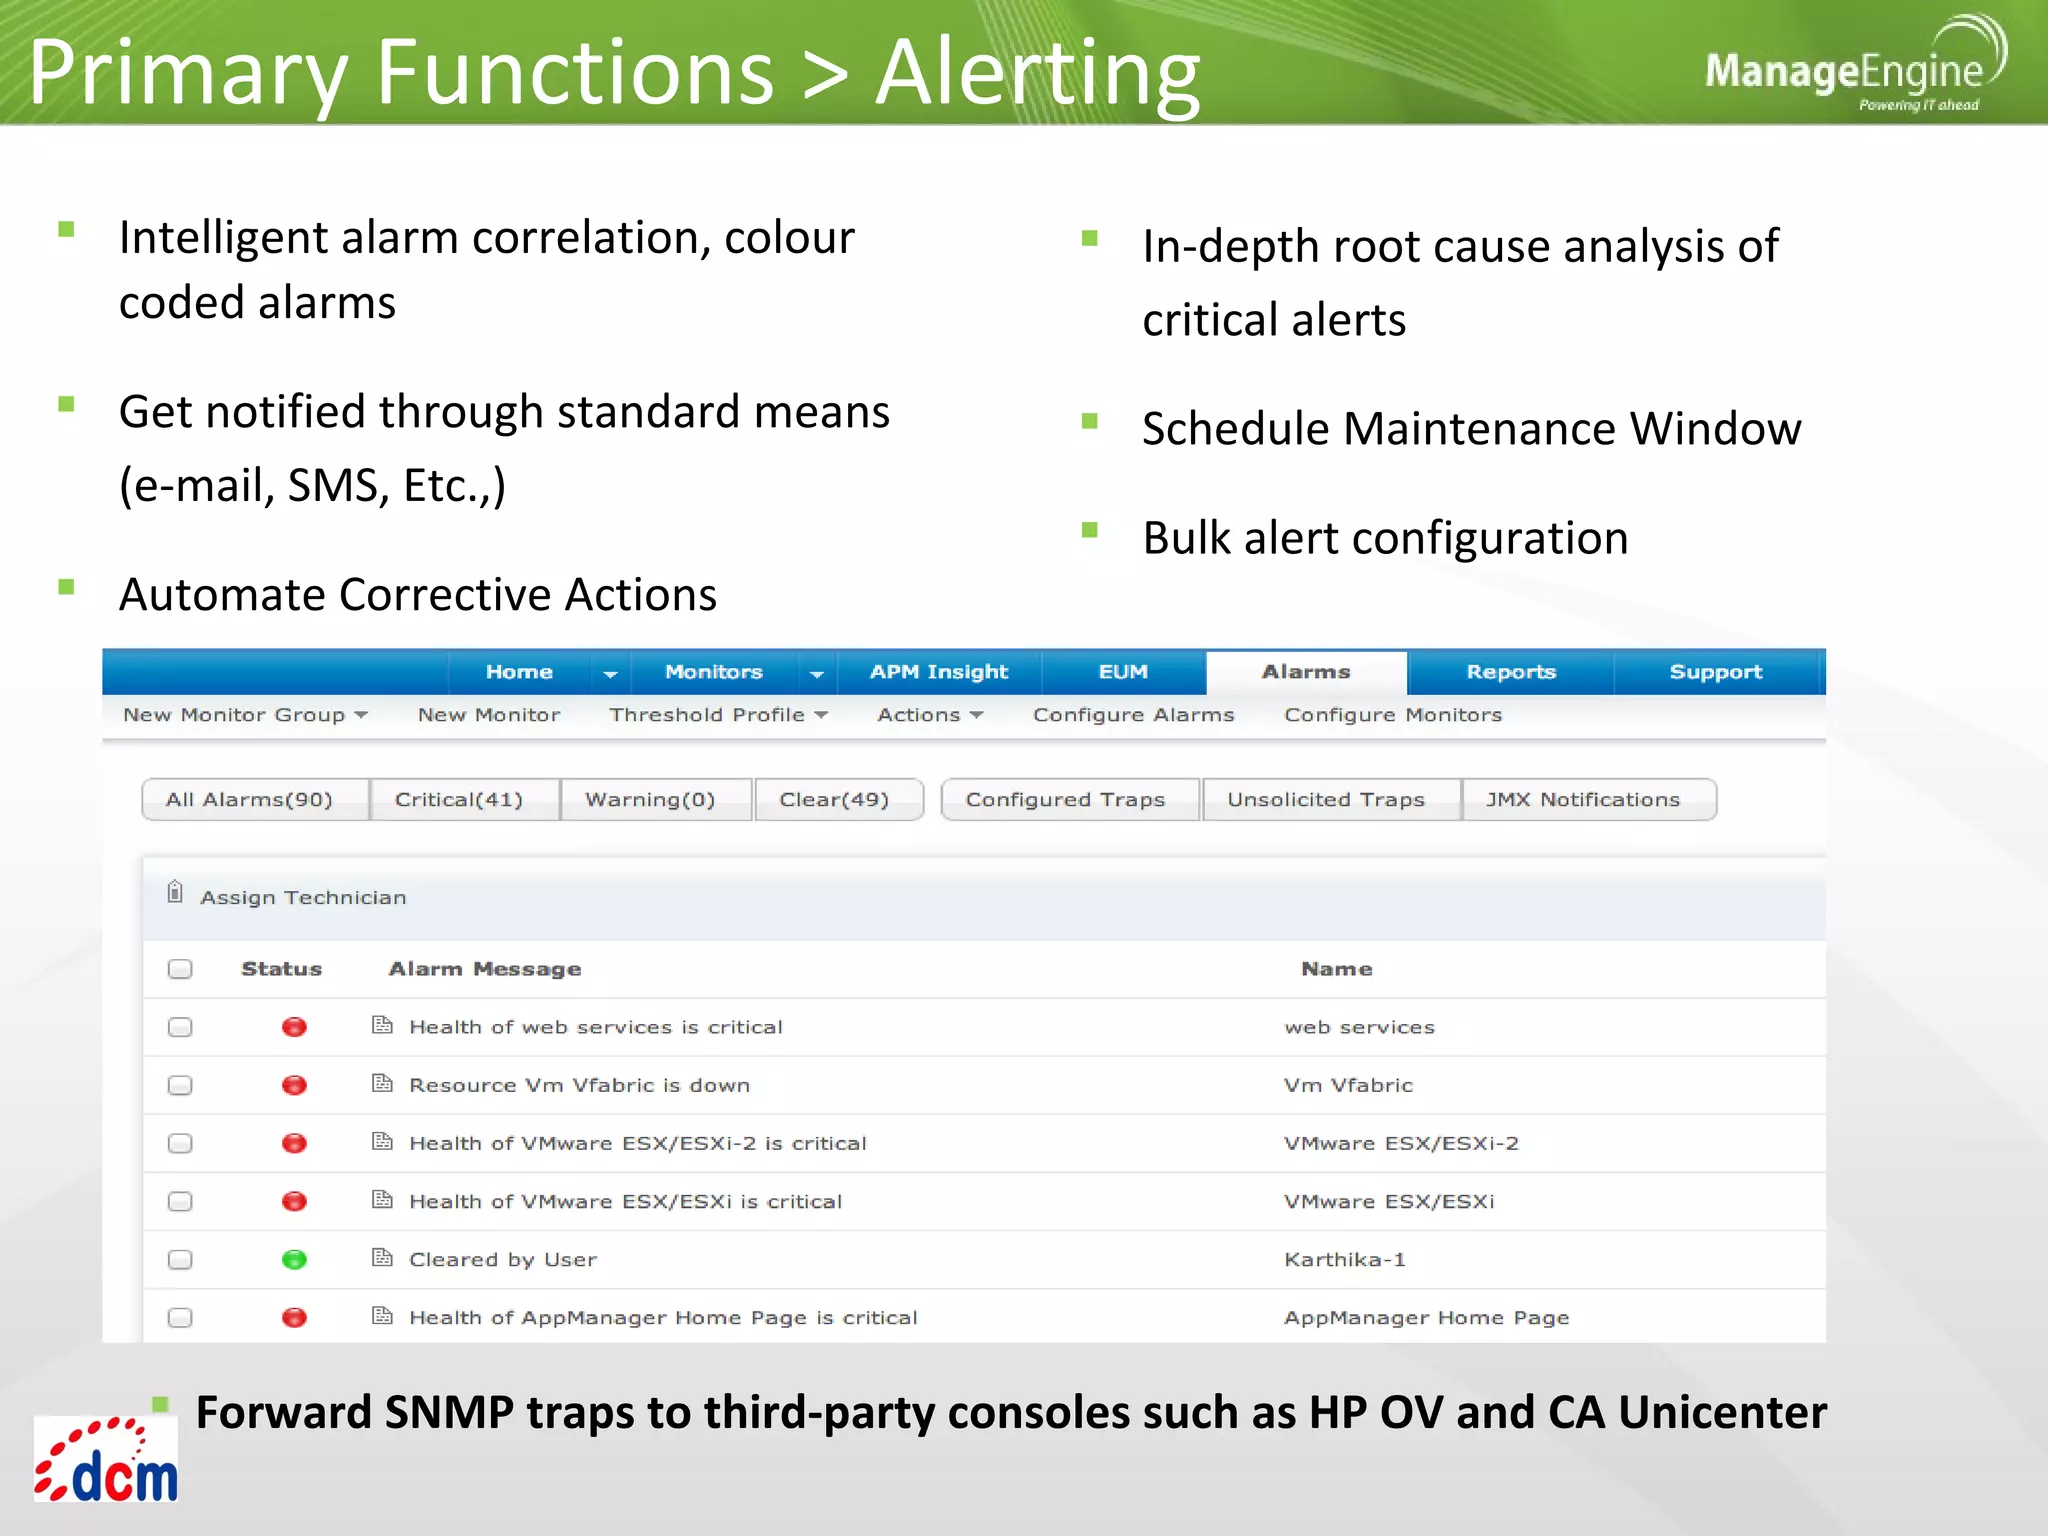
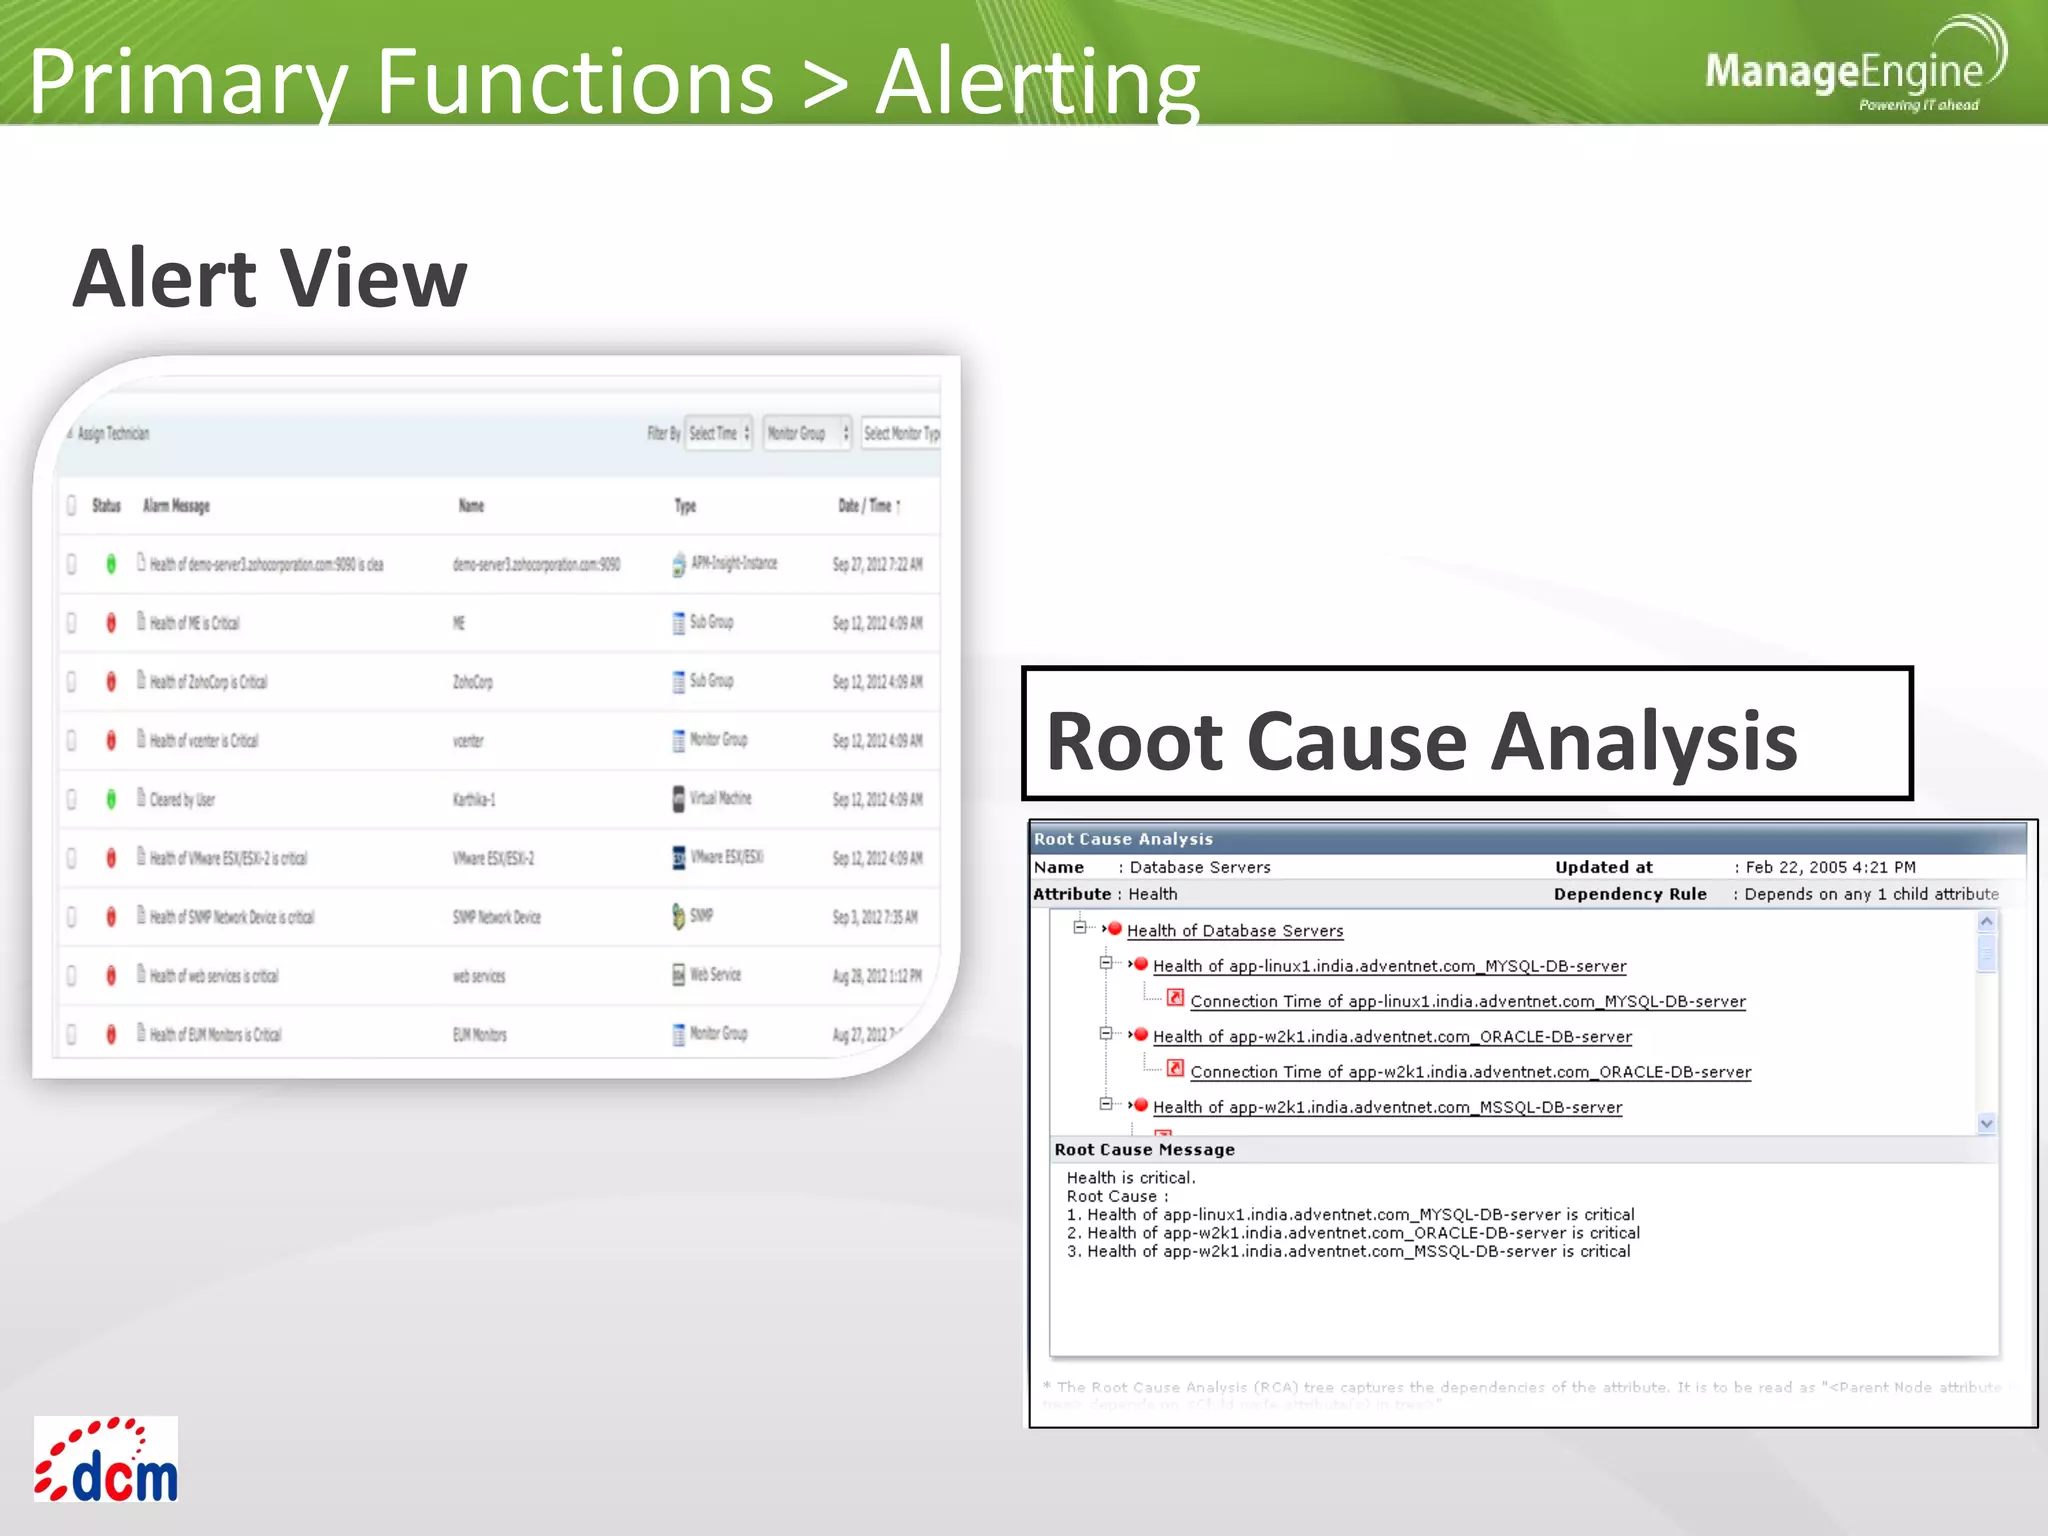
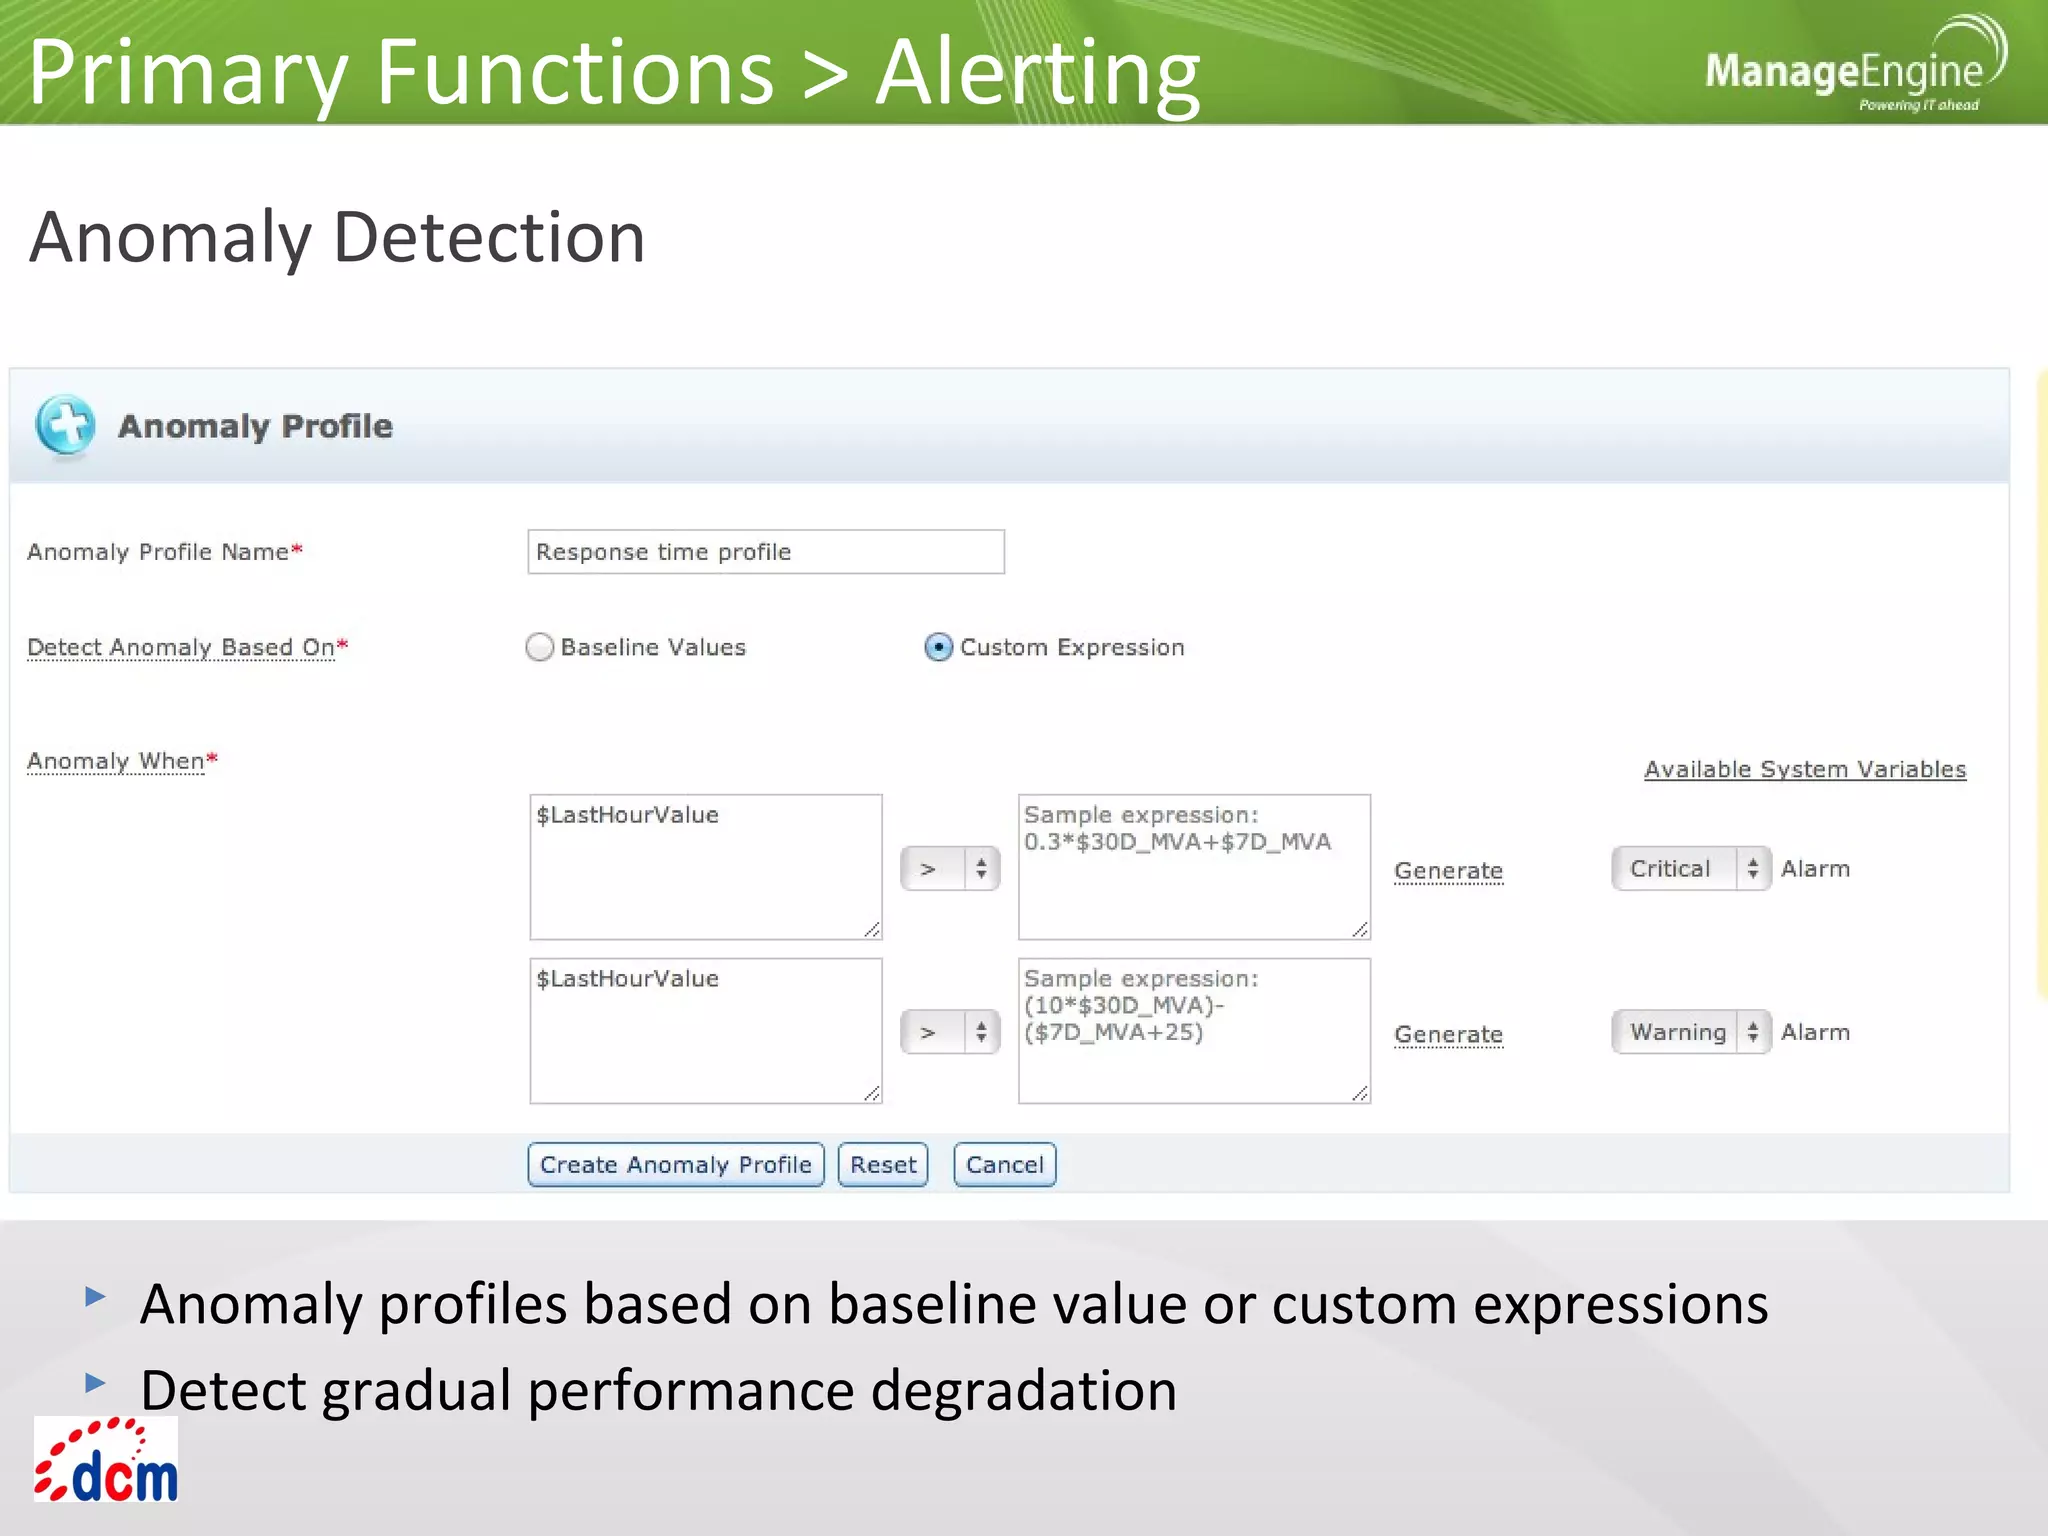
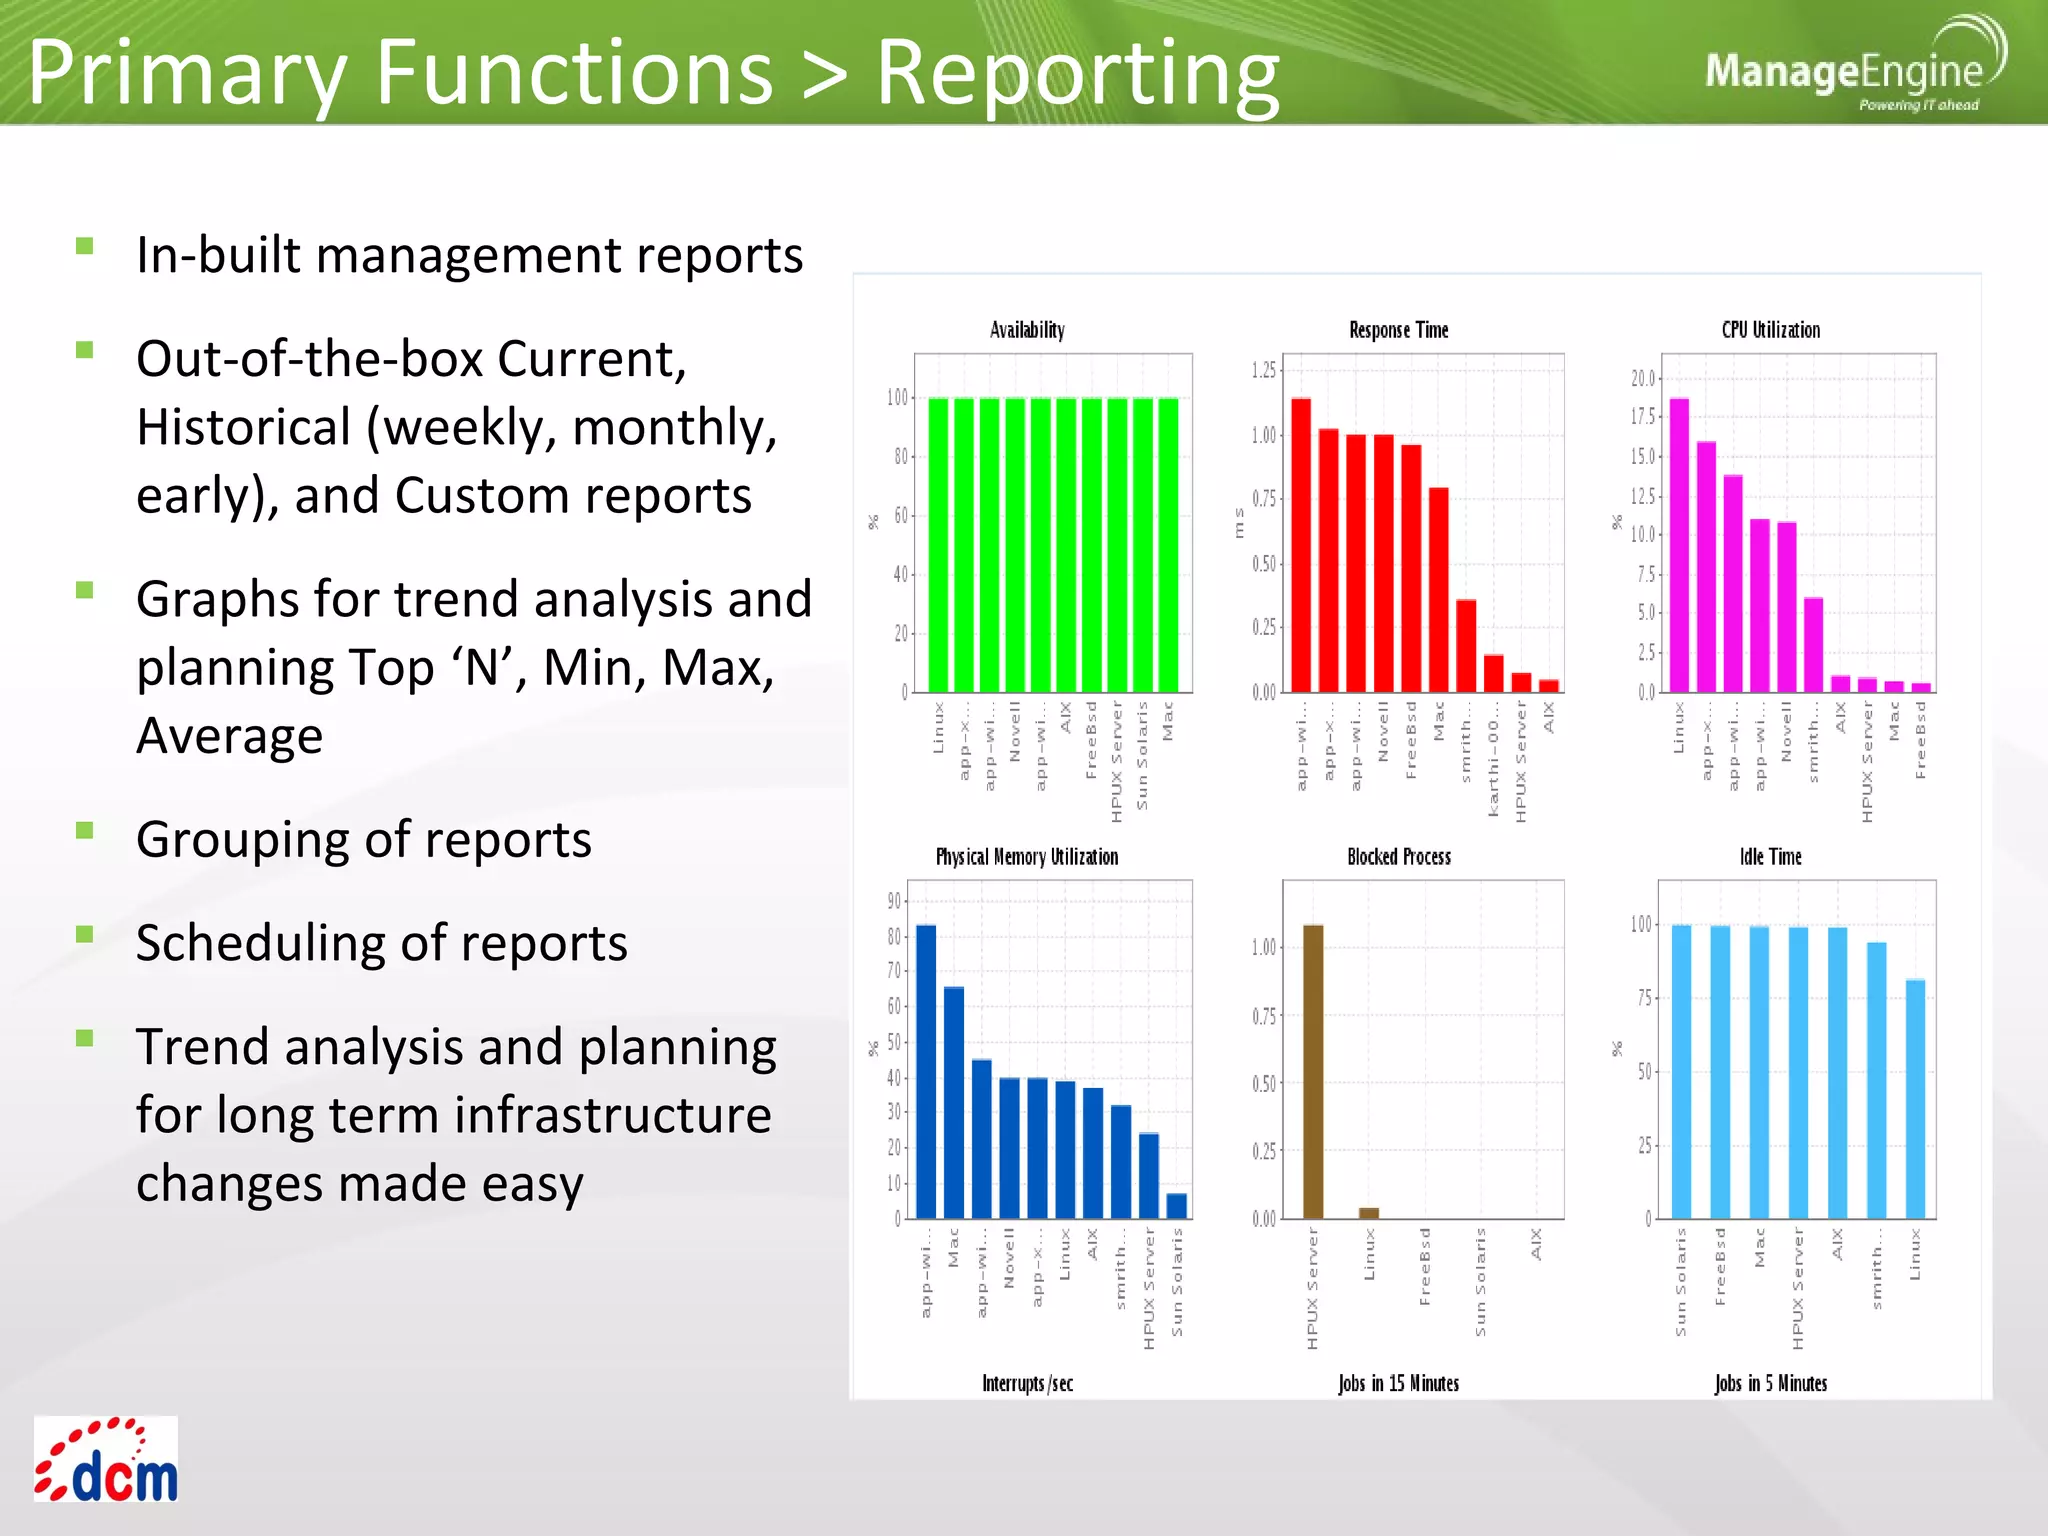
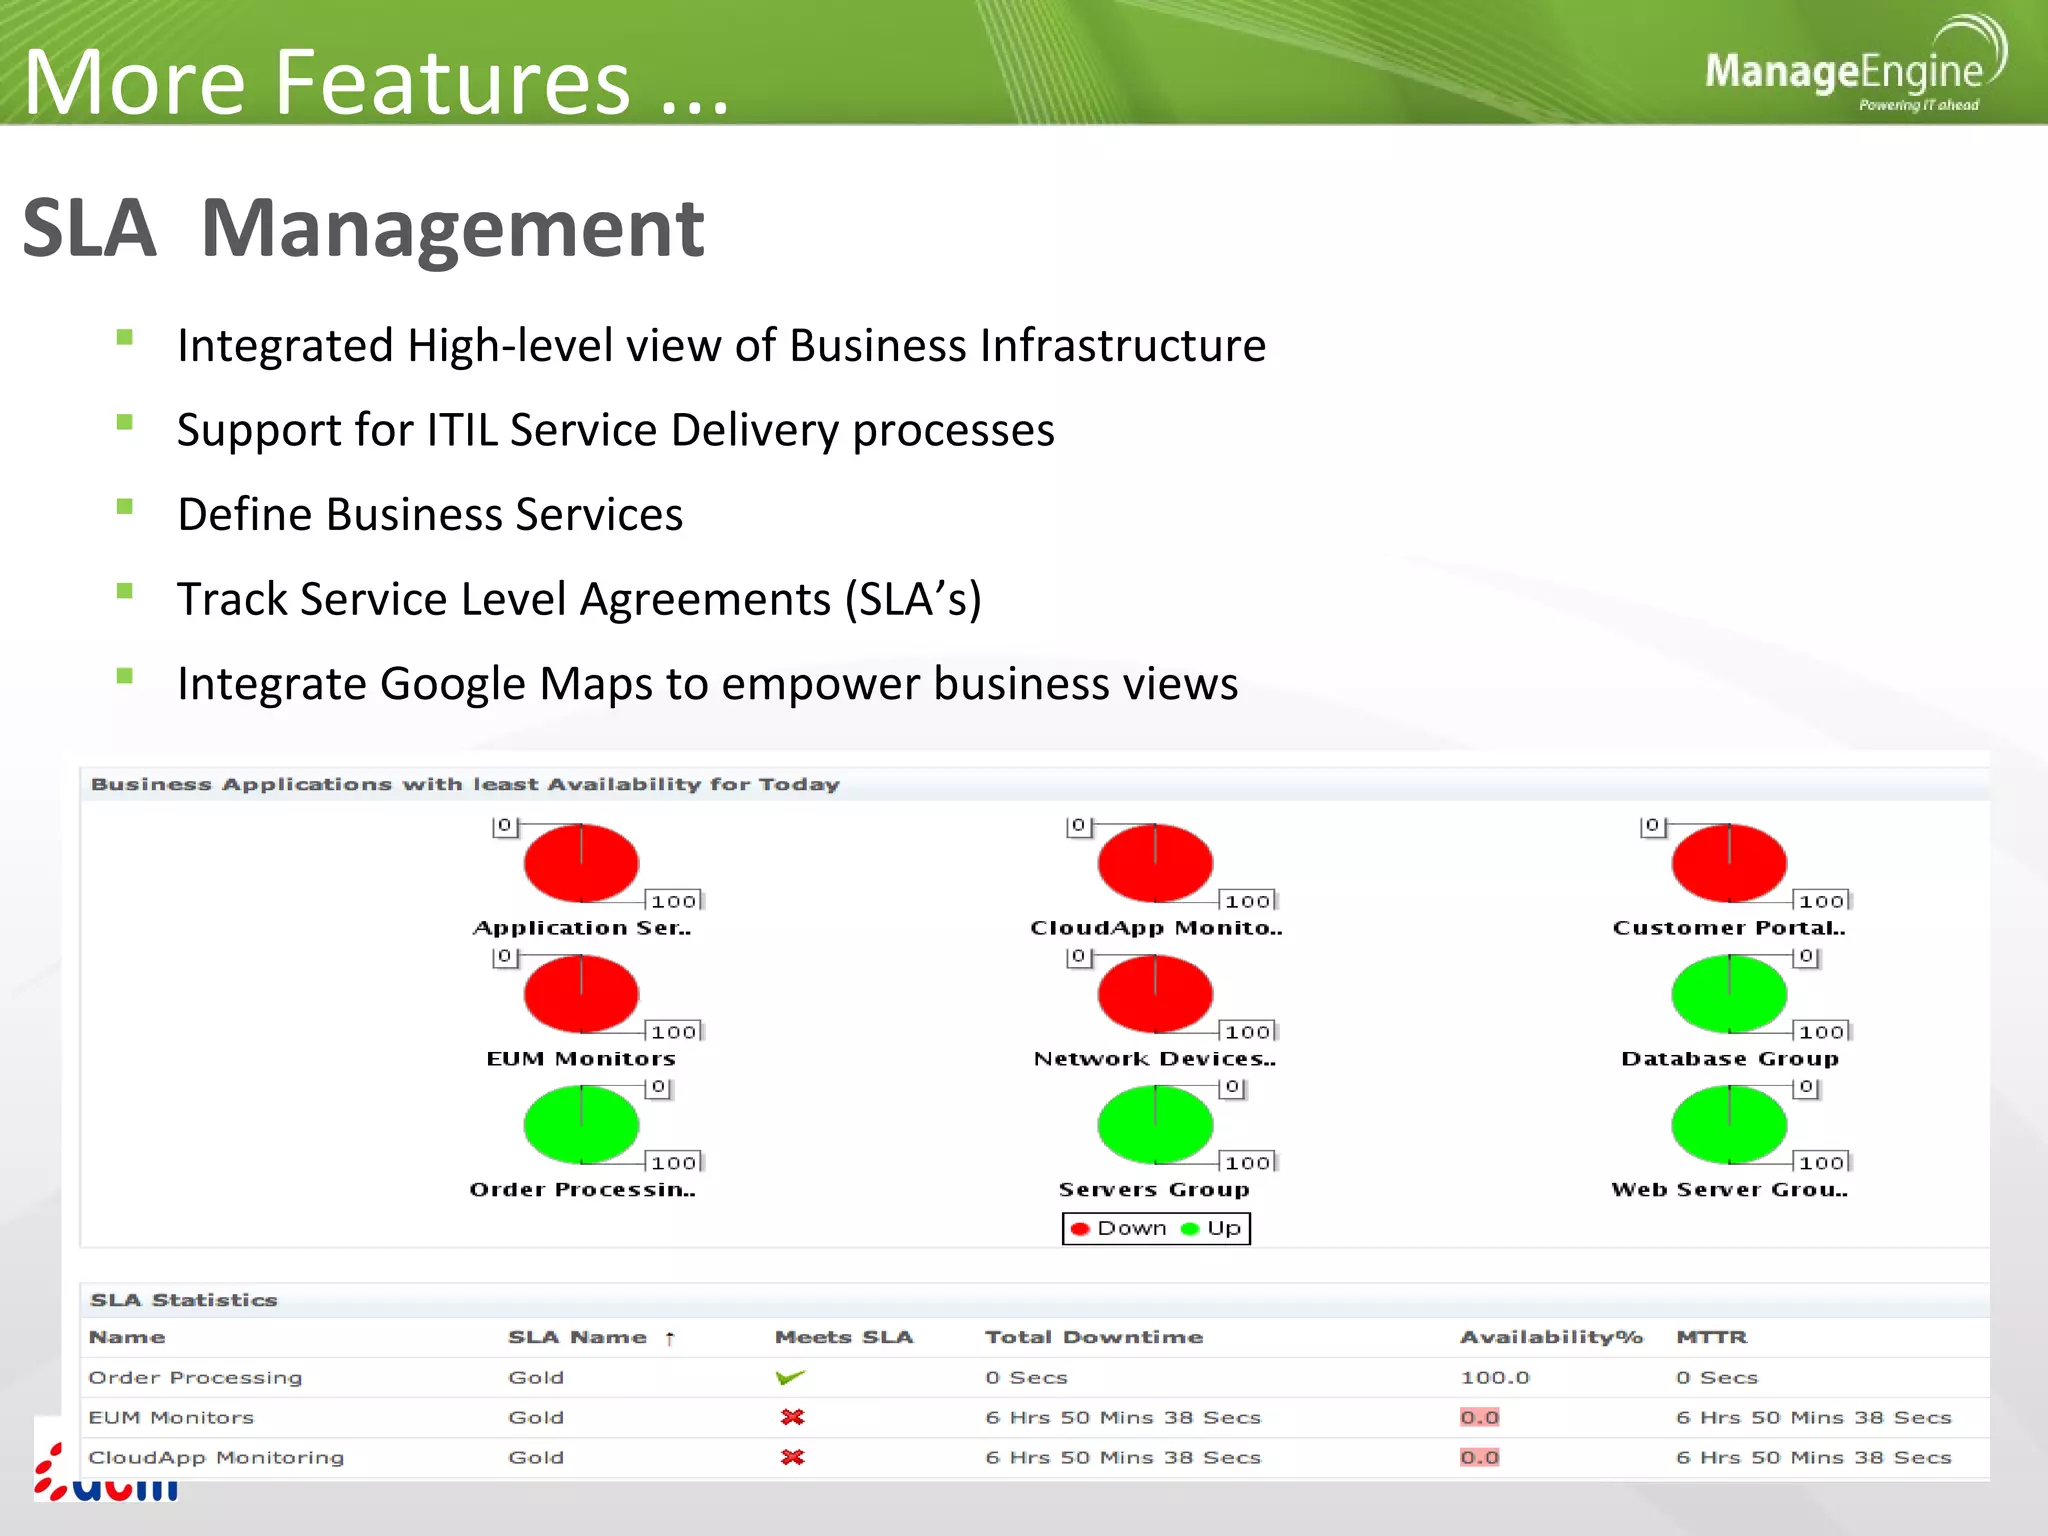
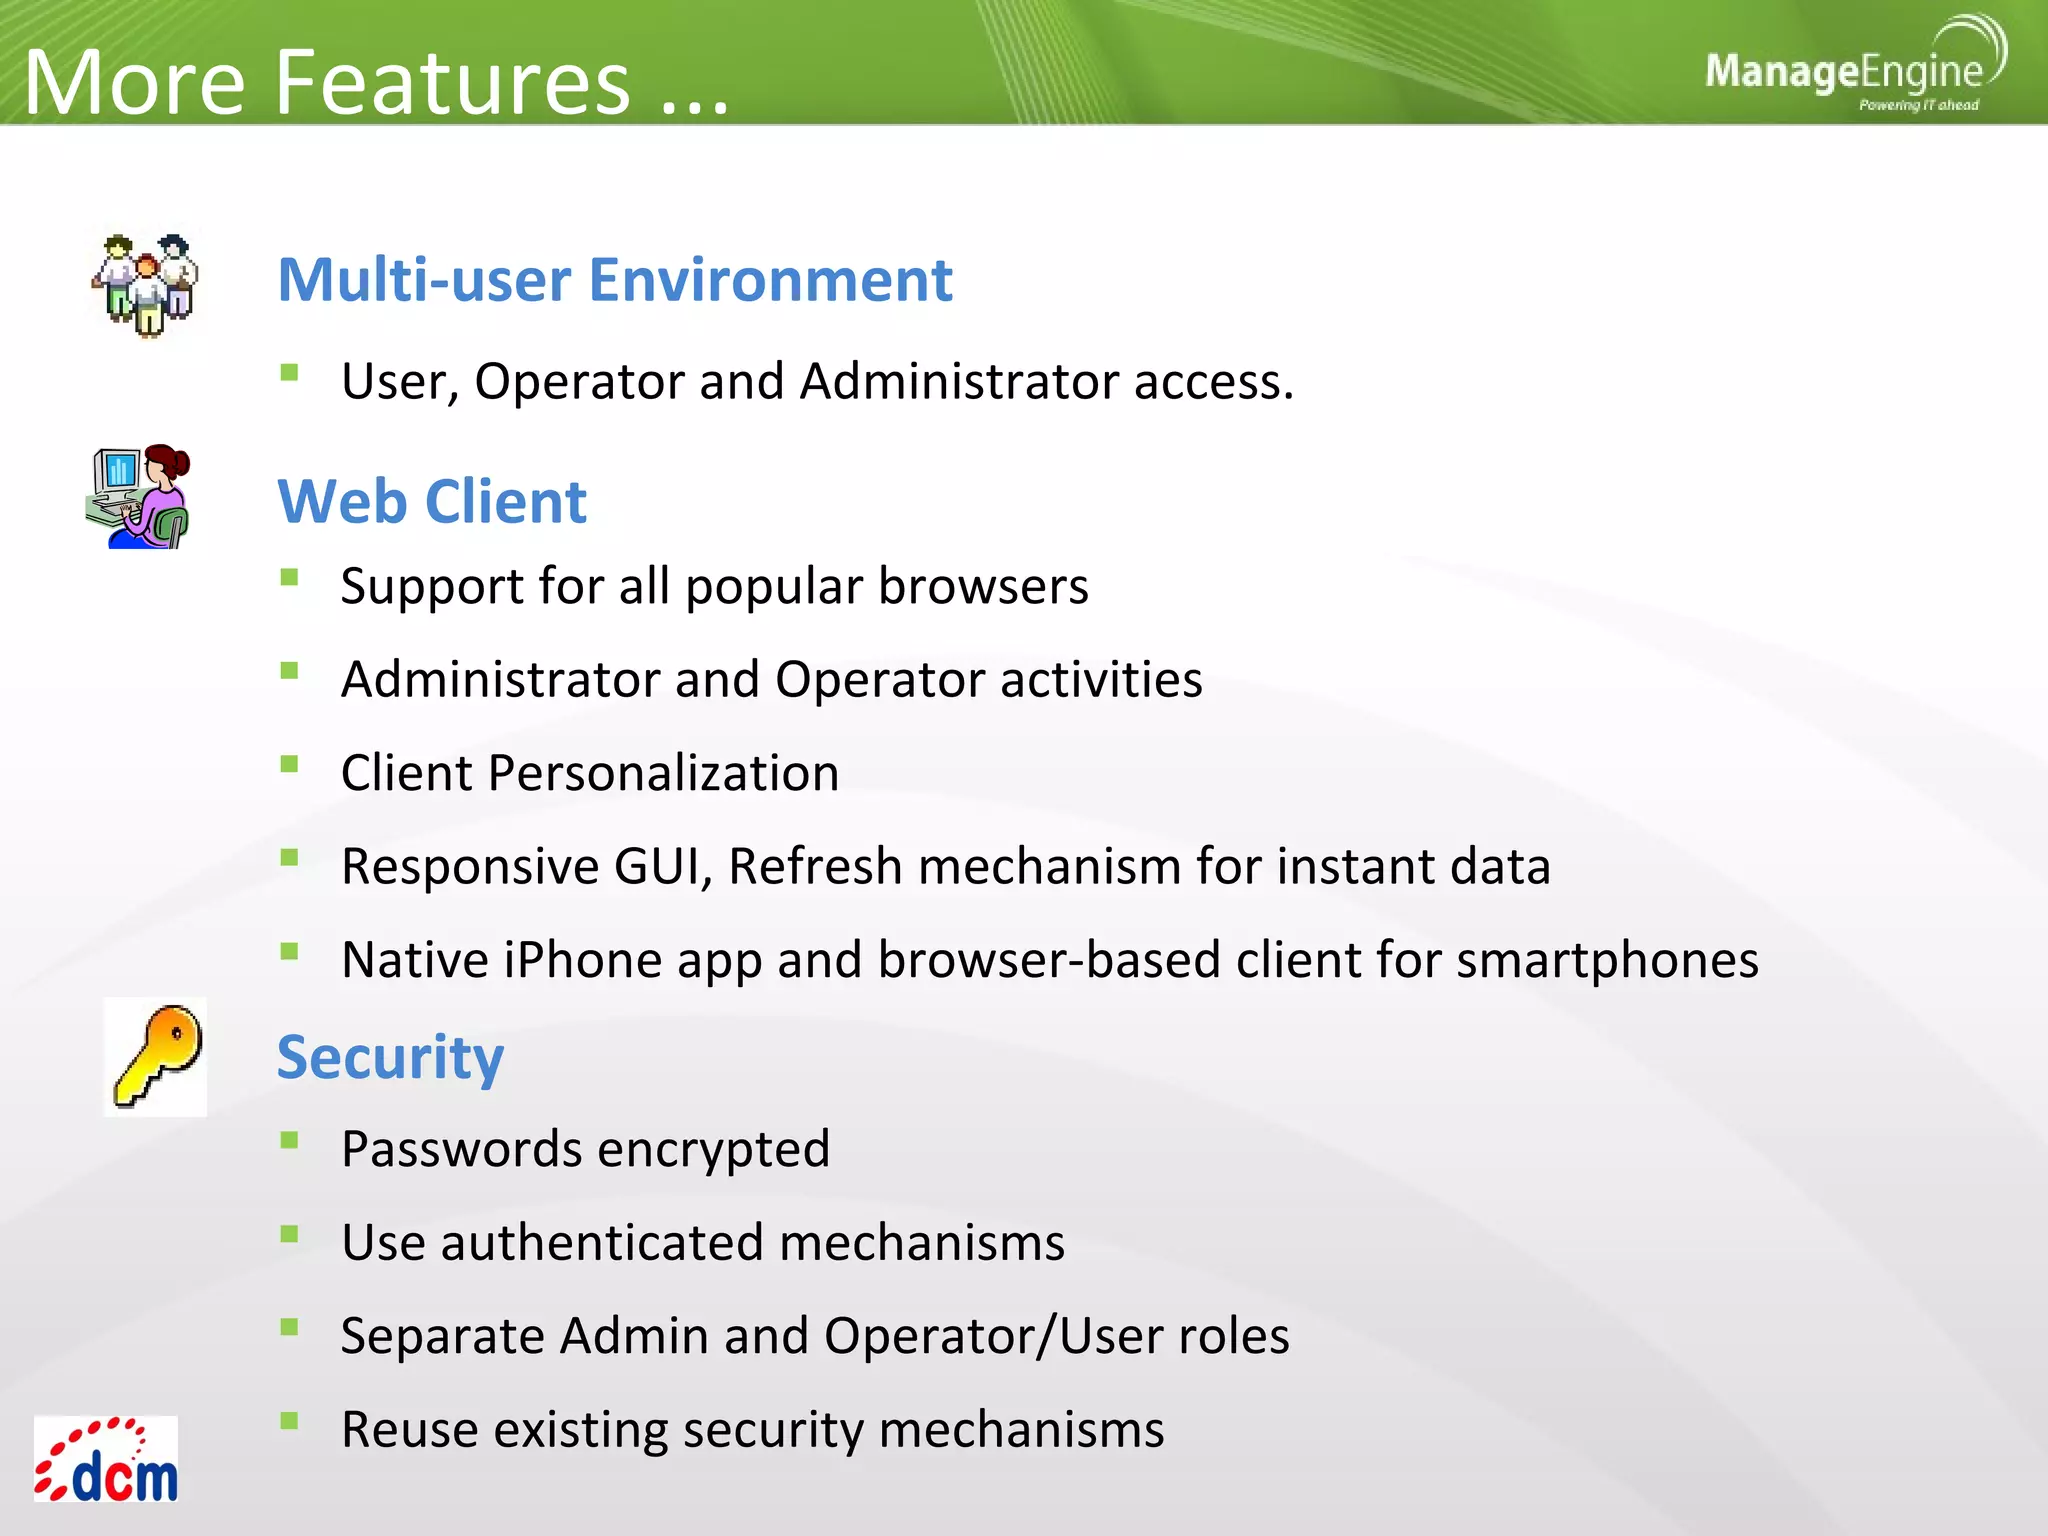
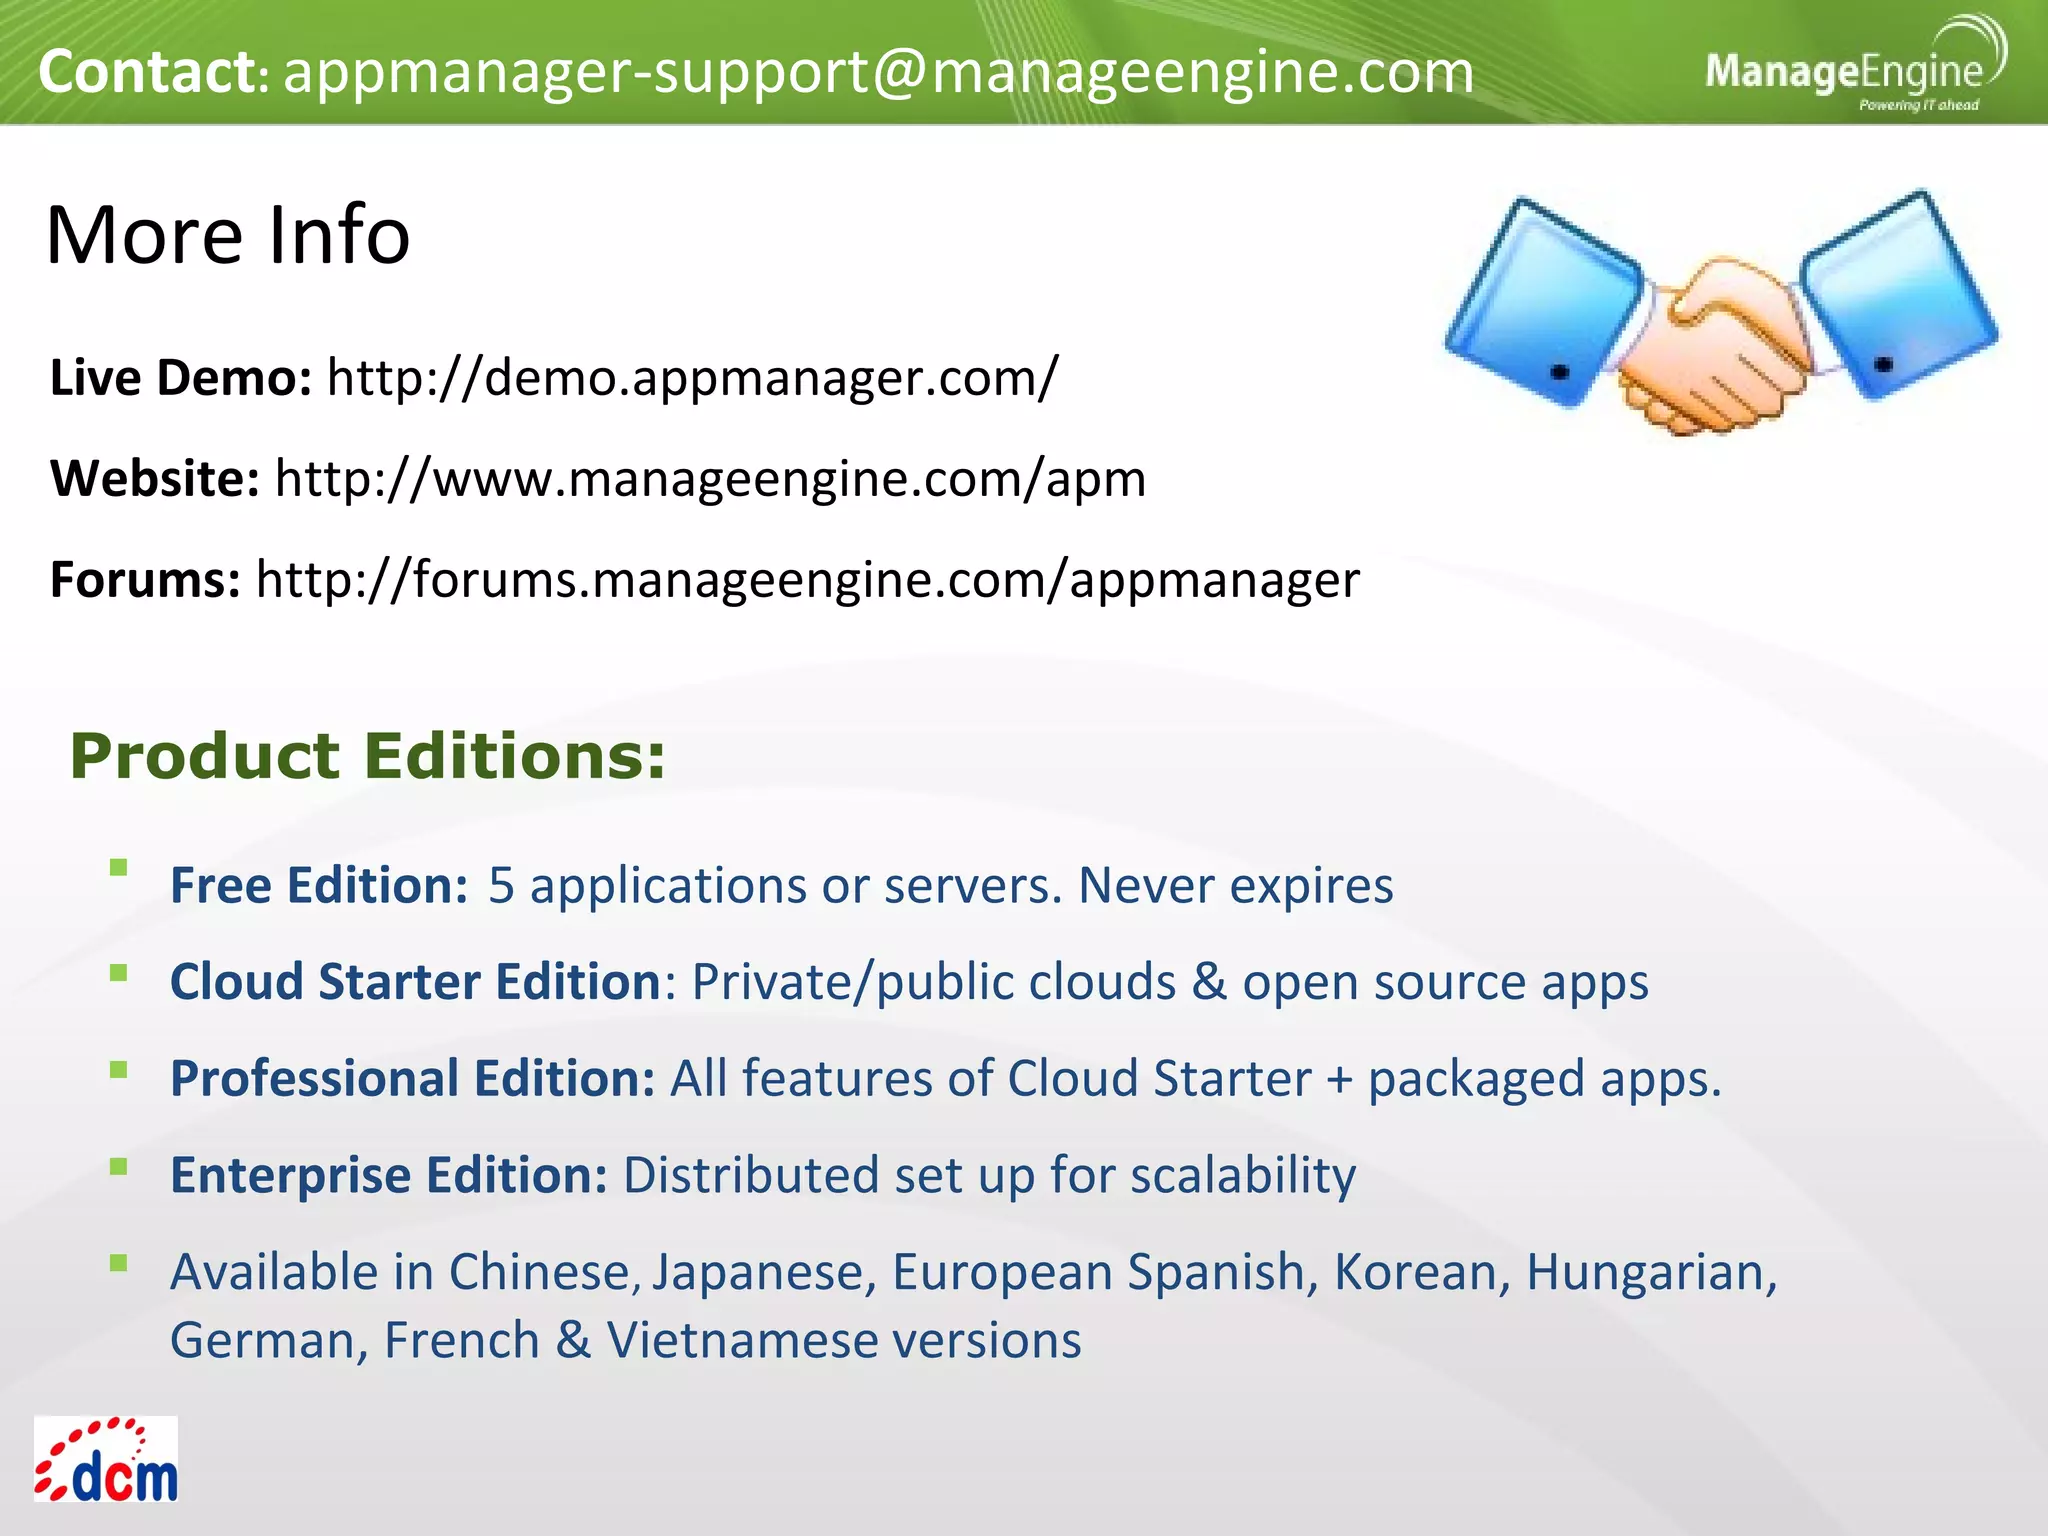
ManageEngine®
Applications Manager
Product Features
PT DAYA CIPTA MANDIRI SOLUSI
Gold Partner ManageEngine since 2005
www.dayaciptamandiri.com
Applications Manager - The Solution
Monitors your entire IT infrastructure including applications,
servers, databases, operating systems, network services,
transactions and more - across physical, virtual and cloud
environments.
Primary Positioning: Enterprises, IDCs
Direct Users: IT Administrator, Operators, Managers
Primary Functions
Agentless Monitoring of Heterogeneous Infrastructure
Primary Functions
 Unified view of business infrastructure
 Monitor diverse applications & servers
 Application Servers
 Servers
 Databases
 Systems & services
 ERP
 Middleware/portal
 Custom apps
 Websites, web services
 Web transactions
 Virtual resources
 Cloud apps
Primary Functions > Monitoring
Application Servers
 Microsoft .NET
 Oracle WebLogic
 SliverStream
 GlassFish
 VMware vFabric tc Server
 IBM WebSphere
 JBoss
 Tomcat
 Oracle AS
 Health & Availability
 User Requests, Active Sessions
 Network Traffic
 Abandoned, pending Transactions
 Memory Usage : Heap
 Thread Pools
Application Servers
Microsoft .NET
Primary Functions > Monitoring
 Health & Availability
 Gain visibility into Application Server
Performance
 JVM Statistics
 Web Applications Stats: Sessions
 Execution count, time for EJBs, Servlets, JSPs
 Thread Pools
 Database Connection Pools: active, leaked
Application Servers
Oracle WebLogic
Primary Functions > Monitoring
 Health & Availability
 Response Times
 JVM memory, CPU
 Web Applications: User Sessions
 EJB Stats: activation, passivation times
 Servlets, JSPs
 Thread Pools & Database Connection Pools
Primary Functions > Monitoring
Application Servers
IBM WebSphere
 Response time
 Health & Availability
 JVM Statistics
 Web Applications
 EJBs, Servlets, JSPs
 Thread Pools & Database
Connection Pools
Primary Functions > Monitoring
Application Servers
JBoss Server
 Oracle AS 10g
 Response time
 Health & Availability
 OPMN Process Memory
 JVM Statistics
 Request Throughput
 Web Applications: Sessions, Throughput
 JMS: Message Queues etc
Primary Functions > Monitoring
Application Servers
Oracle Server
 Response time,
 Health & Availability
 JVM Statistics
 Web Applications: Sessions
 Servlets, JSPs
 Response Summary
 Threads Availability
Primary Functions > Monitoring
Application Servers
Tomcat
Primary Functions > Monitoring
Application Servers
VMware vFabric tc Server
 Health, Availability & Performance
 Memory Usage
 Web Applications: Sessions
 Request Processed: Throughput
 Transaction Rate
 Threads Availability
 Cache Memory Usage
Primary Functions > Monitoring
Web Transactions
Java, Ruby on Rails, .Net
Primary Functions > Monitoring
Web Transactions
Java, Ruby on Rails, .Net
 Apdex scores
 Transaction tracing
 Metrics from URL to SQL query
 Database metrics
 Slow transactions
 Throughput
 Out-of-the-box remote Monitoring
& Mgmt on Java platform and of
applications that run on it
 Process Memory Parameters
 Thread Parameters
 Virtual Memory Parameters
Primary Functions > Monitoring
Application Servers
Java Runtime Monitor
 Oracle
 MySQL
 MS SQL Server
 IBM DB2
 Sybase
 PostgreSQL
 Memcached
 Cassandra
 MongoDB
Primary Functions > Monitoring
Databases
 Oracle 8.x, 9i, 10g
 Performance, health and
availability
 Table Space
 SGA
 Data file details
 Uses JDBC calls to collect data
Primary Functions > Monitoring
Databases
Oracle
 MySQL 3.x, 4.x, 5.x
 Response time
 Health
 Availability
 Request statistics
 Server tuning metrics
 Database tuning metrics
Primary Functions > Monitoring
Databases
MySQL
 MS SQL Server 2000, 2005, 2008
 Response time
 Health
 Availability
 Request Statistics
 Server Tuning metrics
 Database Tuning metrics
Primary Functions > Monitoring
Databases
MS SQL
 IBM DB2 8.x
 Response time
 Health, availability
 Connection Statistics
 Transaction Statistics
 Database Tuning metrics
Primary Functions > Monitoring
Databases
IBM DB2
 Response time
 Health and availability
 Current Process
 Current Transactions
 Connection Statistics
Primary Functions > Monitoring
Databases
Sybase
 Response time, health, and
availability
 Buffer, Connection, Lock Stats
 Transaction Details
 Index Scan Details
Primary Functions > Monitoring
Databases
PostgreSQL
 Availability, health, CPU
 Cache hit ratio, memory usage,
Transactions
 Network Traffic
 Connections
 Cached items, request metrics,
etc.
Primary Functions > Monitoring
Databases
Memcached
 Storage and Operation Stats,
Operation Latency
 Pending Tasks- Commitlog,
Commands
 Cluster and Cluster Node Details
 Dropped message statistics
 Thread pool statistics
Primary Functions > Monitoring
Databases
Cassandra
 Memory, CPU Usage, Current
connection stats
 Lock current queue details, lock
active client details
 Background flush statistics
 Journaling statistics
 Replica and sharding details for
mongod and mongos device
respectively.
Primary Functions > Monitoring
Databases
MongoDB
 Windows, Linux, Solaris, IBM AIX, IBM AS400 / iSeries, HP Unix, Tru 64 Unix,
FreeBSD, Mac OS, Novell
 Exchange & other mail Servers
 Web Servers – Apache, IIS
 PHP Server
 Any TCP Port
 JMX – AdventNet & MX4J
 SNMP-enabled Software
Primary Functions > Monitoring
Server and Services
Primary Functions > Monitoring
ERP > SAP Server
 Availability
 Performance
 Background Processing
 Buffer
 Dialog
 Enqueue
 Operating System
 Spool
 Availability & Performance of SAP Business
Components such as
 Business Intelligence (BI)
 Customer Relation Manager (CRM)
 Supply Chain Management (SCM)
In addition you can also monitor,
 Connection time
 Performance attributes (all numeric
attributes)
 Status and Log attributes
Primary Functions > Monitoring
ERP > SAP CCMS
 Availability & Performance
Oracle E-Business Suite Setup
 Performance Metrics like
Request Stats, Response Time
 Process Heap Size
Primary Functions > Monitoring
ERP > Oracle E-Business
Suite
 MS SharePoint
 IBM WebSphere MQ
 BEA WebLogic Integration
 Microsoft Message Queue (MSMQ)
 VMware vFabric RabbitMQ
Primary Functions > Monitoring
Middleware / Portal
 Availability & Performance
 Comprehensive Fault Management
 Pro-Active Alert notifications
 Active Server Pages
 Memory Stats
 Share Point Server Services
Primary Functions > Monitoring
Middleware / Portal
MS Office SharePoint
 Health, Availability & Performance
 Channel (Bytes-sent/Received, Buffers-sent/Received)
 Listener Stats
 Queue Stats
Primary Functions > Monitoring
Middleware / Portal
IBM WebSphere MQ
 Health & Availability
 Business Process Details
 Application Integration Details
 Track SLA
 Service and Event Counts
 Response Times
 Message Broker Details
Primary Functions > Monitoring
Middleware / Portal
BEA WebLogic Integration
 Health & Availability
 Message Queue Services
 Session Stats
 Microsoft Message Queue
Stats
Primary Functions > Monitoring
Middleware / Portal
Microsoft Message Queue (MSMQ)
 Health, Availability &
Performance
 Queued Messages
 Message Rates
 Node Details
 Connection Stats
 Exchange Rates
Primary Functions > Monitoring
Middleware / Portal
VMware vFabric RabbitMQ
Primary Functions > Monitoring
End User Monitoring (EUM)
Value:
 Measure end-user experience of network services & apps
 Resolve problems before end users are affected
 Easy troubleshooting
 Records transactions with IE toolbar
 Stores user actions as web scripts
 Play back web scripts from multiple
locations
Primary Functions > Monitoring
Real Browser Monitor
Value:
 High visibility into Synthetic web transactions
 Improves customer experience
 Easy troubleshooting
 Monitor ESX/ESXi servers & guest VMs
 In-depth performance metrics
 Find out which VMs are consuming
resources
 Automatically start/stop/restart VMs
Primary Functions > Monitoring
VMware Monitoring
Value:
 Gain insight into VMware performance
 Manage physical and virtual infrastructure
 Easy troubleshooting
 Monitor Hyper-V servers & guest VMs
 In-depth performance metrics
 Find out which VMs are consuming
resources
 Automatically start/stop/restart VMs
Primary Functions > Monitoring
Microsoft Hyper-V Monitoring
Value:
 Gain insight into Hyper-V performance
 Effective Capacity Planning
 Easy troubleshooting
Primary Functions > Monitoring
Public Cloud–>Amazon AWS
 CPU Utilization
 Network Traffic
 Disk I/O
 Volume Traffic, Latency
 Bandwidth
 Throughput
Monitor Amazon EC2, RDS instances & attached EBS volumes
Value:
Gain insight into performance of Amazon AWS account and apps running on it.
Primary Functions > Monitoring
Public Cloud –> Windows Azure
 Request execution time
 Requests rejected
 Infrastructure logs
 Trace & event logs
 Network traffic
 TCP connections
 VMs in Azure roles
Monitor Web, Worker and VM roles
 Build Custom Screens for
Management Bean (MBeans)
 Monitor custom applications that
provides management information
via JMX 1.2 (JDK1.5 or MX4J) &
SNMP
 Consoles for JMX Agents
 Monitor any SNMP Agent
 Trap Listener
Primary Functions > Monitoring
Custom Application Management
 URL [HTML, PHP, JSP,
ASP .NET Availability
 URL Sequence Monitor
 URL Content Monitor
Primary Functions > Monitoring
Website / Web Application Monitoring
 Monitors performance
statistics such as availability
and response time.
Primary Functions > Monitoring
Active Directory Monitoring
 System and Performance Counter Monitor are
also monitored in Active Directory monitor.
 Active Directory monitor allows user to monitor
NTLM authentications, and Replication Traffic
In/Out in Bytes.
 Monitors availability and
performance monitoring of DNS
(Domain Name System)
Primary Functions > Monitoring
DNS Monitoring
 Monitors performance statistics
such as response time. These
performance statistics are available
as performance graphs and reports
which are available instantly. These
reports can be grouped and
displayed based on availability and
health.
Primary Functions > Monitoring
LDAP Monitoring
Monitors availability and performance of LDAP server
Primary Functions > Monitoring
FTP/sFTP Monitoring
 Execute custom
Windows/Linux scripts
 Monitor the output of the
scripts
 Generate alerts and actions
according
to thresholds configured
Primary Functions > Monitoring
Script Monitoring
 Monitors Business Metrics using custom SQL queries
 Monitors additional performance metrics from time to time to ensure
full time availability of a particular database
Primary Functions > Monitoring
Database Query Monitoring
 Monitors performance of
SQL Query
Primary Functions > Monitoring
User Defined Monitor Types
 Create your own monitor type
 Script Monitor is the underlying Engine
 Siebel Monitoring, Business Intelligence Dashboard
Primary Functions
Primary Functions > Alerting
 In-depth root cause analysis of
critical alerts
 Schedule Maintenance Window
 Bulk alert configuration
 Intelligent alarm correlation, colour
coded alarms
 Get notified through standard means
(e-mail, SMS, Etc.,)
 Automate Corrective Actions
 Forward SNMP traps to third-party consoles such as HP OV and CA Unicenter
Alert View
Primary Functions > Alerting
Root Cause Analysis
Anomaly Detection
Primary Functions > Alerting
 Anomaly profiles based on baseline value or custom expressions
 Detect gradual performance degradation
Primary Functions
 In-built management reports
 Out-of-the-box Current,
Historical (weekly, monthly,
early), and Custom reports
 Graphs for trend analysis and
planning Top ‘N’, Min, Max,
Average
 Grouping of reports
 Scheduling of reports
 Trend analysis and planning
for long term infrastructure
changes made easy
Primary Functions > Reporting
SLA Management
 Integrated High-level view of Business Infrastructure
 Support for ITIL Service Delivery processes
 Define Business Services
 Track Service Level Agreements (SLA’s)
 Integrate Google Maps to empower business views
More Features ...
Multi-user Environment
 User, Operator and Administrator access.
Web Client
 Support for all popular browsers
 Administrator and Operator activities
 Client Personalization
 Responsive GUI, Refresh mechanism for instant data
 Native iPhone app and browser-based client for smartphones
Security
 Passwords encrypted
 Use authenticated mechanisms
 Separate Admin and Operator/User roles
 Reuse existing security mechanisms
More Features ...
More Info
 Free Edition: 5 applications or servers. Never expires
 Cloud Starter Edition: Private/public clouds & open source apps
 Professional Edition: All features of Cloud Starter + packaged apps.
 Enterprise Edition: Distributed set up for scalability
 Available in Chinese, Japanese, European Spanish, Korean, Hungarian,
German, French & Vietnamese versions
Product Editions:
Contact: appmanager-support@manageengine.com
Live Demo: http://demo.appmanager.com/
Website: http://www.manageengine.com/apm
Forums: http://forums.manageengine.com/appmanager

Fitur AppManager - Application Manager ManageEngine

  • 1.
    ManageEngine® Applications Manager Product Features PTDAYA CIPTA MANDIRI SOLUSI Gold Partner ManageEngine since 2005 www.dayaciptamandiri.com
  • 2.
    Applications Manager -The Solution Monitors your entire IT infrastructure including applications, servers, databases, operating systems, network services, transactions and more - across physical, virtual and cloud environments. Primary Positioning: Enterprises, IDCs Direct Users: IT Administrator, Operators, Managers
  • 3.
  • 4.
    Agentless Monitoring ofHeterogeneous Infrastructure
  • 5.
  • 6.
     Unified viewof business infrastructure  Monitor diverse applications & servers  Application Servers  Servers  Databases  Systems & services  ERP  Middleware/portal  Custom apps  Websites, web services  Web transactions  Virtual resources  Cloud apps Primary Functions > Monitoring
  • 7.
    Primary Functions >Monitoring Application Servers  Microsoft .NET  Oracle WebLogic  SliverStream  GlassFish  VMware vFabric tc Server  IBM WebSphere  JBoss  Tomcat  Oracle AS
  • 8.
     Health &Availability  User Requests, Active Sessions  Network Traffic  Abandoned, pending Transactions  Memory Usage : Heap  Thread Pools Application Servers Microsoft .NET Primary Functions > Monitoring
  • 9.
     Health &Availability  Gain visibility into Application Server Performance  JVM Statistics  Web Applications Stats: Sessions  Execution count, time for EJBs, Servlets, JSPs  Thread Pools  Database Connection Pools: active, leaked Application Servers Oracle WebLogic Primary Functions > Monitoring
  • 10.
     Health &Availability  Response Times  JVM memory, CPU  Web Applications: User Sessions  EJB Stats: activation, passivation times  Servlets, JSPs  Thread Pools & Database Connection Pools Primary Functions > Monitoring Application Servers IBM WebSphere
  • 11.
     Response time Health & Availability  JVM Statistics  Web Applications  EJBs, Servlets, JSPs  Thread Pools & Database Connection Pools Primary Functions > Monitoring Application Servers JBoss Server
  • 12.
     Oracle AS10g  Response time  Health & Availability  OPMN Process Memory  JVM Statistics  Request Throughput  Web Applications: Sessions, Throughput  JMS: Message Queues etc Primary Functions > Monitoring Application Servers Oracle Server
  • 13.
     Response time, Health & Availability  JVM Statistics  Web Applications: Sessions  Servlets, JSPs  Response Summary  Threads Availability Primary Functions > Monitoring Application Servers Tomcat
  • 14.
    Primary Functions >Monitoring Application Servers VMware vFabric tc Server  Health, Availability & Performance  Memory Usage  Web Applications: Sessions  Request Processed: Throughput  Transaction Rate  Threads Availability  Cache Memory Usage
  • 15.
    Primary Functions >Monitoring Web Transactions Java, Ruby on Rails, .Net
  • 16.
    Primary Functions >Monitoring Web Transactions Java, Ruby on Rails, .Net  Apdex scores  Transaction tracing  Metrics from URL to SQL query  Database metrics  Slow transactions  Throughput
  • 17.
     Out-of-the-box remoteMonitoring & Mgmt on Java platform and of applications that run on it  Process Memory Parameters  Thread Parameters  Virtual Memory Parameters Primary Functions > Monitoring Application Servers Java Runtime Monitor
  • 18.
     Oracle  MySQL MS SQL Server  IBM DB2  Sybase  PostgreSQL  Memcached  Cassandra  MongoDB Primary Functions > Monitoring Databases
  • 19.
     Oracle 8.x,9i, 10g  Performance, health and availability  Table Space  SGA  Data file details  Uses JDBC calls to collect data Primary Functions > Monitoring Databases Oracle
  • 20.
     MySQL 3.x,4.x, 5.x  Response time  Health  Availability  Request statistics  Server tuning metrics  Database tuning metrics Primary Functions > Monitoring Databases MySQL
  • 21.
     MS SQLServer 2000, 2005, 2008  Response time  Health  Availability  Request Statistics  Server Tuning metrics  Database Tuning metrics Primary Functions > Monitoring Databases MS SQL
  • 22.
     IBM DB28.x  Response time  Health, availability  Connection Statistics  Transaction Statistics  Database Tuning metrics Primary Functions > Monitoring Databases IBM DB2
  • 23.
     Response time Health and availability  Current Process  Current Transactions  Connection Statistics Primary Functions > Monitoring Databases Sybase
  • 24.
     Response time,health, and availability  Buffer, Connection, Lock Stats  Transaction Details  Index Scan Details Primary Functions > Monitoring Databases PostgreSQL
  • 25.
     Availability, health,CPU  Cache hit ratio, memory usage, Transactions  Network Traffic  Connections  Cached items, request metrics, etc. Primary Functions > Monitoring Databases Memcached
  • 26.
     Storage andOperation Stats, Operation Latency  Pending Tasks- Commitlog, Commands  Cluster and Cluster Node Details  Dropped message statistics  Thread pool statistics Primary Functions > Monitoring Databases Cassandra
  • 27.
     Memory, CPUUsage, Current connection stats  Lock current queue details, lock active client details  Background flush statistics  Journaling statistics  Replica and sharding details for mongod and mongos device respectively. Primary Functions > Monitoring Databases MongoDB
  • 28.
     Windows, Linux,Solaris, IBM AIX, IBM AS400 / iSeries, HP Unix, Tru 64 Unix, FreeBSD, Mac OS, Novell  Exchange & other mail Servers  Web Servers – Apache, IIS  PHP Server  Any TCP Port  JMX – AdventNet & MX4J  SNMP-enabled Software Primary Functions > Monitoring Server and Services
  • 29.
    Primary Functions >Monitoring ERP > SAP Server  Availability  Performance  Background Processing  Buffer  Dialog  Enqueue  Operating System  Spool
  • 30.
     Availability &Performance of SAP Business Components such as  Business Intelligence (BI)  Customer Relation Manager (CRM)  Supply Chain Management (SCM) In addition you can also monitor,  Connection time  Performance attributes (all numeric attributes)  Status and Log attributes Primary Functions > Monitoring ERP > SAP CCMS
  • 31.
     Availability &Performance Oracle E-Business Suite Setup  Performance Metrics like Request Stats, Response Time  Process Heap Size Primary Functions > Monitoring ERP > Oracle E-Business Suite
  • 32.
     MS SharePoint IBM WebSphere MQ  BEA WebLogic Integration  Microsoft Message Queue (MSMQ)  VMware vFabric RabbitMQ Primary Functions > Monitoring Middleware / Portal
  • 33.
     Availability &Performance  Comprehensive Fault Management  Pro-Active Alert notifications  Active Server Pages  Memory Stats  Share Point Server Services Primary Functions > Monitoring Middleware / Portal MS Office SharePoint
  • 34.
     Health, Availability& Performance  Channel (Bytes-sent/Received, Buffers-sent/Received)  Listener Stats  Queue Stats Primary Functions > Monitoring Middleware / Portal IBM WebSphere MQ
  • 35.
     Health &Availability  Business Process Details  Application Integration Details  Track SLA  Service and Event Counts  Response Times  Message Broker Details Primary Functions > Monitoring Middleware / Portal BEA WebLogic Integration
  • 36.
     Health &Availability  Message Queue Services  Session Stats  Microsoft Message Queue Stats Primary Functions > Monitoring Middleware / Portal Microsoft Message Queue (MSMQ)
  • 37.
     Health, Availability& Performance  Queued Messages  Message Rates  Node Details  Connection Stats  Exchange Rates Primary Functions > Monitoring Middleware / Portal VMware vFabric RabbitMQ
  • 38.
    Primary Functions >Monitoring End User Monitoring (EUM) Value:  Measure end-user experience of network services & apps  Resolve problems before end users are affected  Easy troubleshooting
  • 39.
     Records transactionswith IE toolbar  Stores user actions as web scripts  Play back web scripts from multiple locations Primary Functions > Monitoring Real Browser Monitor Value:  High visibility into Synthetic web transactions  Improves customer experience  Easy troubleshooting
  • 40.
     Monitor ESX/ESXiservers & guest VMs  In-depth performance metrics  Find out which VMs are consuming resources  Automatically start/stop/restart VMs Primary Functions > Monitoring VMware Monitoring Value:  Gain insight into VMware performance  Manage physical and virtual infrastructure  Easy troubleshooting
  • 41.
     Monitor Hyper-Vservers & guest VMs  In-depth performance metrics  Find out which VMs are consuming resources  Automatically start/stop/restart VMs Primary Functions > Monitoring Microsoft Hyper-V Monitoring Value:  Gain insight into Hyper-V performance  Effective Capacity Planning  Easy troubleshooting
  • 42.
    Primary Functions >Monitoring Public Cloud–>Amazon AWS  CPU Utilization  Network Traffic  Disk I/O  Volume Traffic, Latency  Bandwidth  Throughput Monitor Amazon EC2, RDS instances & attached EBS volumes Value: Gain insight into performance of Amazon AWS account and apps running on it.
  • 43.
    Primary Functions >Monitoring Public Cloud –> Windows Azure  Request execution time  Requests rejected  Infrastructure logs  Trace & event logs  Network traffic  TCP connections  VMs in Azure roles Monitor Web, Worker and VM roles
  • 44.
     Build CustomScreens for Management Bean (MBeans)  Monitor custom applications that provides management information via JMX 1.2 (JDK1.5 or MX4J) & SNMP  Consoles for JMX Agents  Monitor any SNMP Agent  Trap Listener Primary Functions > Monitoring Custom Application Management
  • 45.
     URL [HTML,PHP, JSP, ASP .NET Availability  URL Sequence Monitor  URL Content Monitor Primary Functions > Monitoring Website / Web Application Monitoring
  • 46.
     Monitors performance statisticssuch as availability and response time. Primary Functions > Monitoring Active Directory Monitoring  System and Performance Counter Monitor are also monitored in Active Directory monitor.  Active Directory monitor allows user to monitor NTLM authentications, and Replication Traffic In/Out in Bytes.
  • 47.
     Monitors availabilityand performance monitoring of DNS (Domain Name System) Primary Functions > Monitoring DNS Monitoring  Monitors performance statistics such as response time. These performance statistics are available as performance graphs and reports which are available instantly. These reports can be grouped and displayed based on availability and health.
  • 48.
    Primary Functions >Monitoring LDAP Monitoring Monitors availability and performance of LDAP server
  • 49.
    Primary Functions >Monitoring FTP/sFTP Monitoring
  • 50.
     Execute custom Windows/Linuxscripts  Monitor the output of the scripts  Generate alerts and actions according to thresholds configured Primary Functions > Monitoring Script Monitoring
  • 51.
     Monitors BusinessMetrics using custom SQL queries  Monitors additional performance metrics from time to time to ensure full time availability of a particular database Primary Functions > Monitoring Database Query Monitoring  Monitors performance of SQL Query
  • 52.
    Primary Functions >Monitoring User Defined Monitor Types  Create your own monitor type  Script Monitor is the underlying Engine  Siebel Monitoring, Business Intelligence Dashboard
  • 53.
  • 54.
    Primary Functions >Alerting  In-depth root cause analysis of critical alerts  Schedule Maintenance Window  Bulk alert configuration  Intelligent alarm correlation, colour coded alarms  Get notified through standard means (e-mail, SMS, Etc.,)  Automate Corrective Actions  Forward SNMP traps to third-party consoles such as HP OV and CA Unicenter
  • 55.
    Alert View Primary Functions> Alerting Root Cause Analysis
  • 56.
    Anomaly Detection Primary Functions> Alerting  Anomaly profiles based on baseline value or custom expressions  Detect gradual performance degradation
  • 57.
  • 58.
     In-built managementreports  Out-of-the-box Current, Historical (weekly, monthly, early), and Custom reports  Graphs for trend analysis and planning Top ‘N’, Min, Max, Average  Grouping of reports  Scheduling of reports  Trend analysis and planning for long term infrastructure changes made easy Primary Functions > Reporting
  • 59.
    SLA Management  IntegratedHigh-level view of Business Infrastructure  Support for ITIL Service Delivery processes  Define Business Services  Track Service Level Agreements (SLA’s)  Integrate Google Maps to empower business views More Features ...
  • 60.
    Multi-user Environment  User,Operator and Administrator access. Web Client  Support for all popular browsers  Administrator and Operator activities  Client Personalization  Responsive GUI, Refresh mechanism for instant data  Native iPhone app and browser-based client for smartphones Security  Passwords encrypted  Use authenticated mechanisms  Separate Admin and Operator/User roles  Reuse existing security mechanisms More Features ...
  • 61.
    More Info  FreeEdition: 5 applications or servers. Never expires  Cloud Starter Edition: Private/public clouds & open source apps  Professional Edition: All features of Cloud Starter + packaged apps.  Enterprise Edition: Distributed set up for scalability  Available in Chinese, Japanese, European Spanish, Korean, Hungarian, German, French & Vietnamese versions Product Editions: Contact: appmanager-support@manageengine.com Live Demo: http://demo.appmanager.com/ Website: http://www.manageengine.com/apm Forums: http://forums.manageengine.com/appmanager

Editor's Notes

  • #21 Server Tuning metrics : connection statistics, thread details Database Tuning metrics : table lock stats, db details –no. of tables, db size etc
  • #22 Server Tuning metrics : connection statistics, thread details Database Tuning metrics : table lock stats, db details –no. of tables, db size etc
  • #23 Server Tuning metrics : connection statistics, thread details Database Tuning metrics : table lock stats, db details –no. of tables, db size etc
  • #24 Server Tuning metrics : connection statistics, thread details Database Tuning metrics : table lock stats, db details –no. of tables, db size etc
  • #25 Server Tuning metrics : connection statistics, thread details Database Tuning metrics : table lock stats, db details –no. of tables, db size etc
  • #26 Server Tuning metrics : connection statistics, thread details Database Tuning metrics : table lock stats, db details –no. of tables, db size etc
  • #27 Server Tuning metrics : connection statistics, thread details Database Tuning metrics : table lock stats, db details –no. of tables, db size etc
  • #28 Server Tuning metrics : connection statistics, thread details Database Tuning metrics : table lock stats, db details –no. of tables, db size etc
  • #49 Using LDAP monitor, you can monitor the amount of time taken for a user to log into to a domain. By monitoring these login time, response time and availability, it allows you to ensure whether the LDAP server is up and running. When a certain threshold is breached, you are informed quickly via email/SMS and thus helping you to troubleshoot issues quickly.