Download as PDF, PPTX


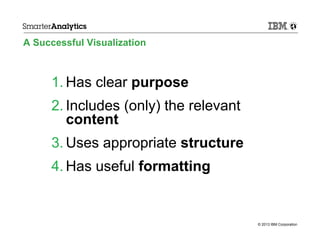
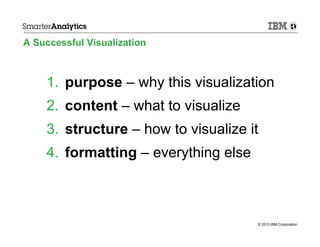


This document outlines Noah Iliinsky's four pillars of visualization success: purpose, content, structure, and formatting. It discusses each pillar in detail and provides examples to illustrate how to apply the pillars when creating effective visualizations. The key aspects are having a clear purpose that dictates the relevant content, using appropriate structures like positioning and axes to reveal relationships in the data, and applying functional formatting for the intended audience.