


![SPM 2012 PAPER 2 NO. 6
(a) Prove that [2 marks]
(b) Sketch the graph of for 0 x 2.
[3 marks]
(c) Hence, using the same axes, sketch a suitable
straight line to find the number of solutions for the
equation for 0 x 2.
State the number of solutions.
[3 marks]
12cos xy
x
x
2
sec
12cos
2
1
4sec
2
2
x
x](https://image.slidesharecdn.com/teknikmenjawabmatematiktambahan1-150118233354-conversion-gate02/75/Teknik-menjawab-matematik-tambahan-1-39-2048.jpg)


![SPM 2011 PAPER 2 NO. 6
(a) Sketch the graph of for 0 x 2 .
[4 marks]
(b) Hence, using the same axes, sketch a suitable straight line to find the
number of solutions for the equation for 0 x 2 .
State the number of solutions.
[3 marks]
xy
2
3
sin3
0
2
3
sin3 x
x
](https://image.slidesharecdn.com/teknikmenjawabmatematiktambahan1-150118233354-conversion-gate02/75/Teknik-menjawab-matematik-tambahan-1-43-2048.jpg)


![SPM 2010 PAPER 2 NO.
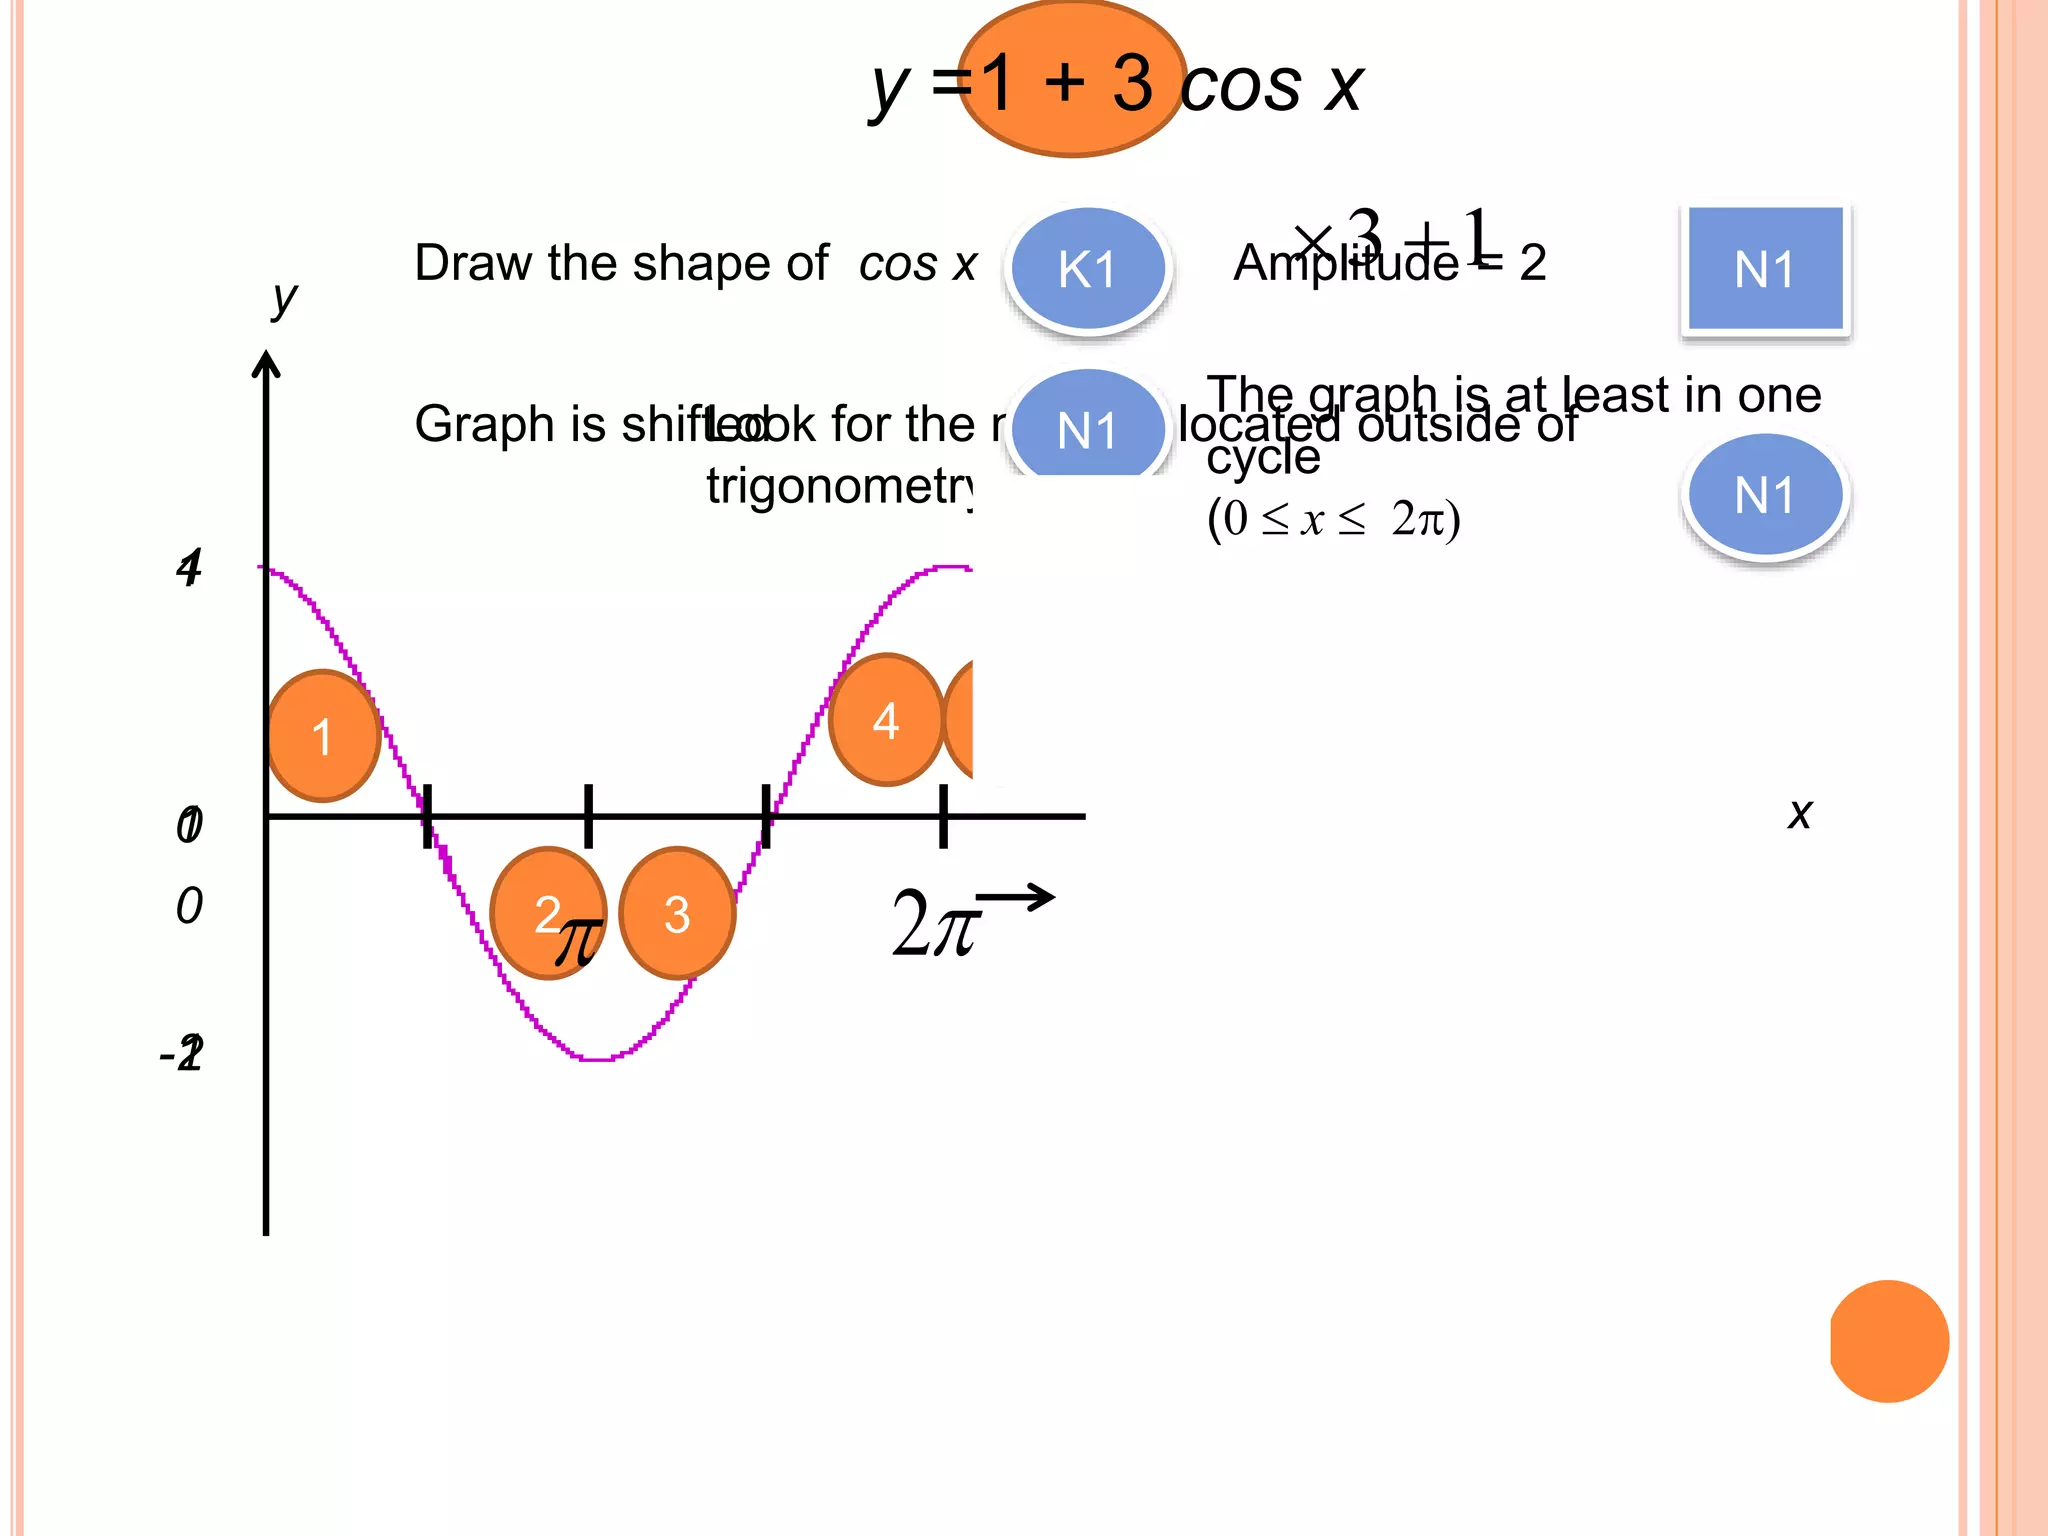
(a) Sketch the graph of y = 1 + 3 cos x for 0 x 2.
[4 marks]
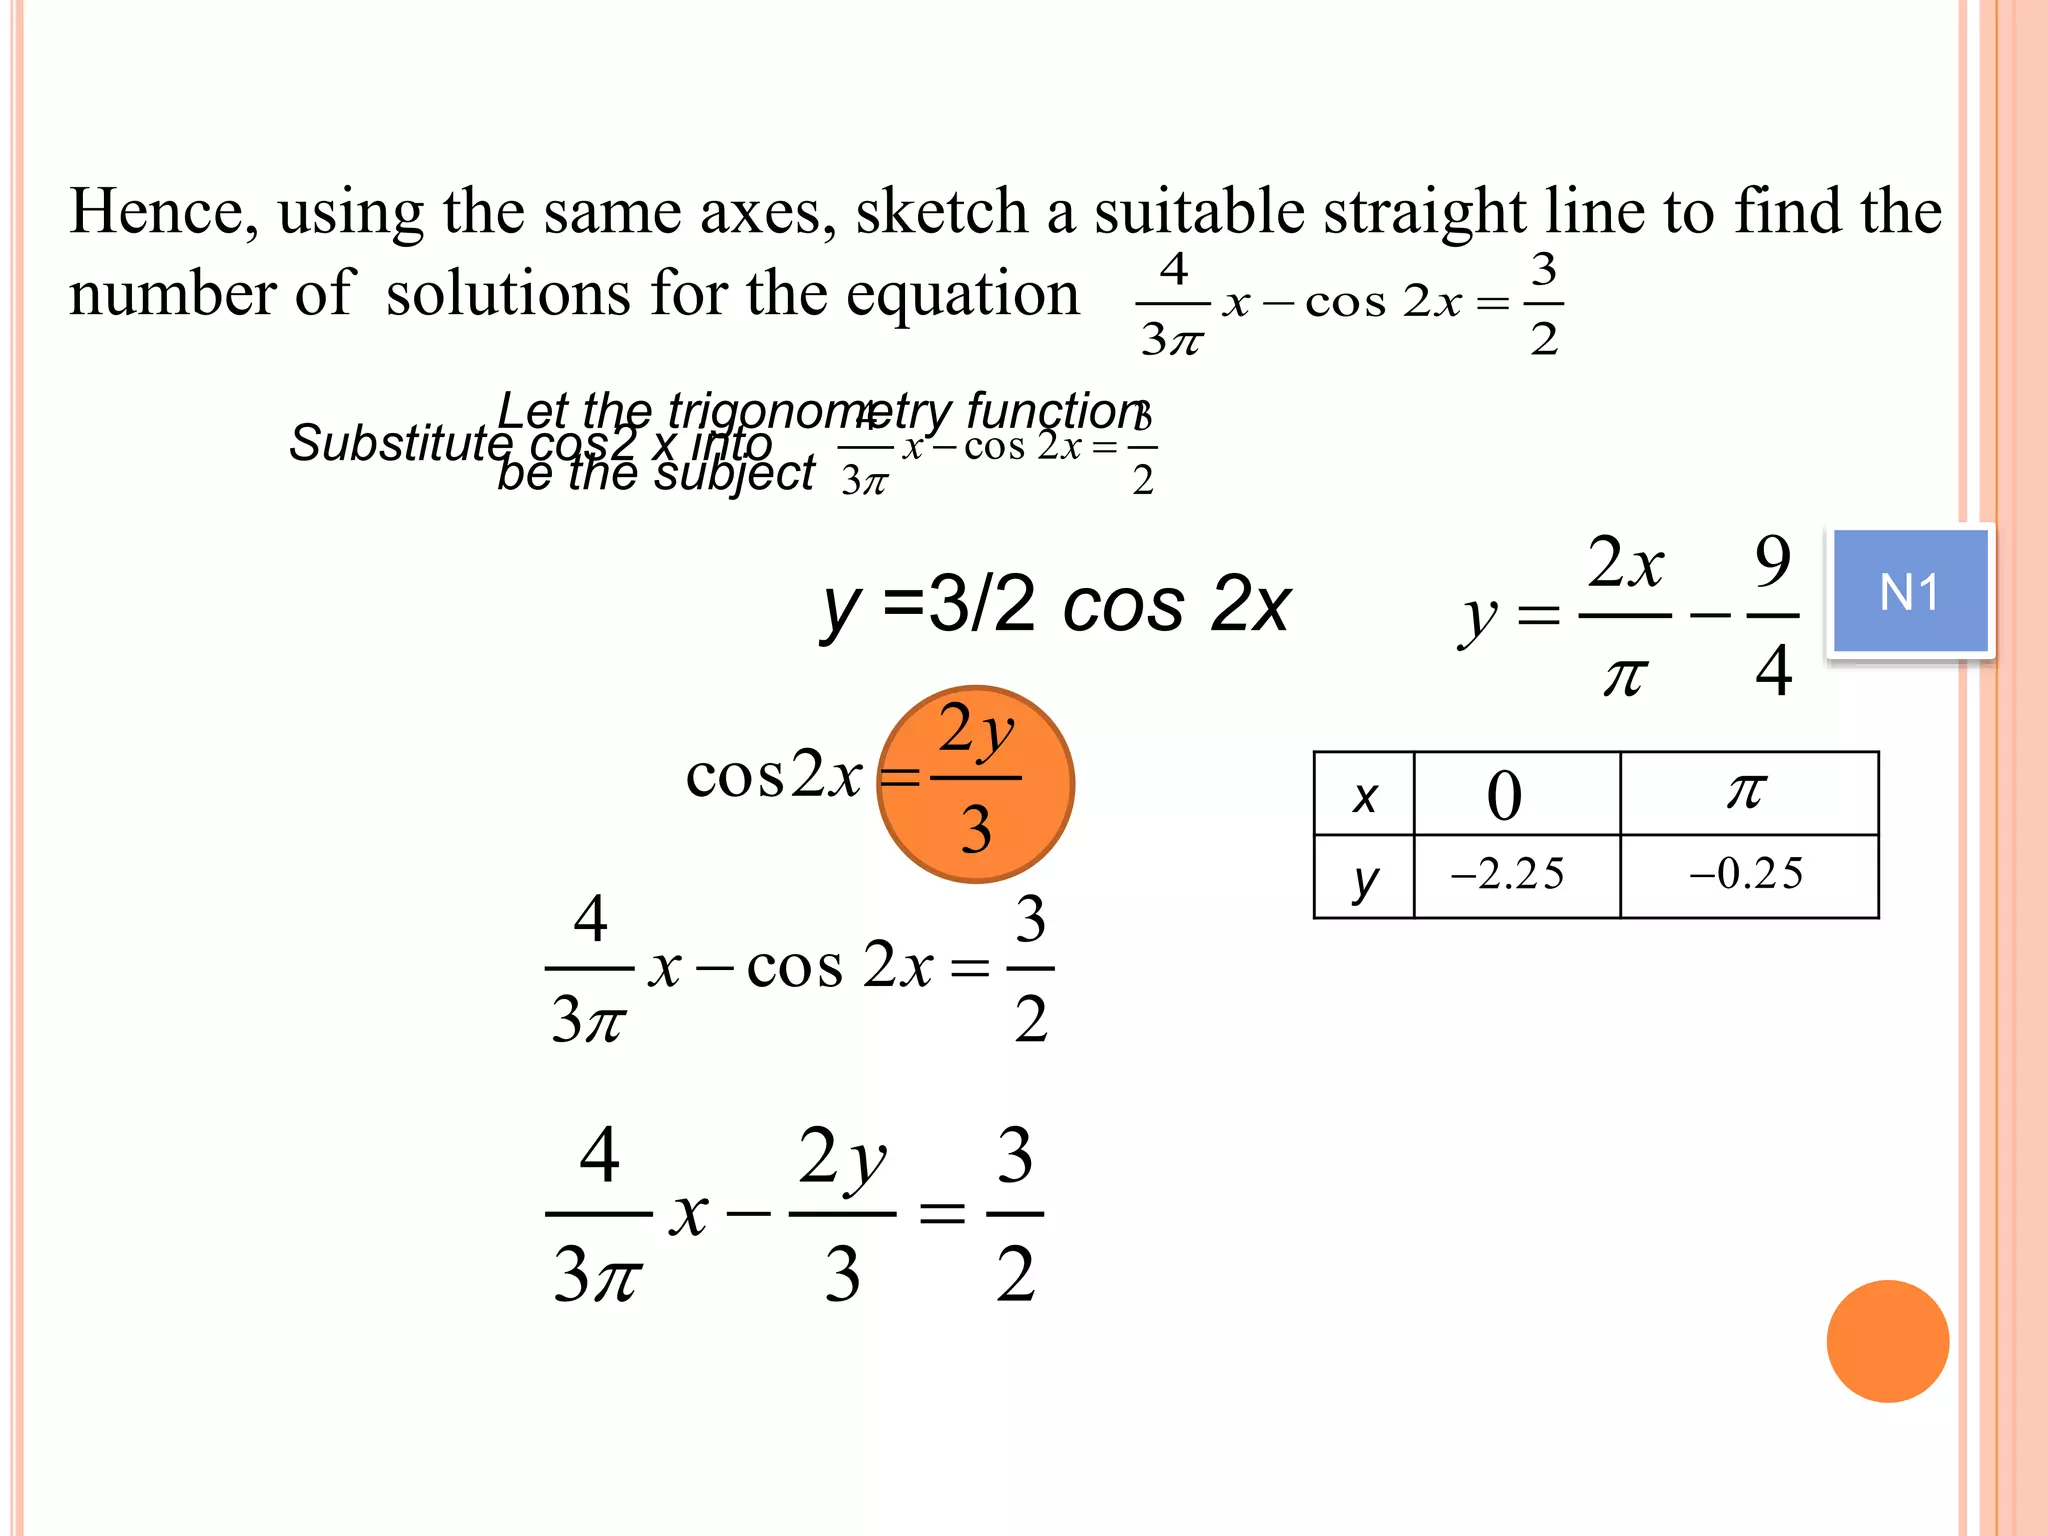
(b) Hence, using the same axes, sketch a suitable
straight line to find the number of solutions for the
equation for 0 x 2.
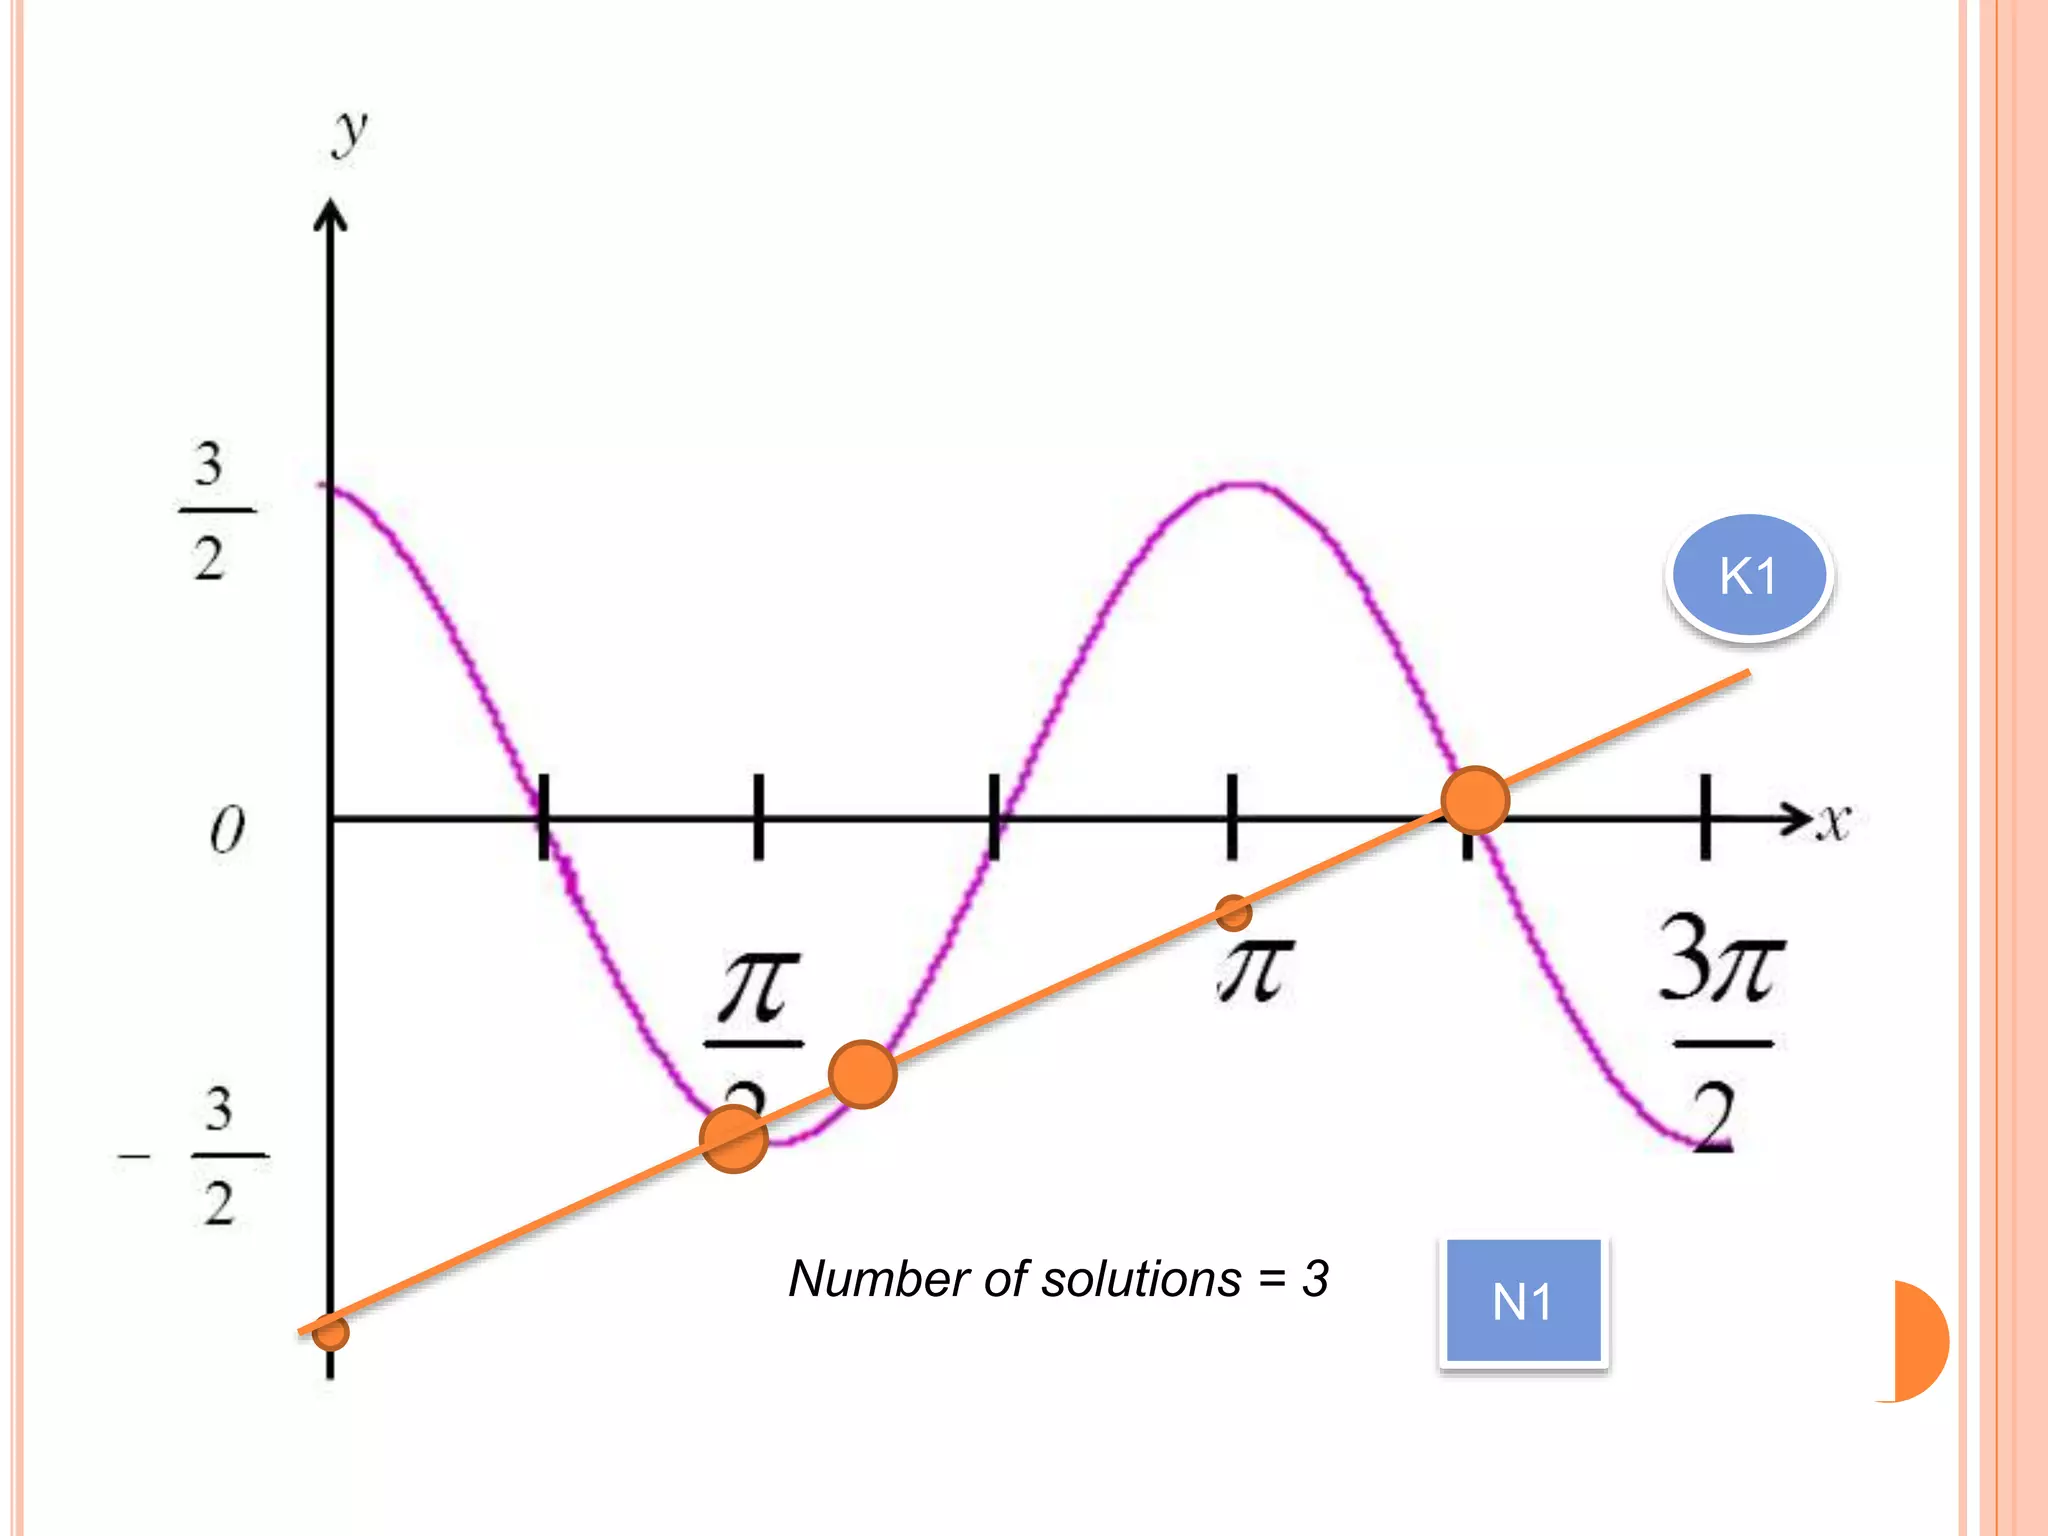
State the number of solutions.
[3 marks]
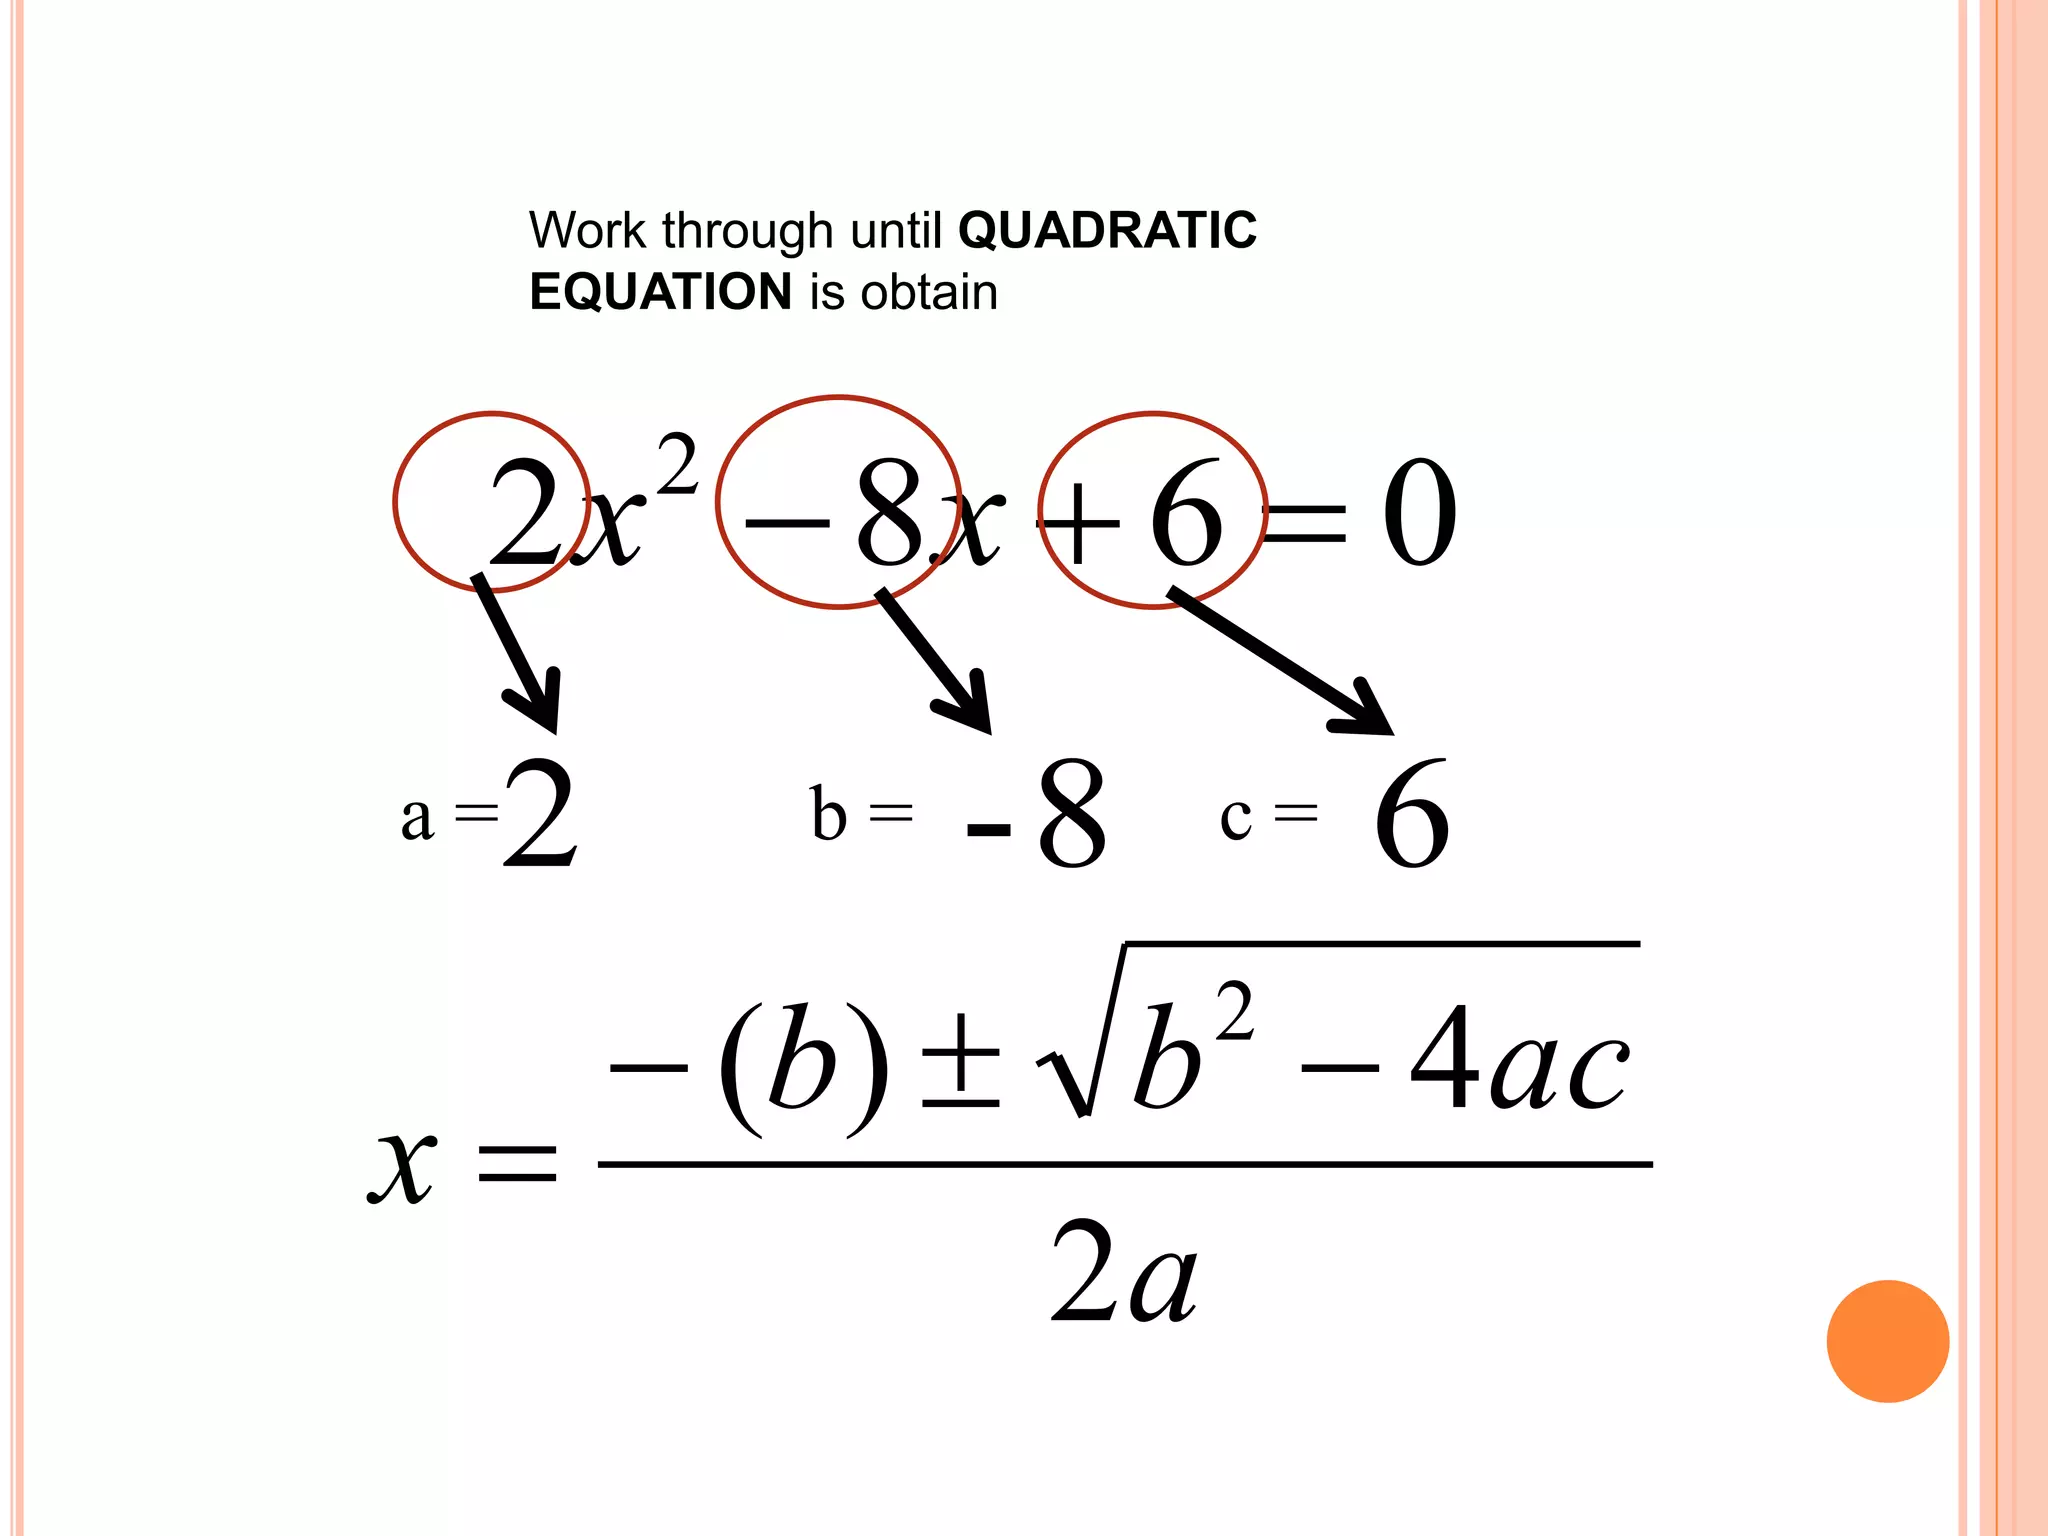
xx 34cos6 ](https://image.slidesharecdn.com/teknikmenjawabmatematiktambahan1-150118233354-conversion-gate02/75/Teknik-menjawab-matematik-tambahan-1-47-2048.jpg)

![SPM 2009 PAPER 2 NO.
(a) Sketch the graph of for 0 x 3/2 .
[3 marks]
(b) Hence, using the same axes, sketch a suitable straight line to find the
number of solutions for the equation for 0 x 3/2 .
State the number of solutions.
[3 marks]
xy 2cos
2
3
2
3
2cos
3
4
xx
](https://image.slidesharecdn.com/teknikmenjawabmatematiktambahan1-150118233354-conversion-gate02/75/Teknik-menjawab-matematik-tambahan-1-50-2048.jpg)

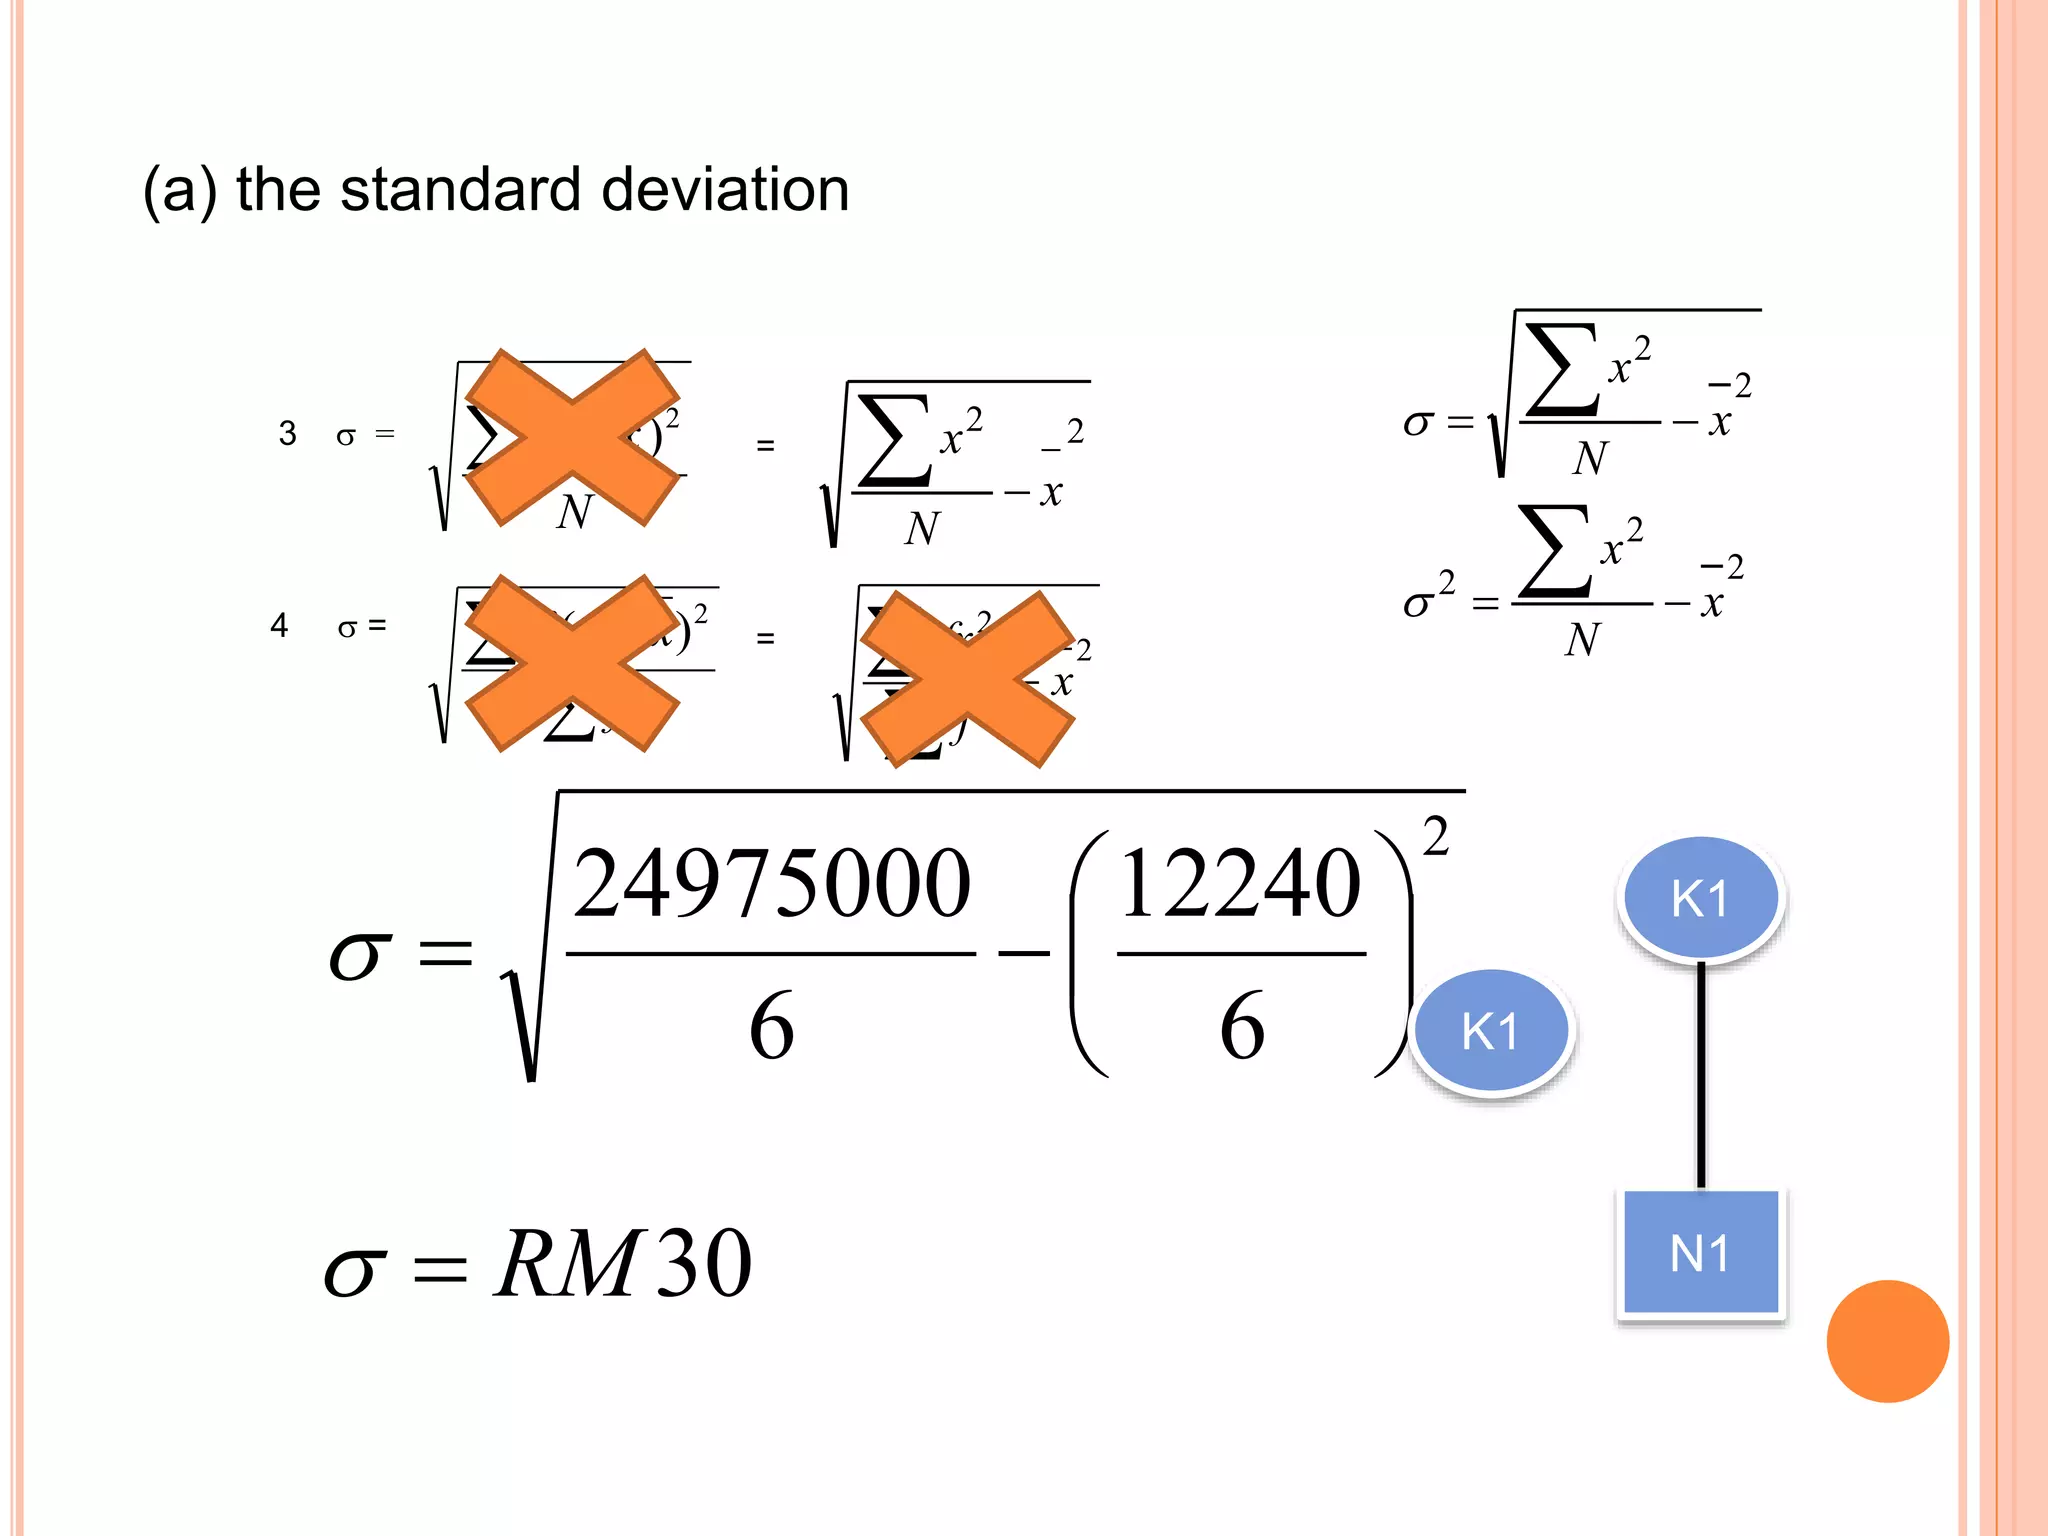
![Table shows the sum and the sum of squares of x, where x is the
monthly income, in RM, of Mr. Ahmad for the first 6 months of the year
2012
(a) Find the standard deviation of his monthly income [3 marks]
(b) If Mr. Ahmad’s son gives him RM500 every month during that
period, find the new mean and standard deviation of his monthly
income [3 marks]
SPM 2012 NO. 4: STATISTICS
∑x 12240
24975000 2
x](https://image.slidesharecdn.com/teknikmenjawabmatematiktambahan1-150118233354-conversion-gate02/75/Teknik-menjawab-matematik-tambahan-1-54-2048.jpg)


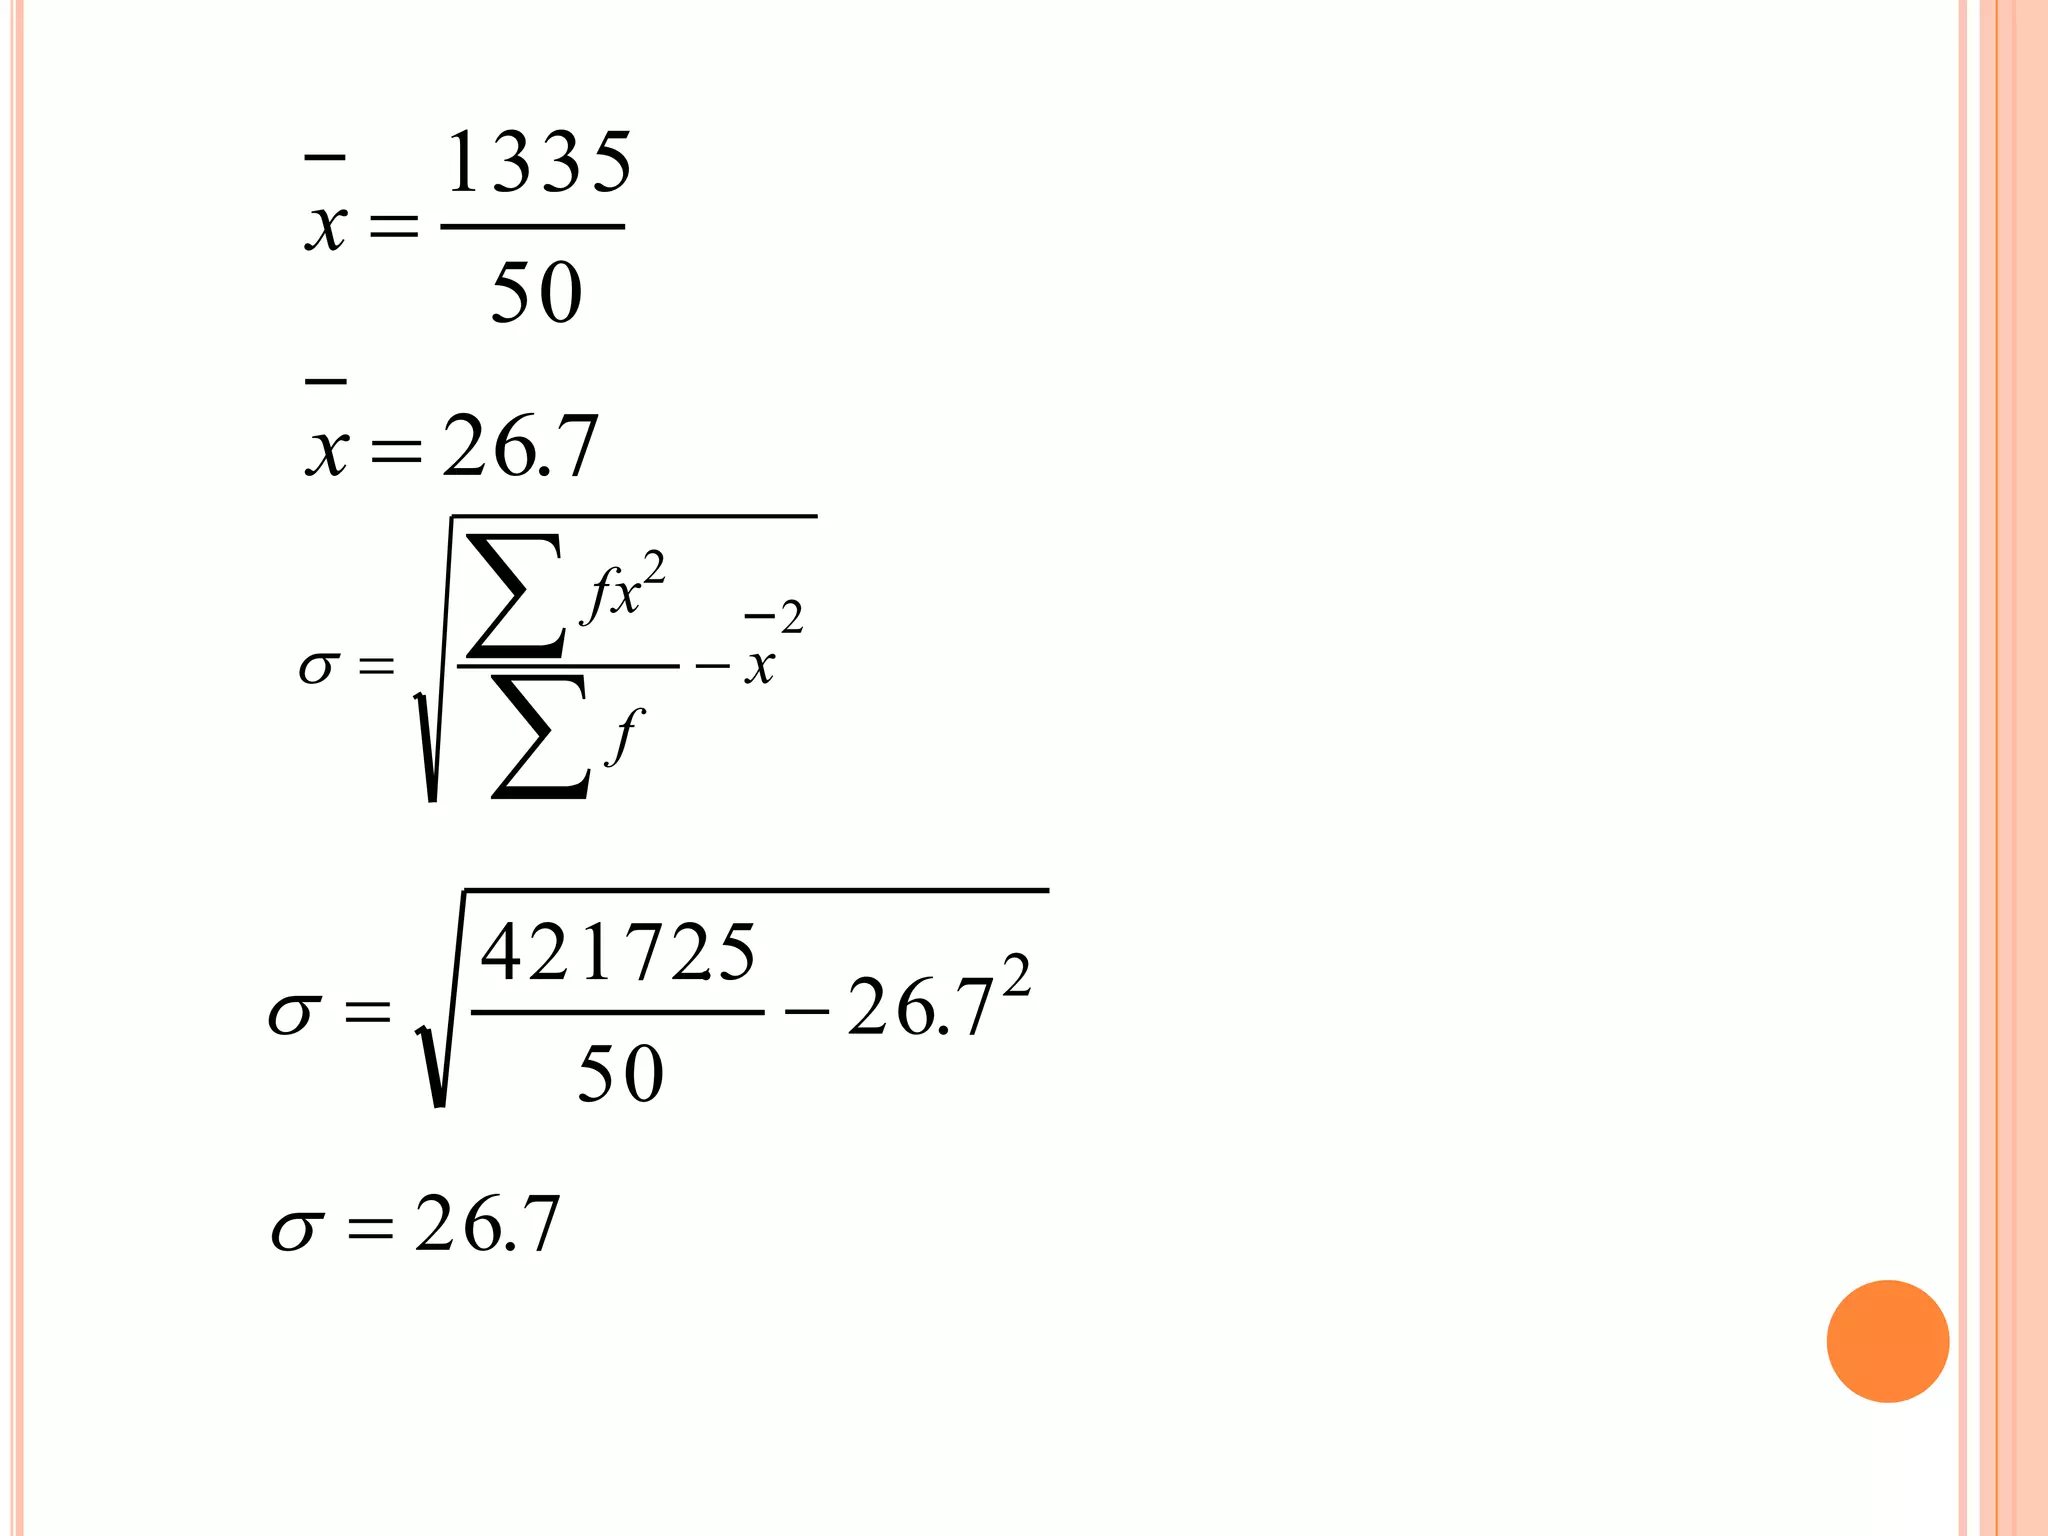
![SPM 2010: STATISTICS
Table below shows the frequency distribution of the marks of a group of
students.
(a) Use graph paper to answer this part of the question.
Using a scale of 2 cm to 10 marks on the horizontal axis and 2 cm to 2
students on the vertical axis, draw a histogram to represent the frequency
distribution of the marks in above table.
Hence, find the mode mark.
[4 marks]
(b) Calculate the standard deviation of the marks.
[4 marks]
Marks Number of students
1 – 10 5
11 – 20 8
21 – 30 20
31 – 40 10
41 – 50 7](https://image.slidesharecdn.com/teknikmenjawabmatematiktambahan1-150118233354-conversion-gate02/75/Teknik-menjawab-matematik-tambahan-1-61-2048.jpg)


![yx2
x
0
1 2 3 4 5 6
5.0
1
5.1
2
5.2
3
K1Correct axes and uniform scales
N16 points are correctly plotted
N1
Line of best fit (at least 3 points must
be on the line)
c =3
Find the y-intercept
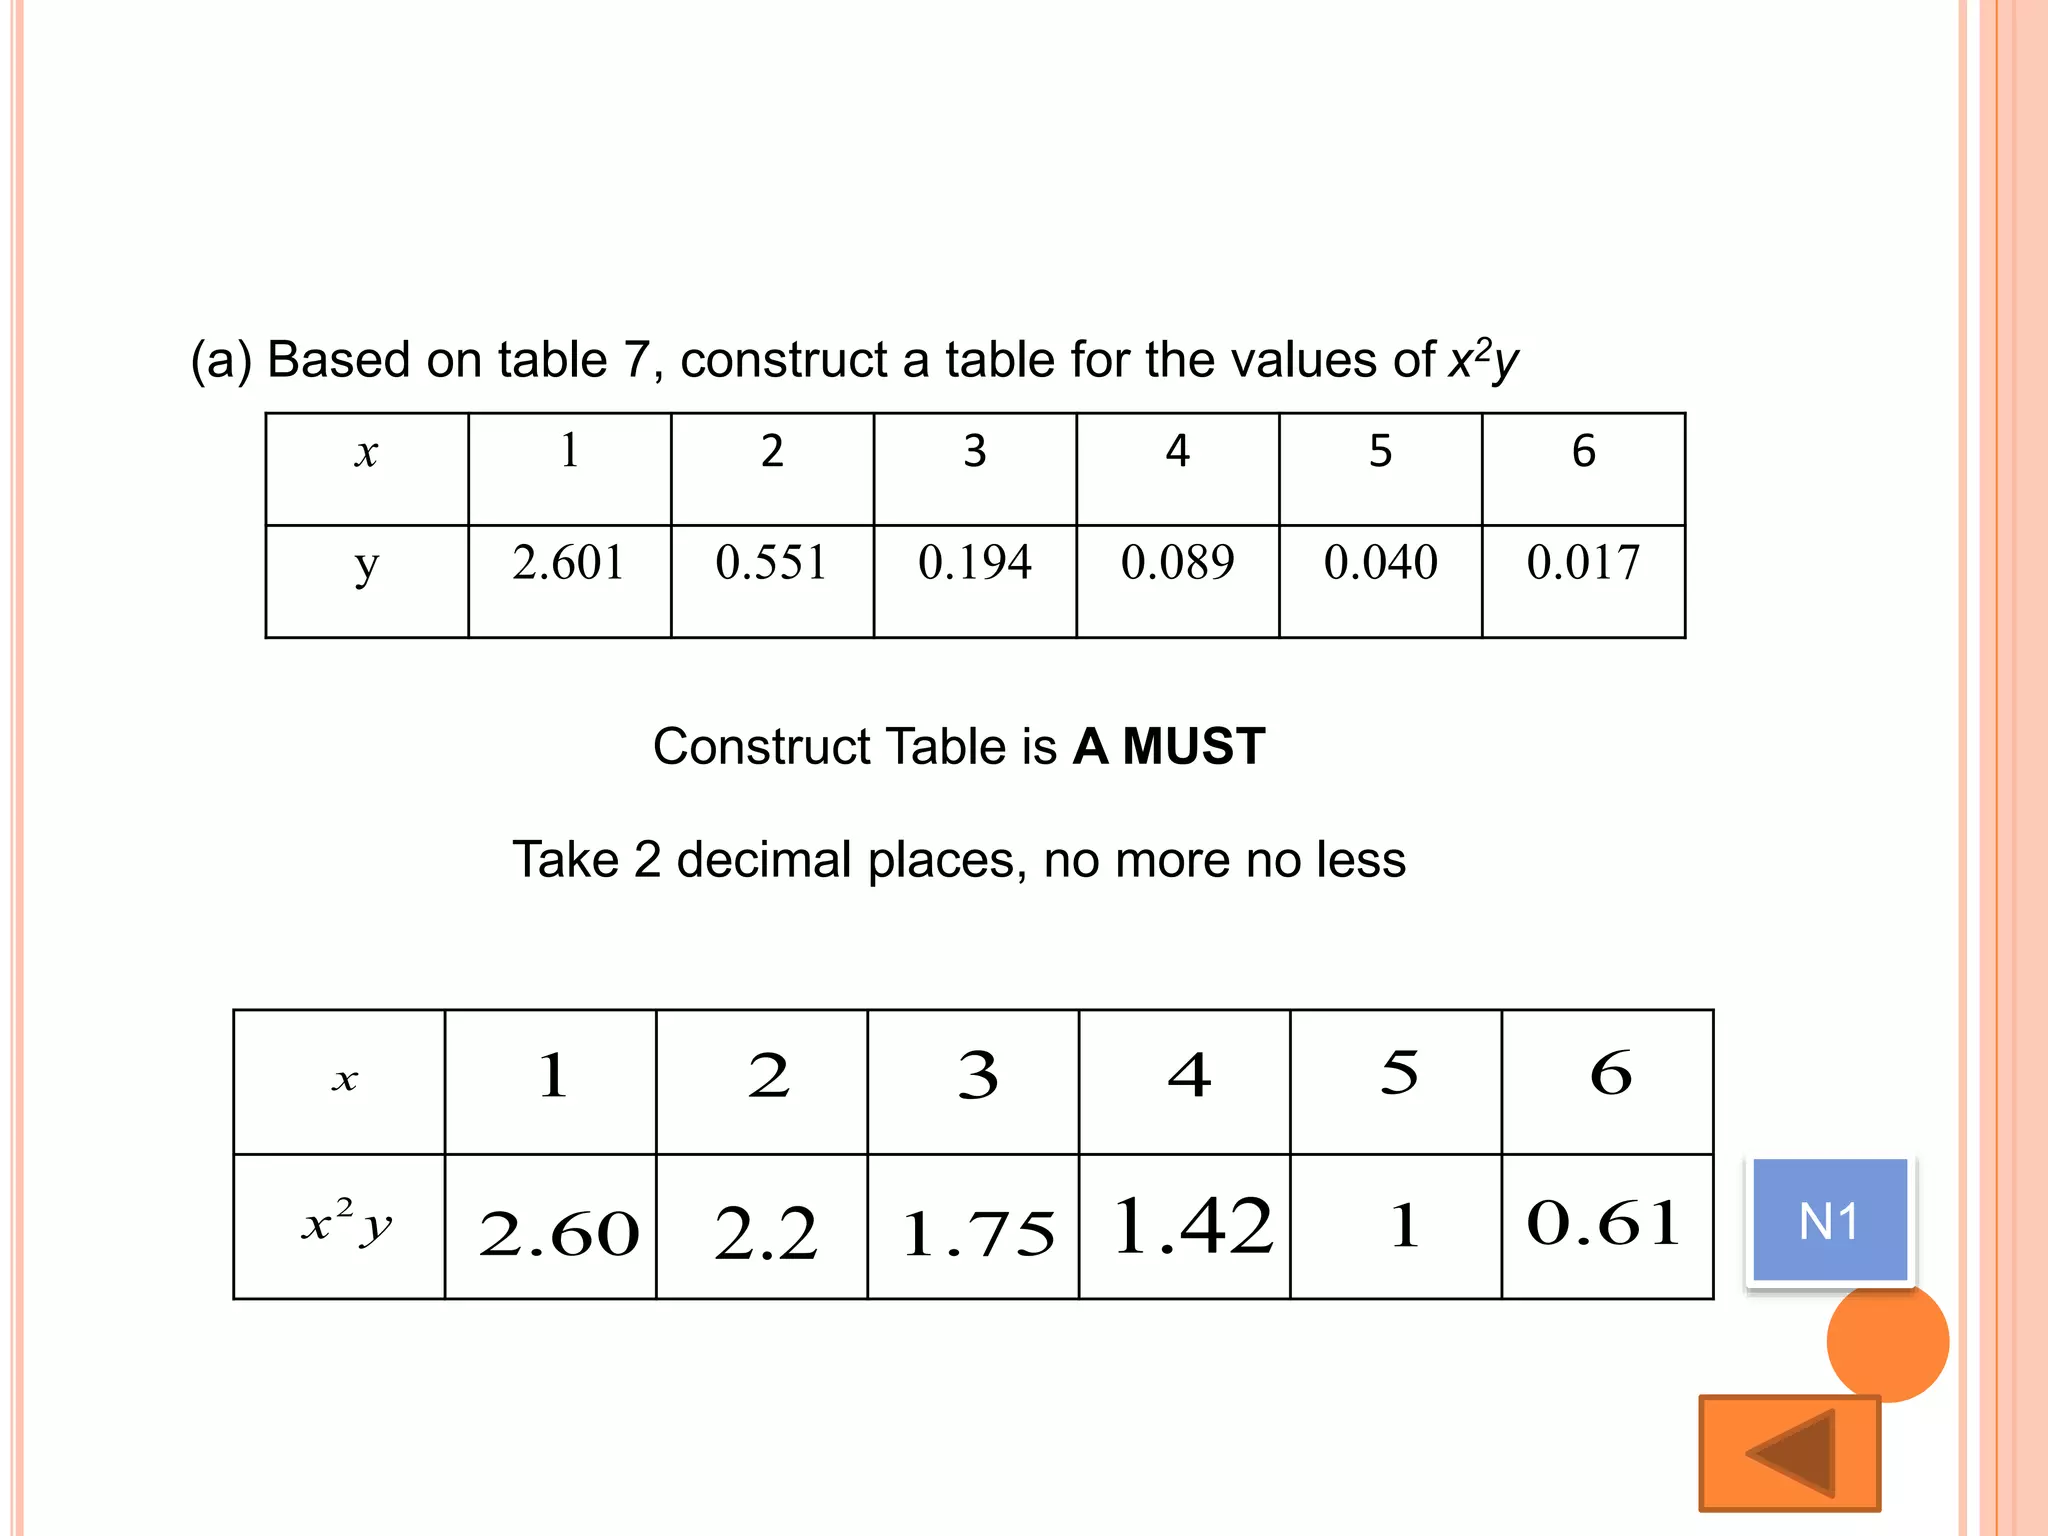
(b) Plot x2y against x, using a scale of 2 cm to 1 unit on
the x-axis and 2 cm to 0.5 unit on the x2y – axis.
Hence draw the line of best fit [3 marks]
(c) Use the graph in (b) to find the value of
(i) y when x = 2.5
2yx2](https://image.slidesharecdn.com/teknikmenjawabmatematiktambahan1-150118233354-conversion-gate02/75/Teknik-menjawab-matematik-tambahan-1-68-2048.jpg)


![y
1
x
0
1.0 2.0 3.0 4.0 5.0 6.0
5.0
1
5.1
2
5.2
3
5.3
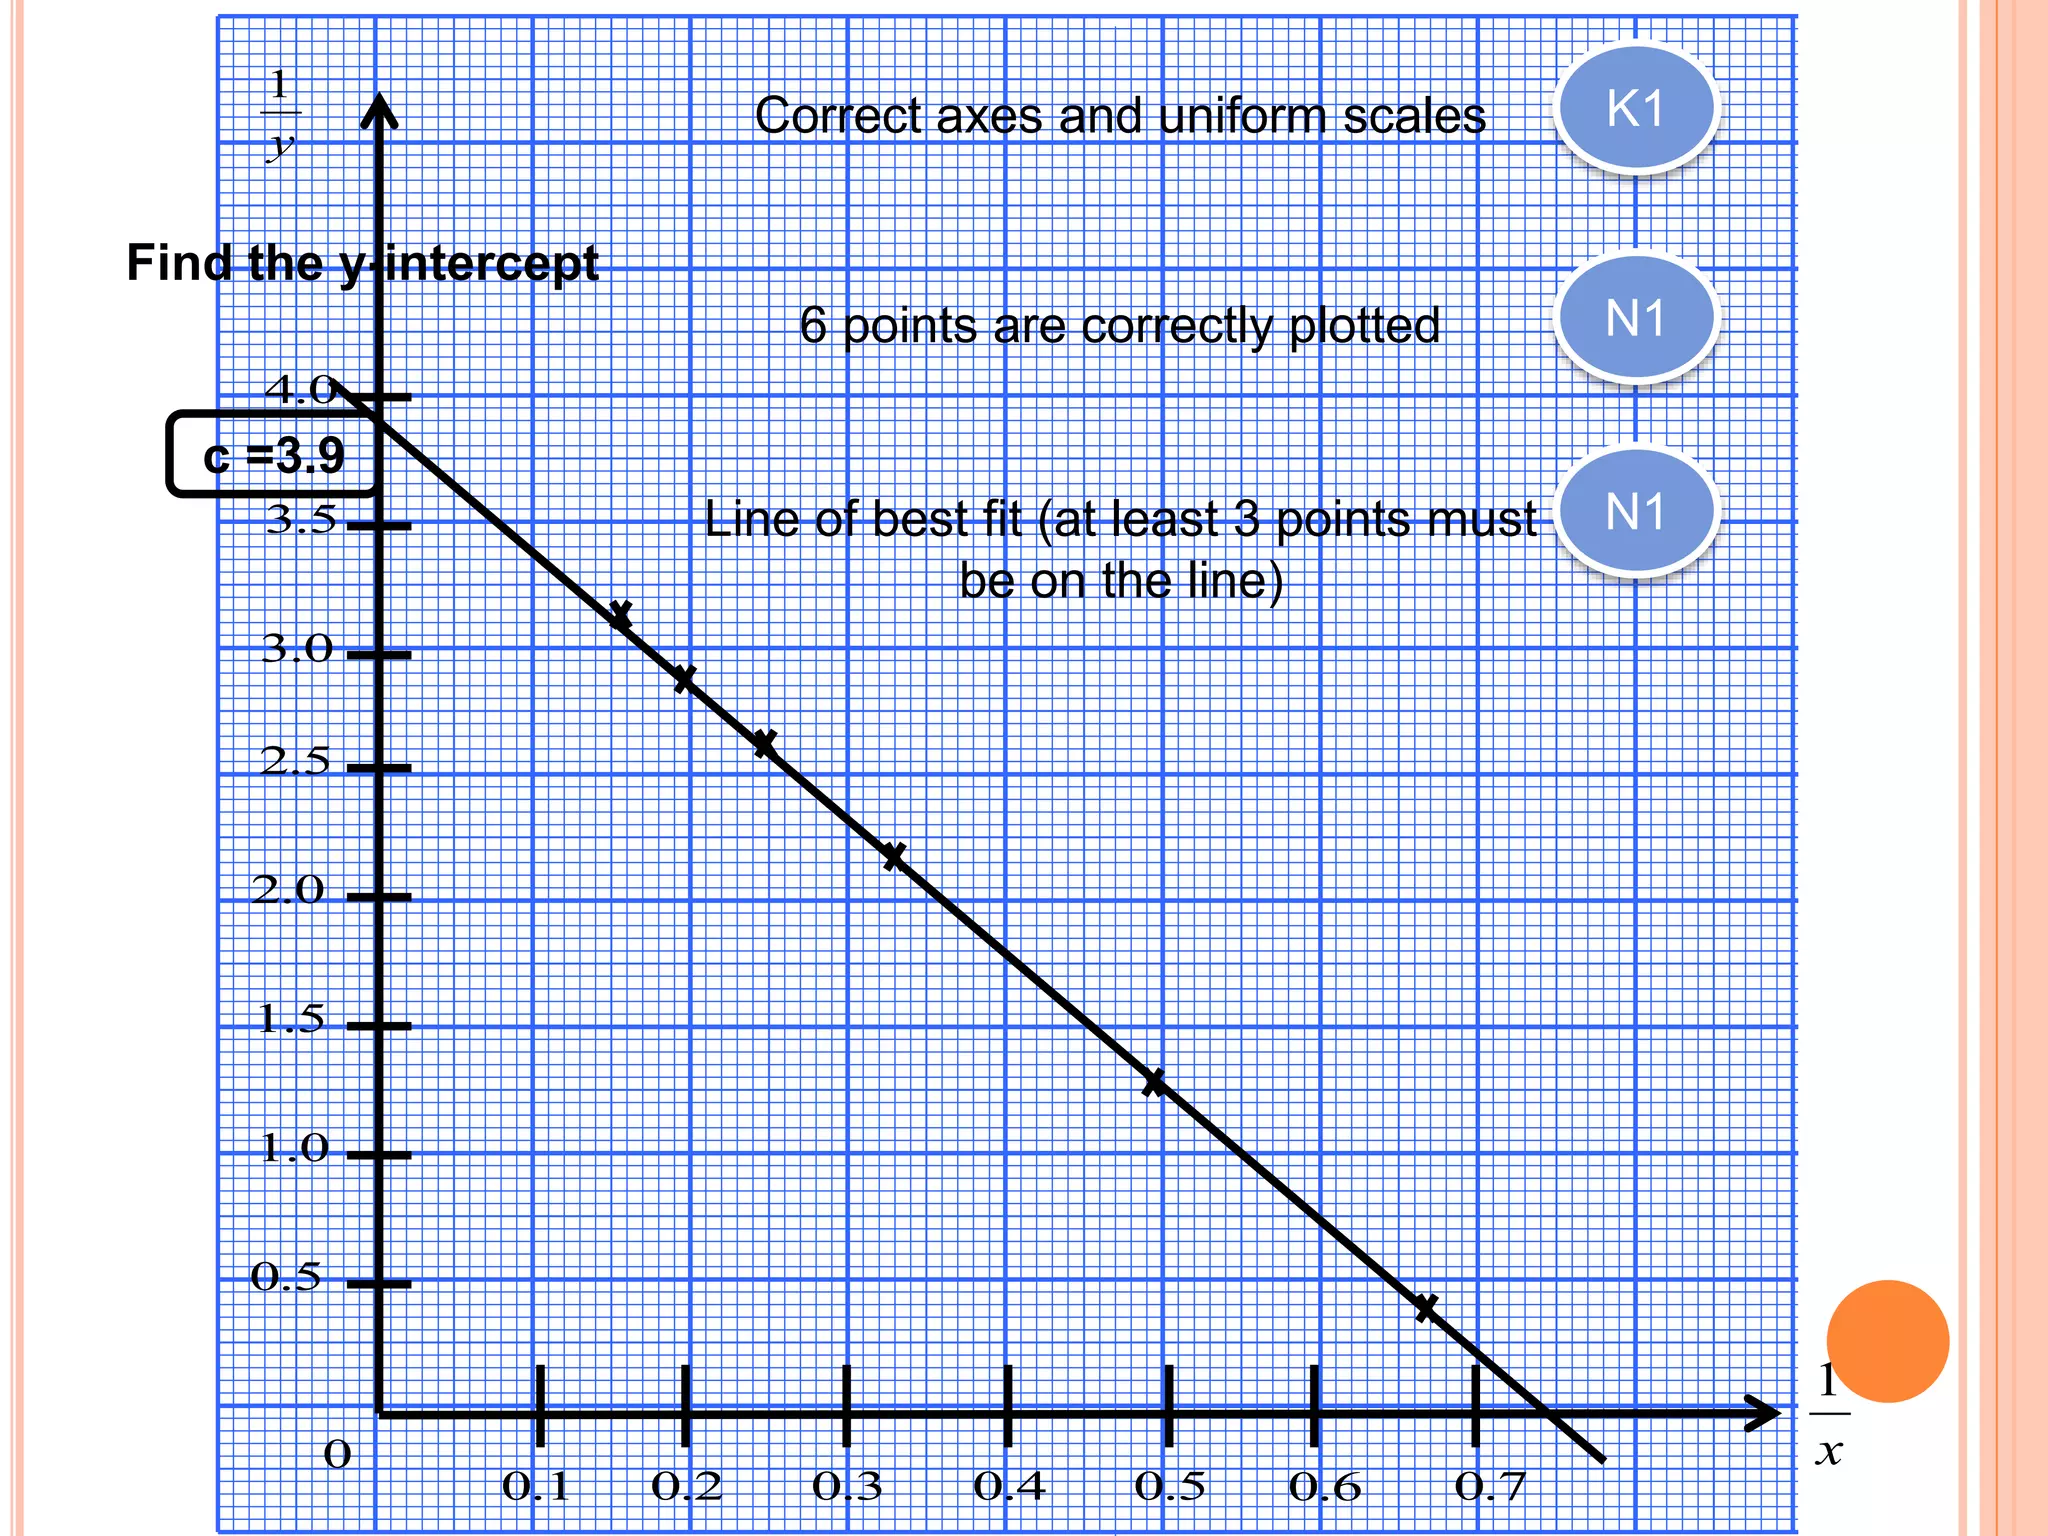
K1Correct axes and uniform scales
N16 points are correctly plotted
N1
Line of best fit (at least 3 points must
be on the line)
c =3.85
Find the y-intercept
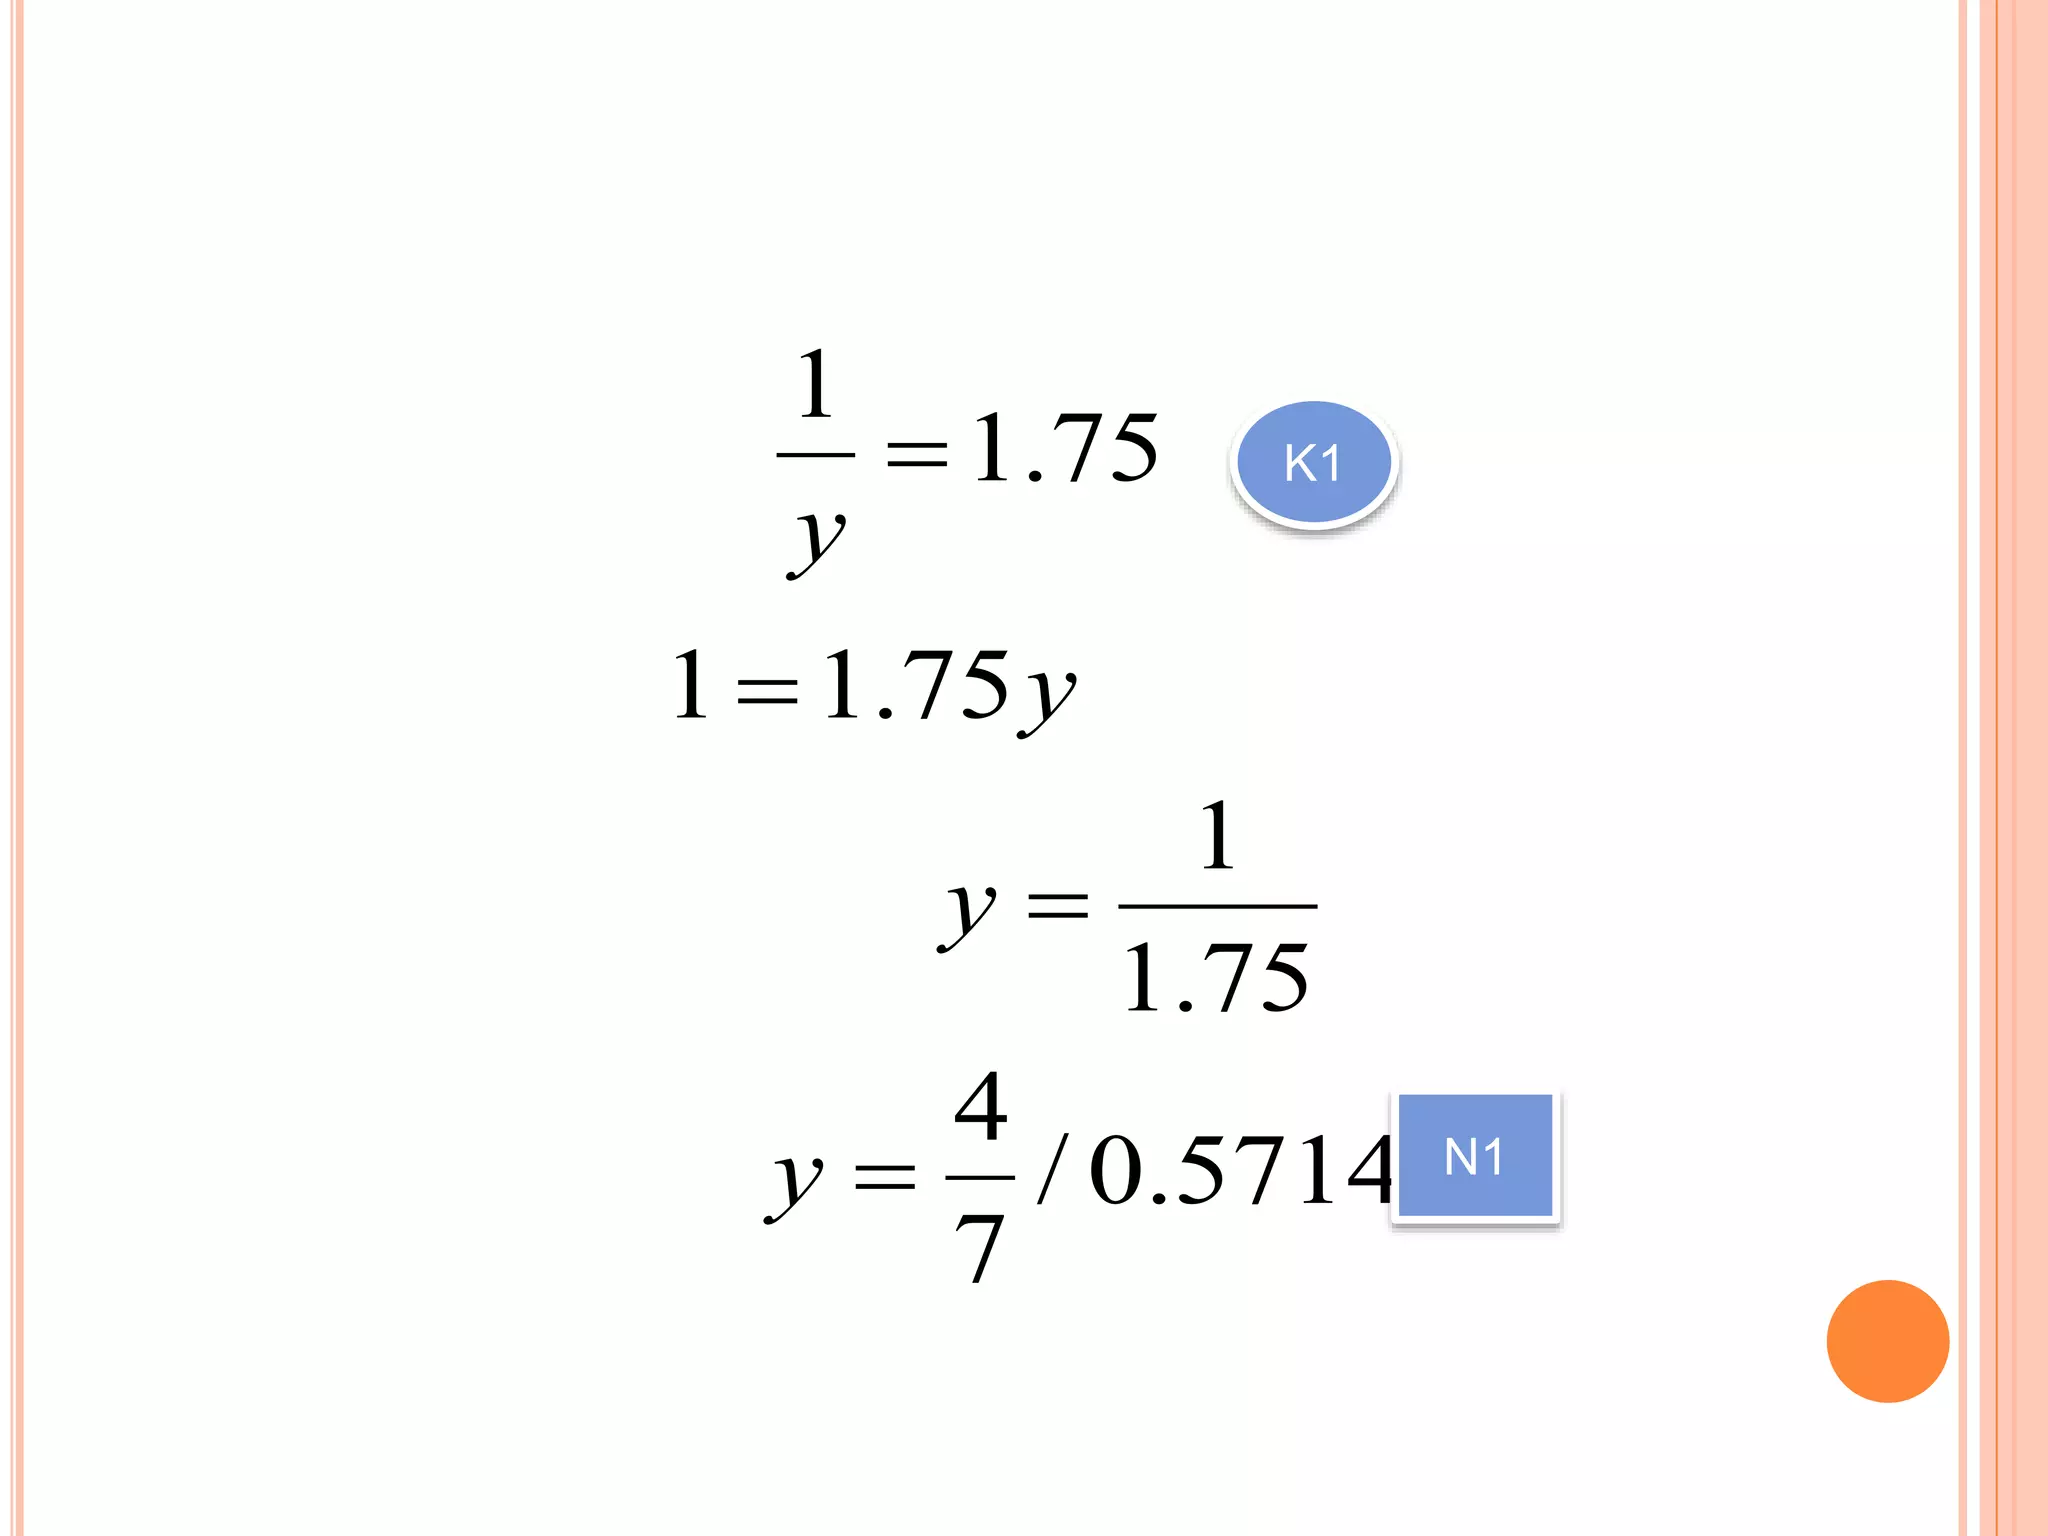
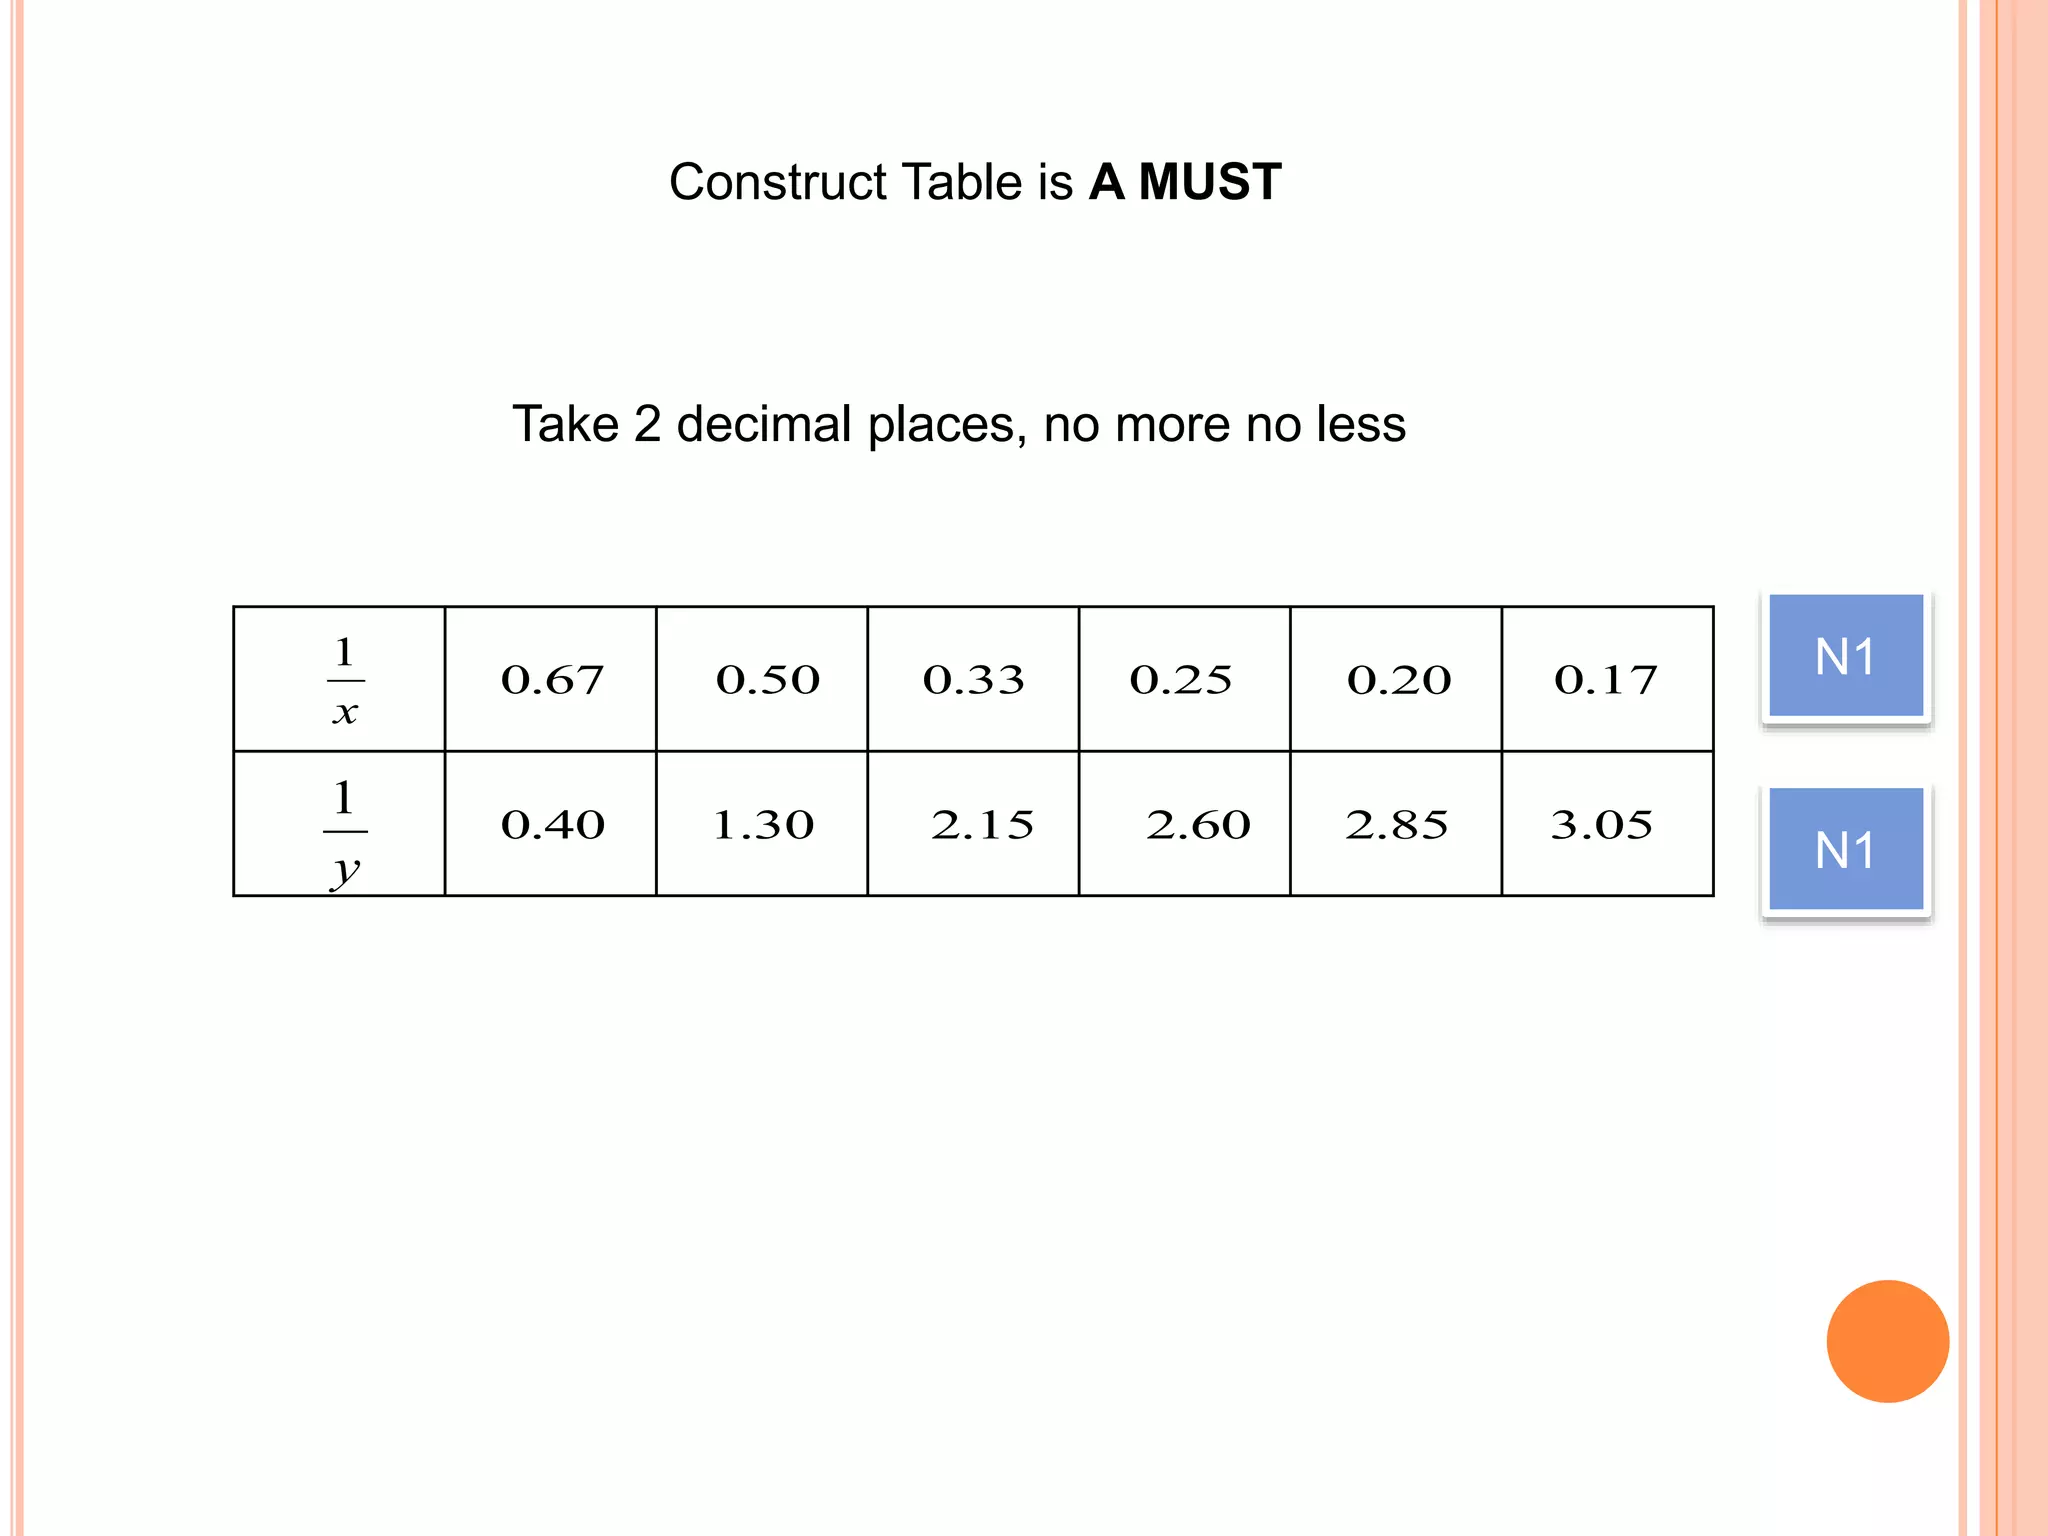
(b) Plot 1/y against x, using a scale of 2 cm to 0.1 unit on
the x-axis and 2 cm to 0.5 unit on the 1/y – axis.
Hence draw the line of best fit [3 marks]
(c) Use the graph in (b) to find the value of
(i) y when x = 0.38
75.1
y
1](https://image.slidesharecdn.com/teknikmenjawabmatematiktambahan1-150118233354-conversion-gate02/75/Teknik-menjawab-matematik-tambahan-1-75-2048.jpg)


![y10log
x
0
1 2 3 4 5 6 7
1.0
2.0
3.0
4.0
5.0
6.0
7.0
8.0
K1Correct axes and uniform scales
N16 points are correctly plotted
N1
Line of best fit (at least 3 points must
be on the line)
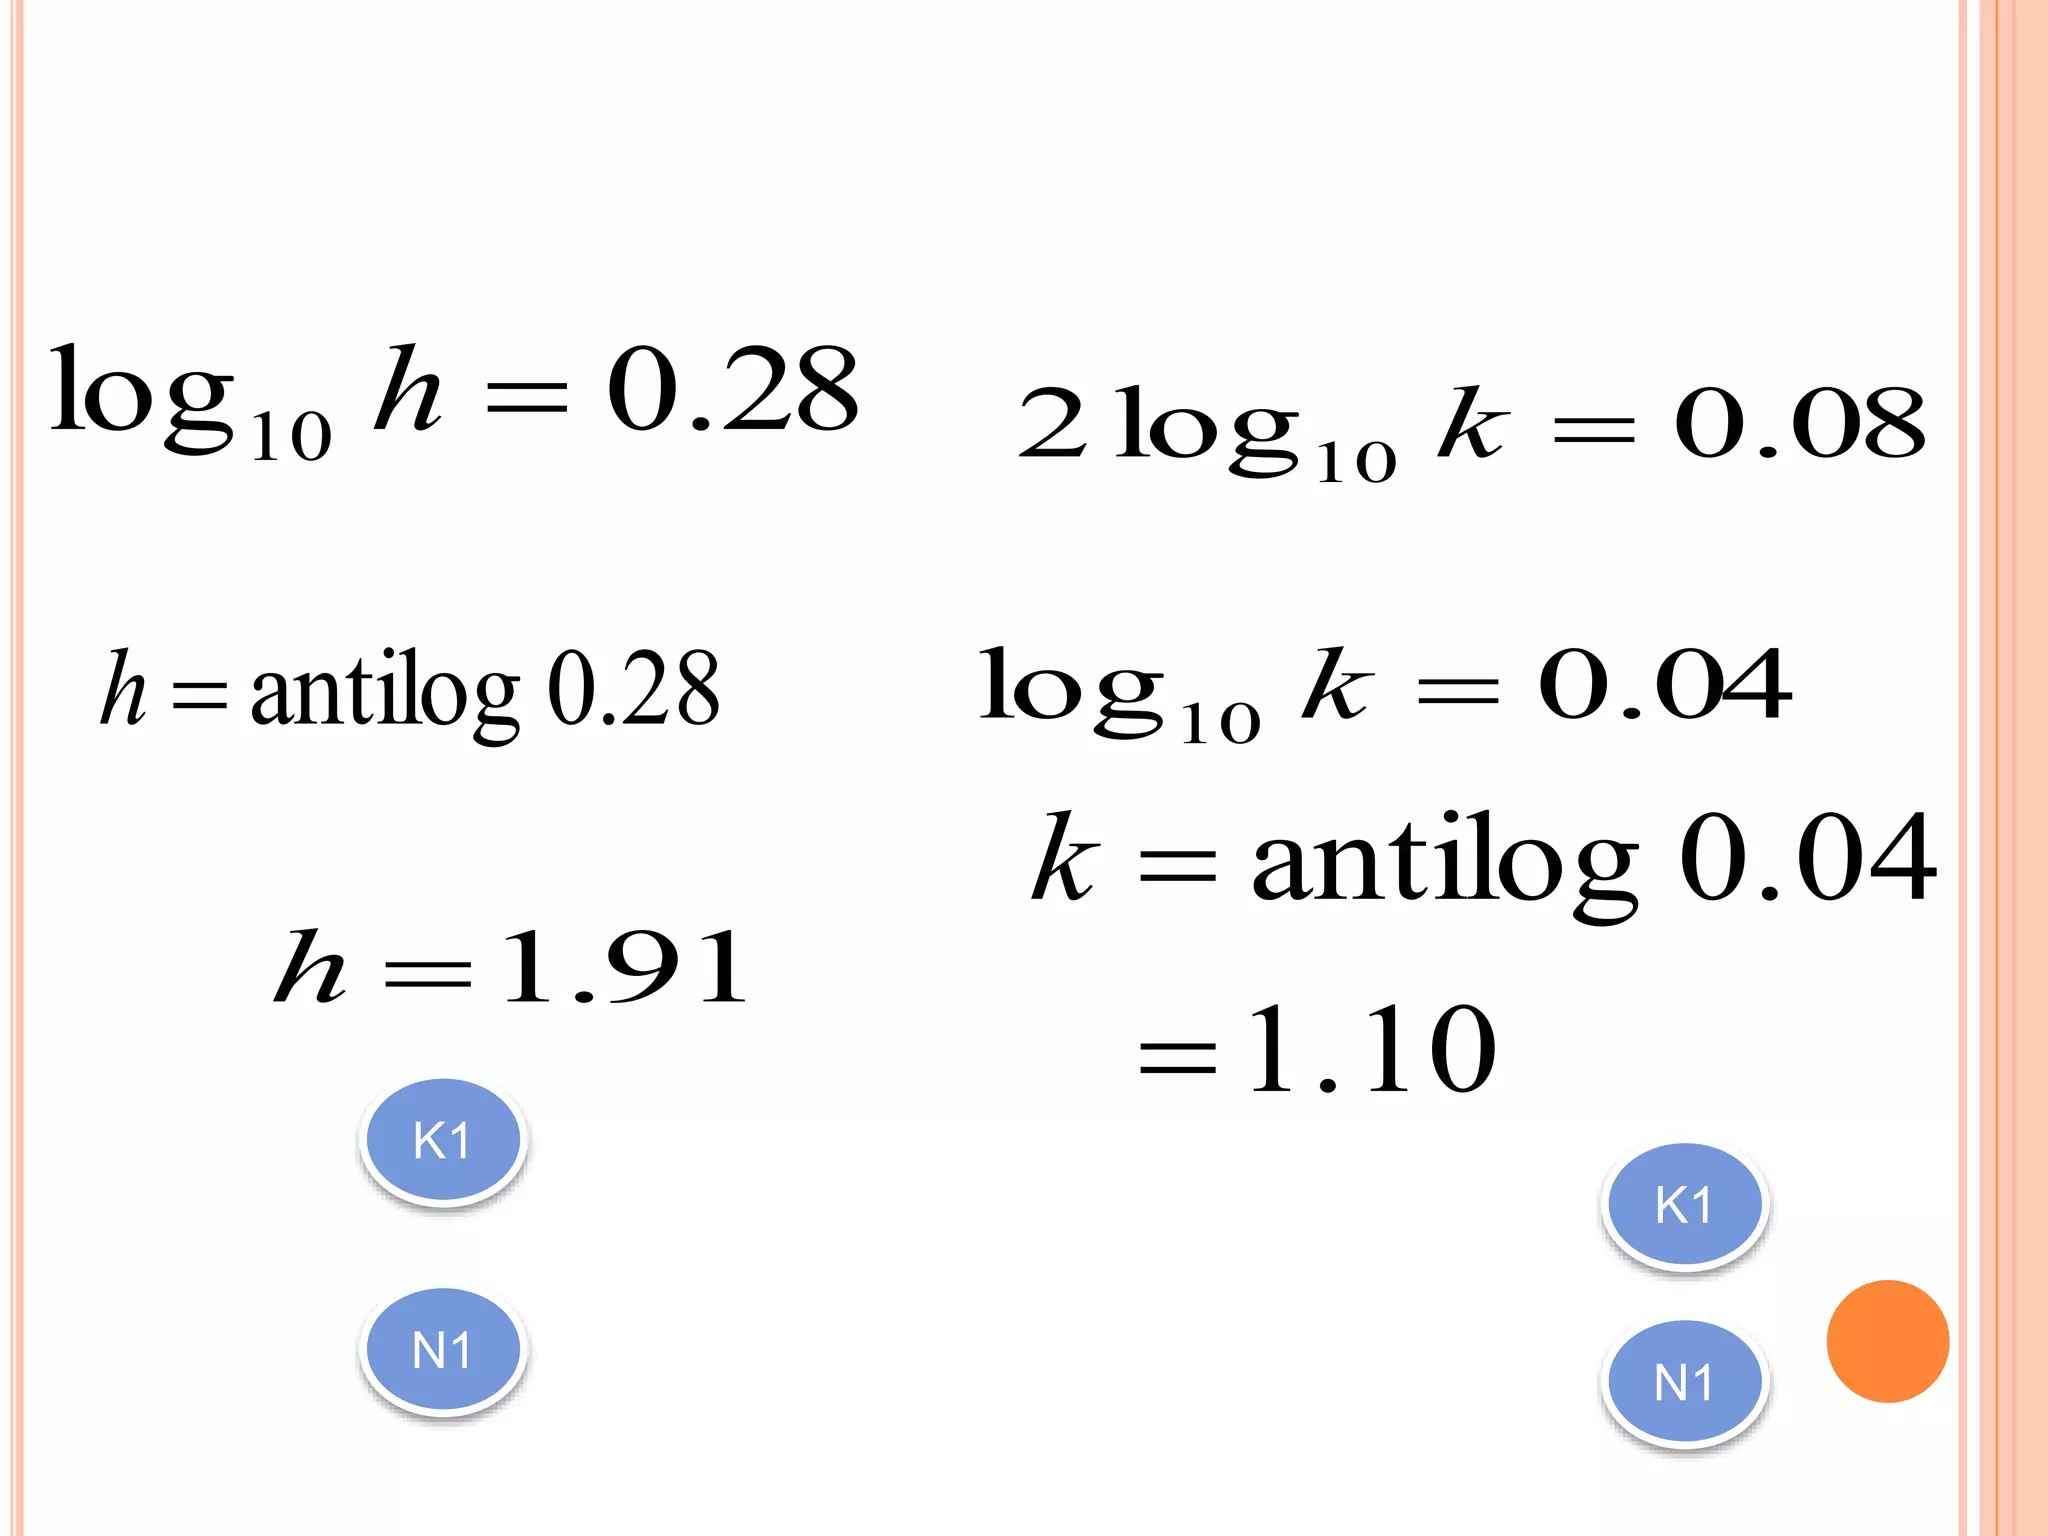
c =0.11 Find the y-intercept
8
9.0
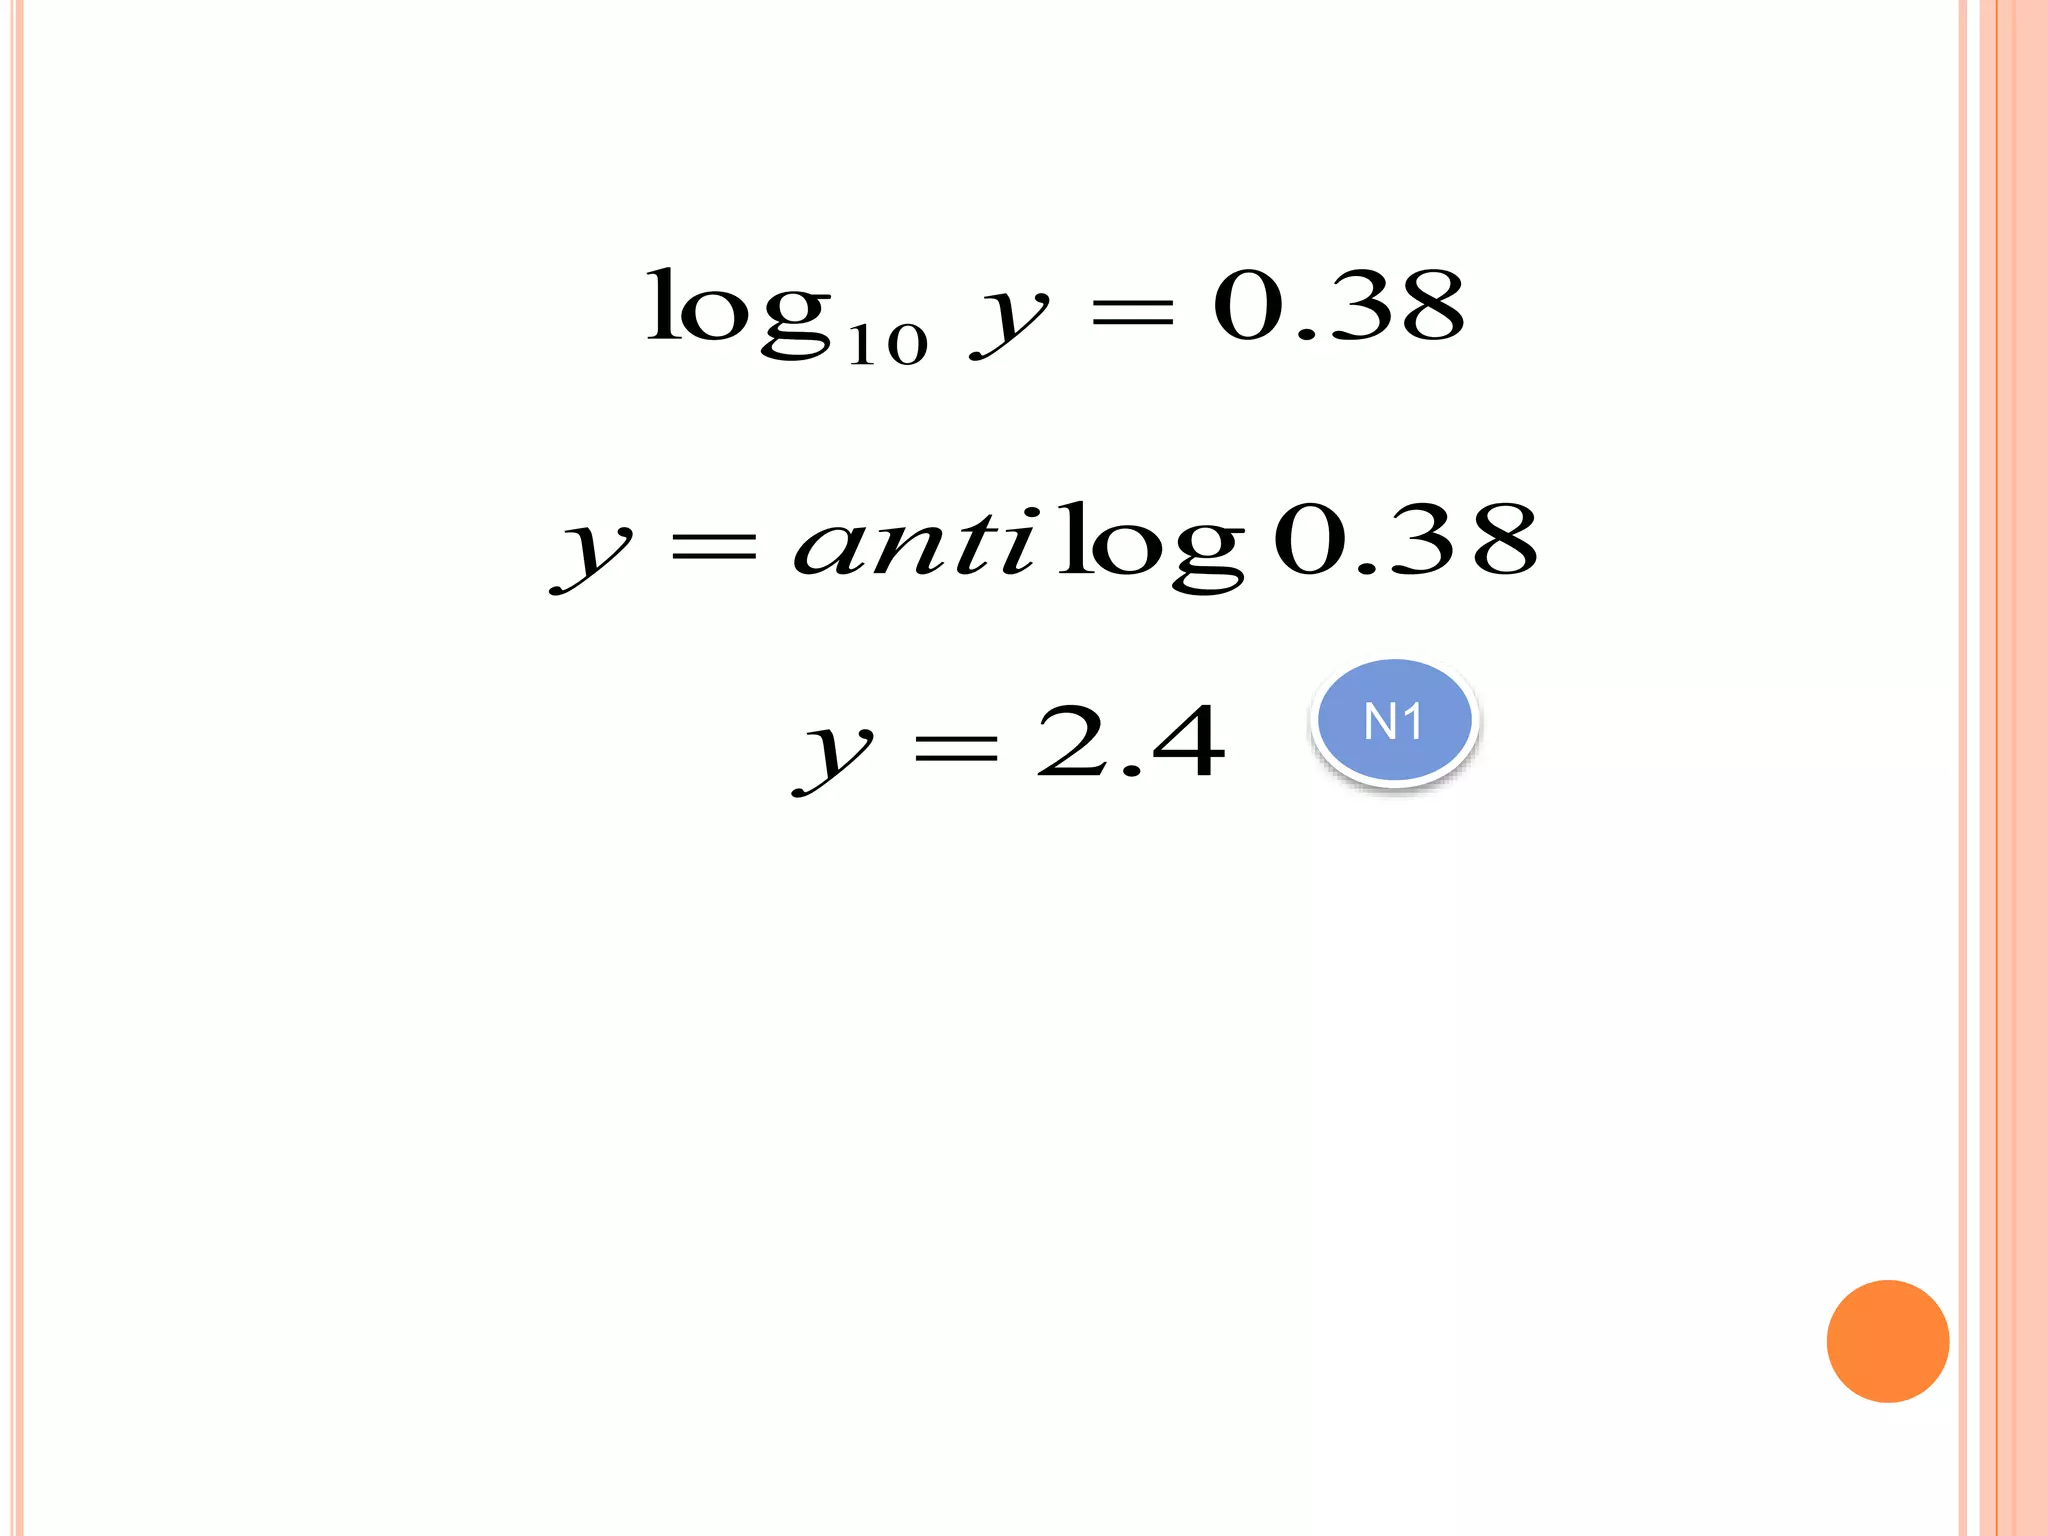
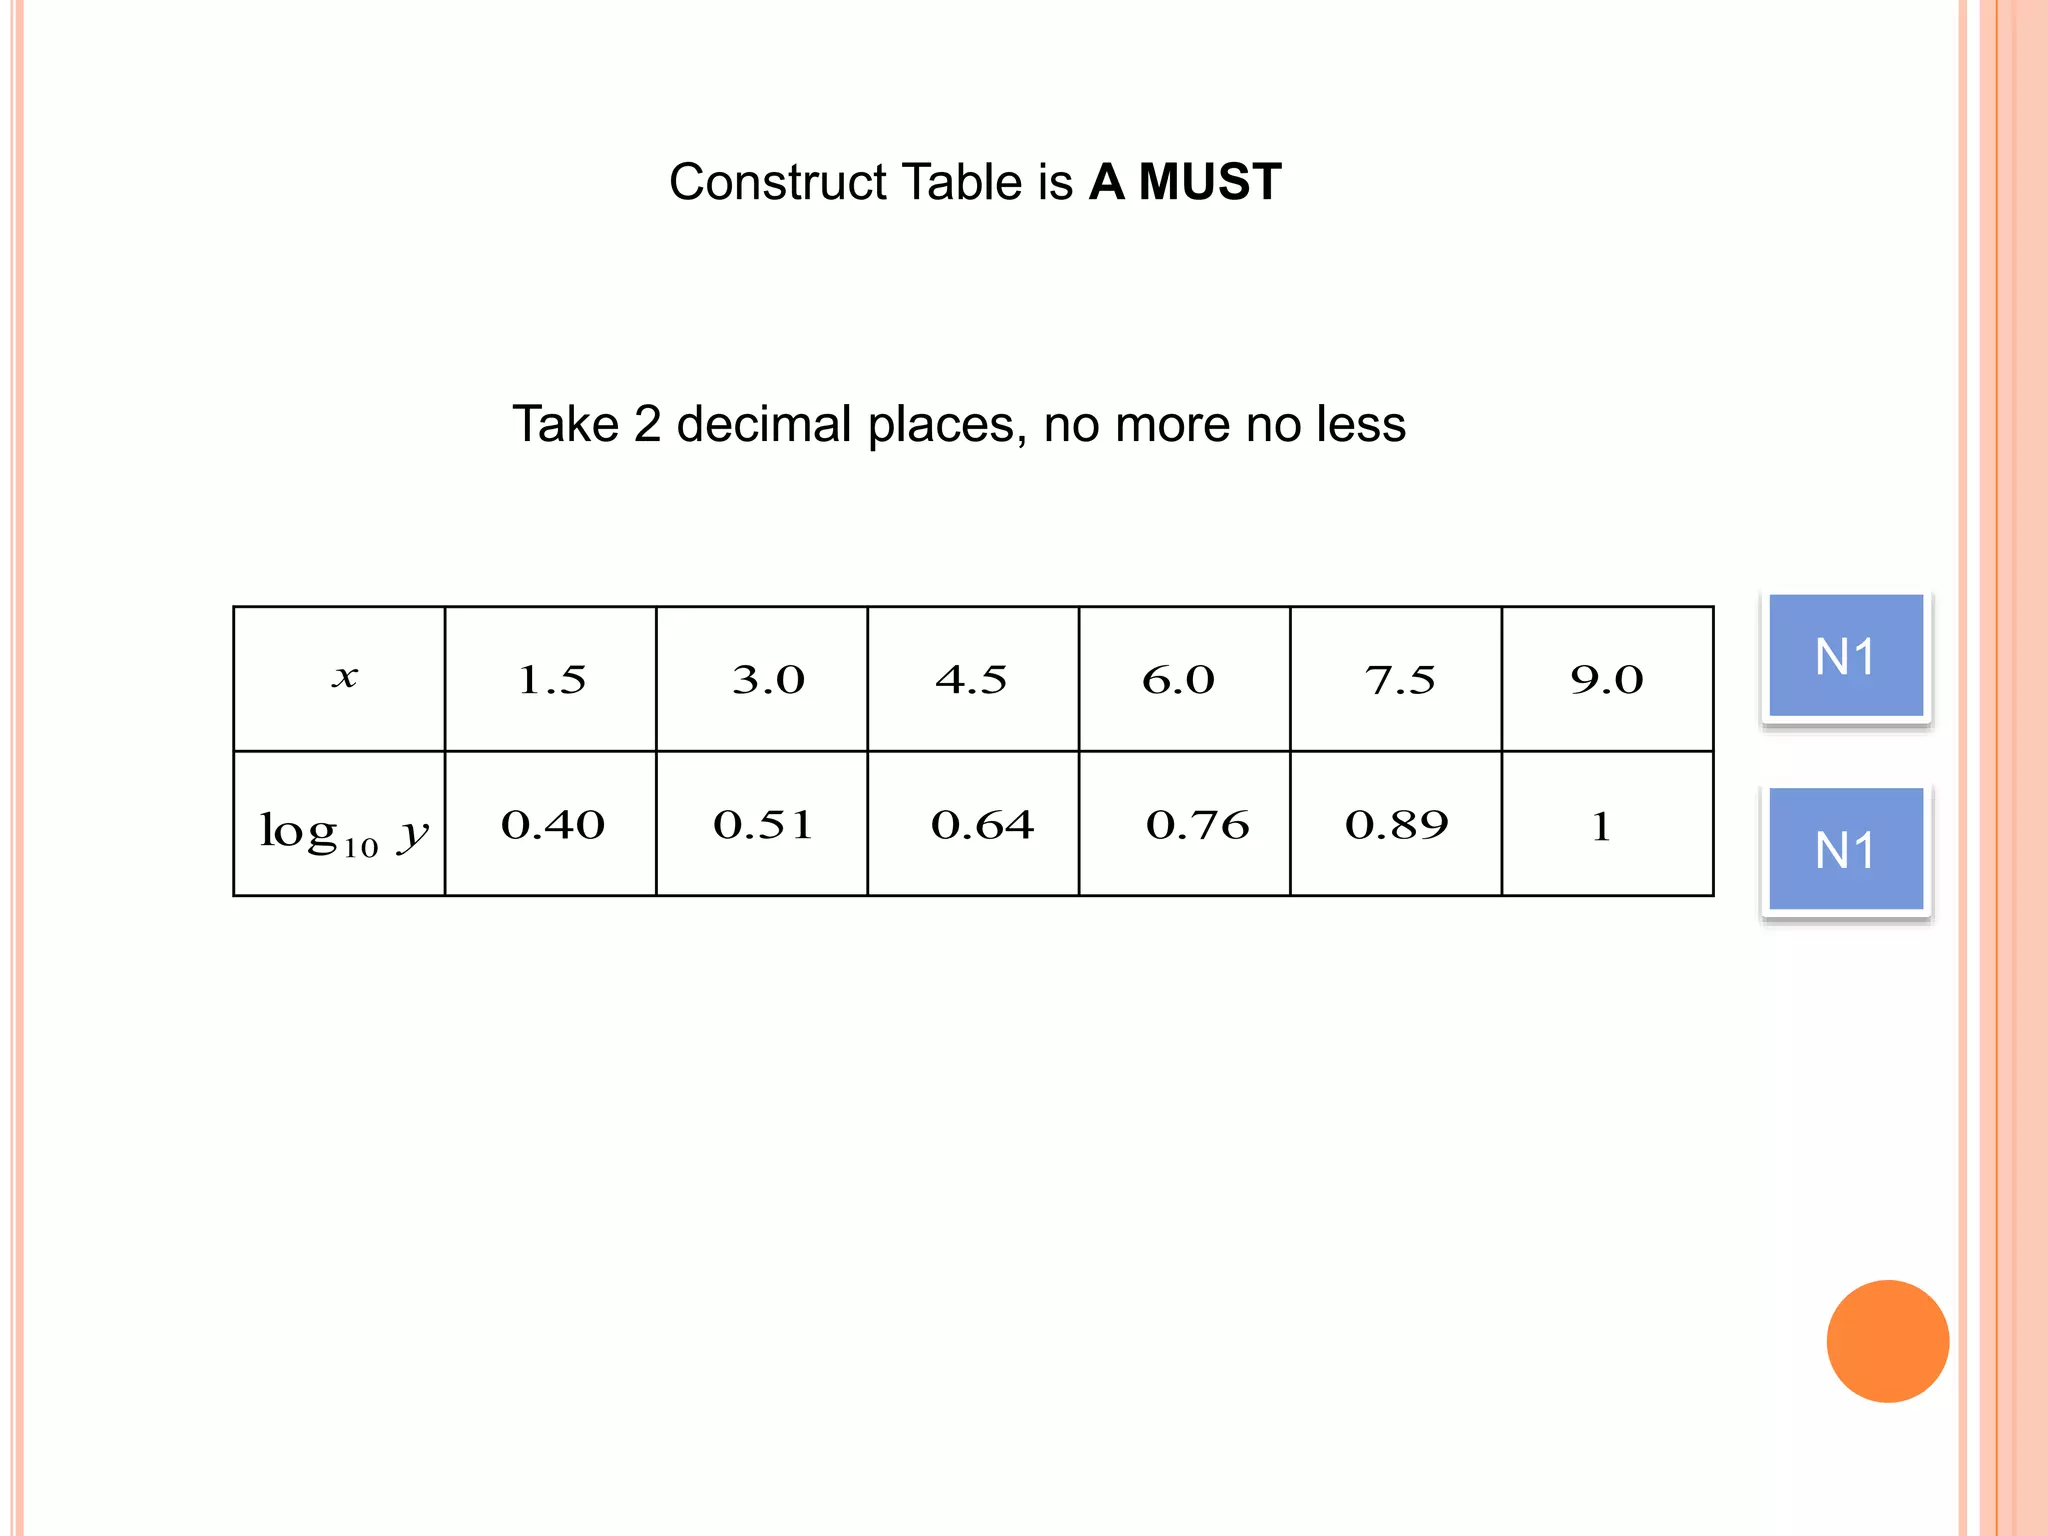
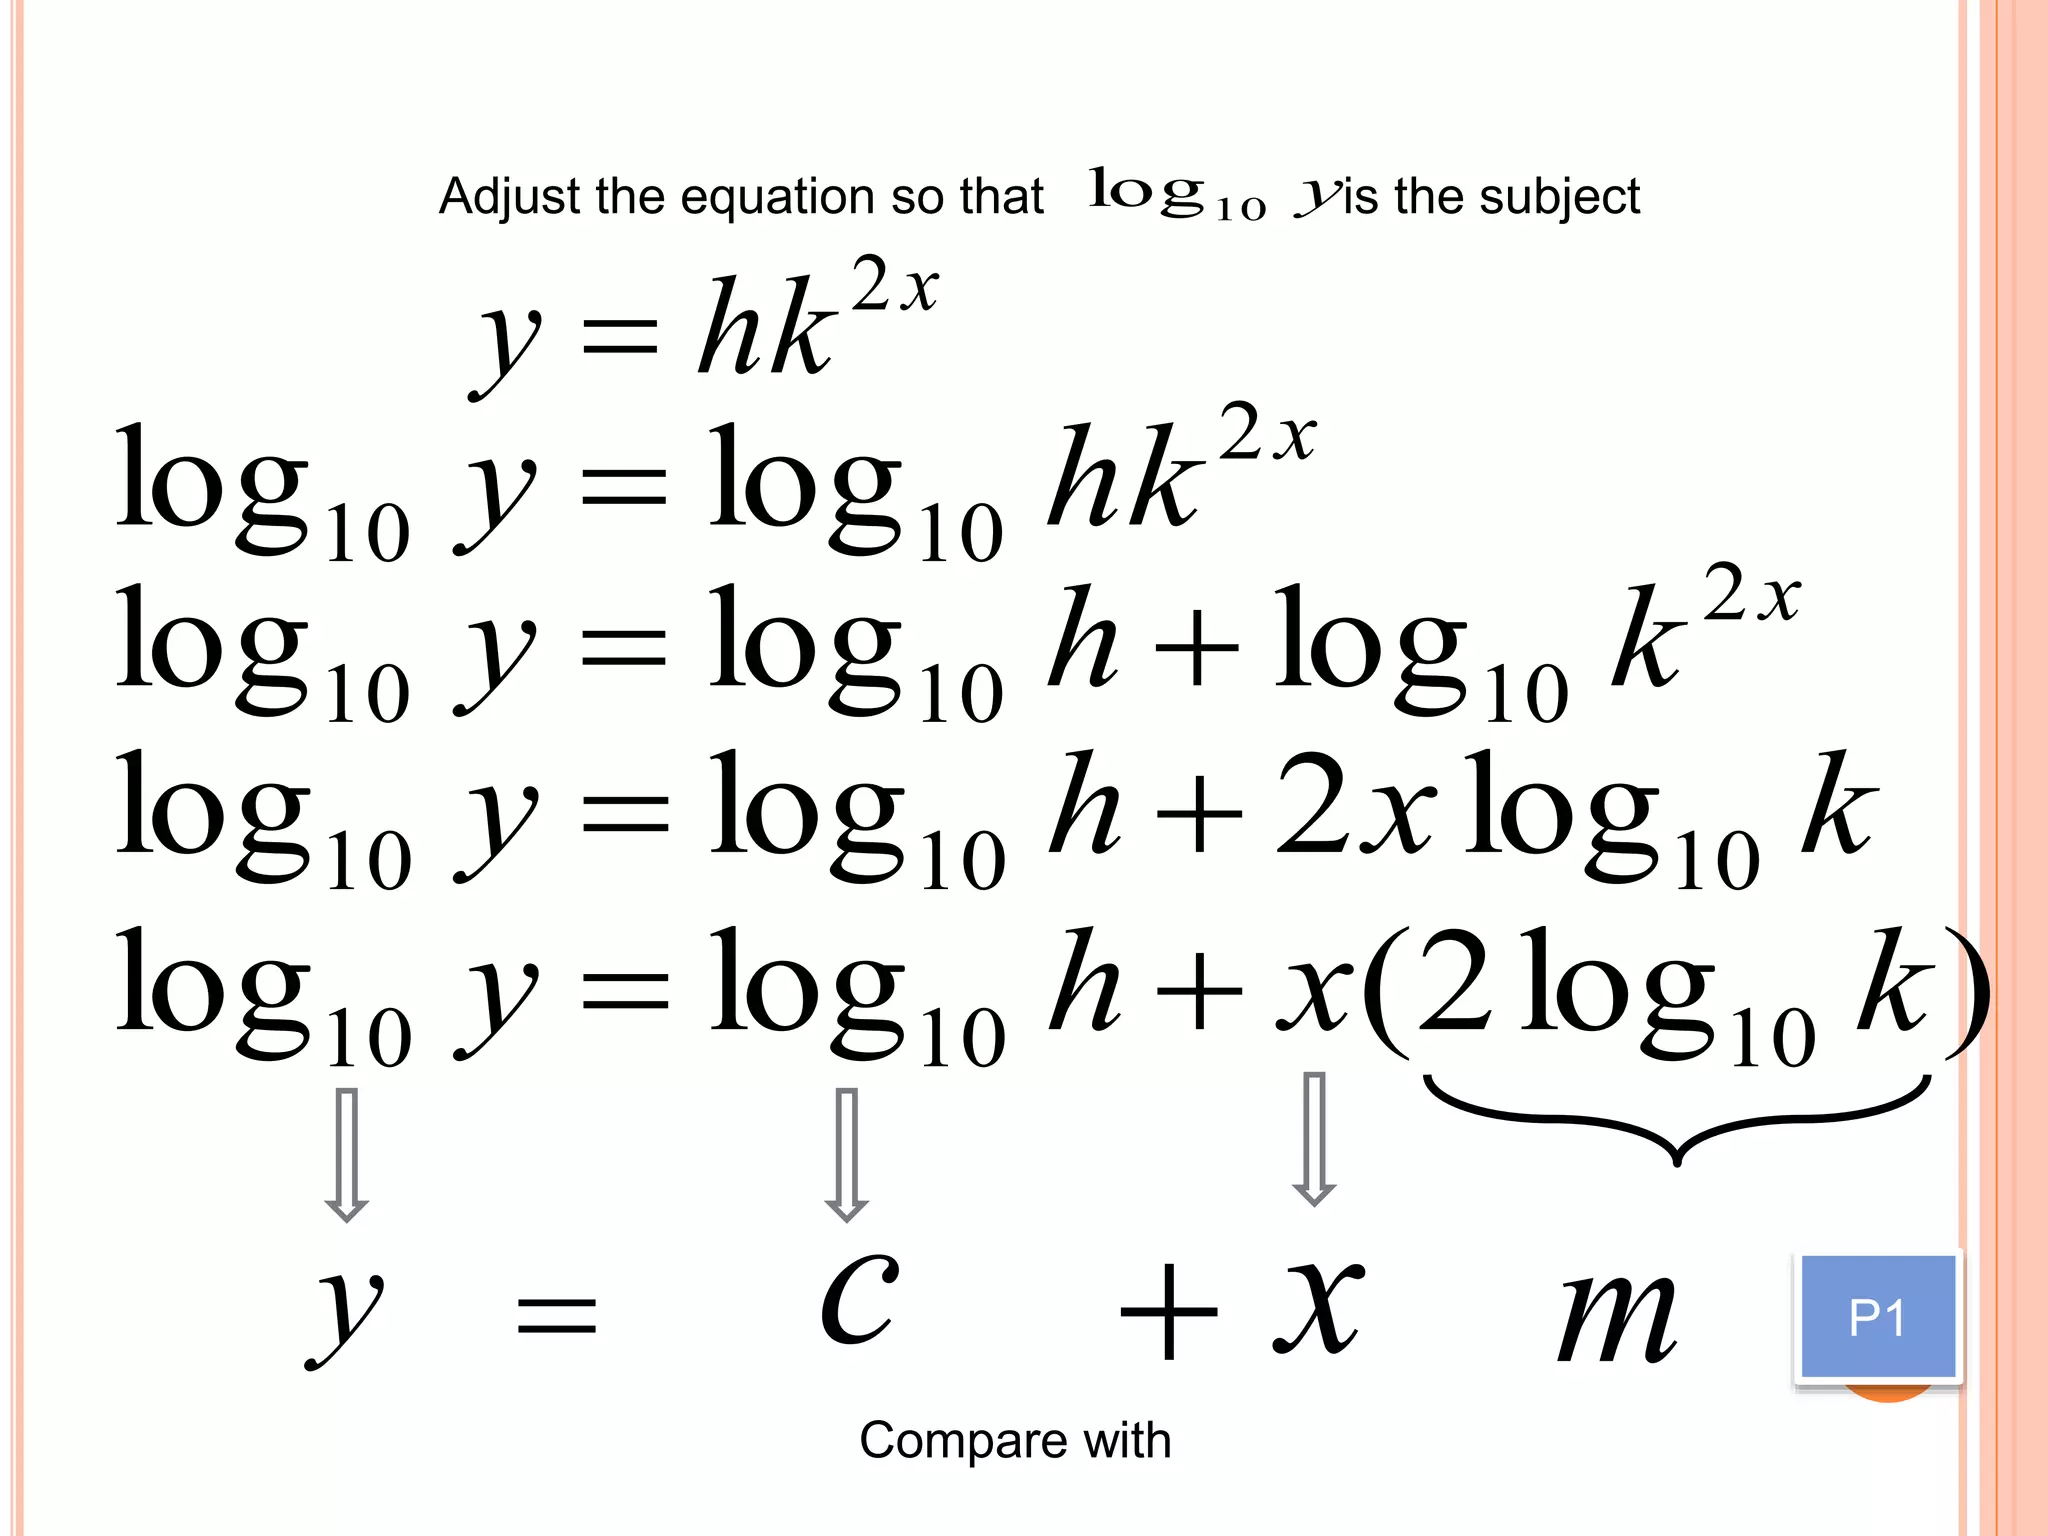
(a) Plot log10y against x, using a scale of 2 cm to 1 unit on
the x-axis and 2 cm to 0.1 unit on the log10y – axis.
Hence draw the line of best fit [3 marks]
(b) Use the graph in (a) to find the value of
(iii) y when x = 2.7
38.0y10log](https://image.slidesharecdn.com/teknikmenjawabmatematiktambahan1-150118233354-conversion-gate02/75/Teknik-menjawab-matematik-tambahan-1-82-2048.jpg)


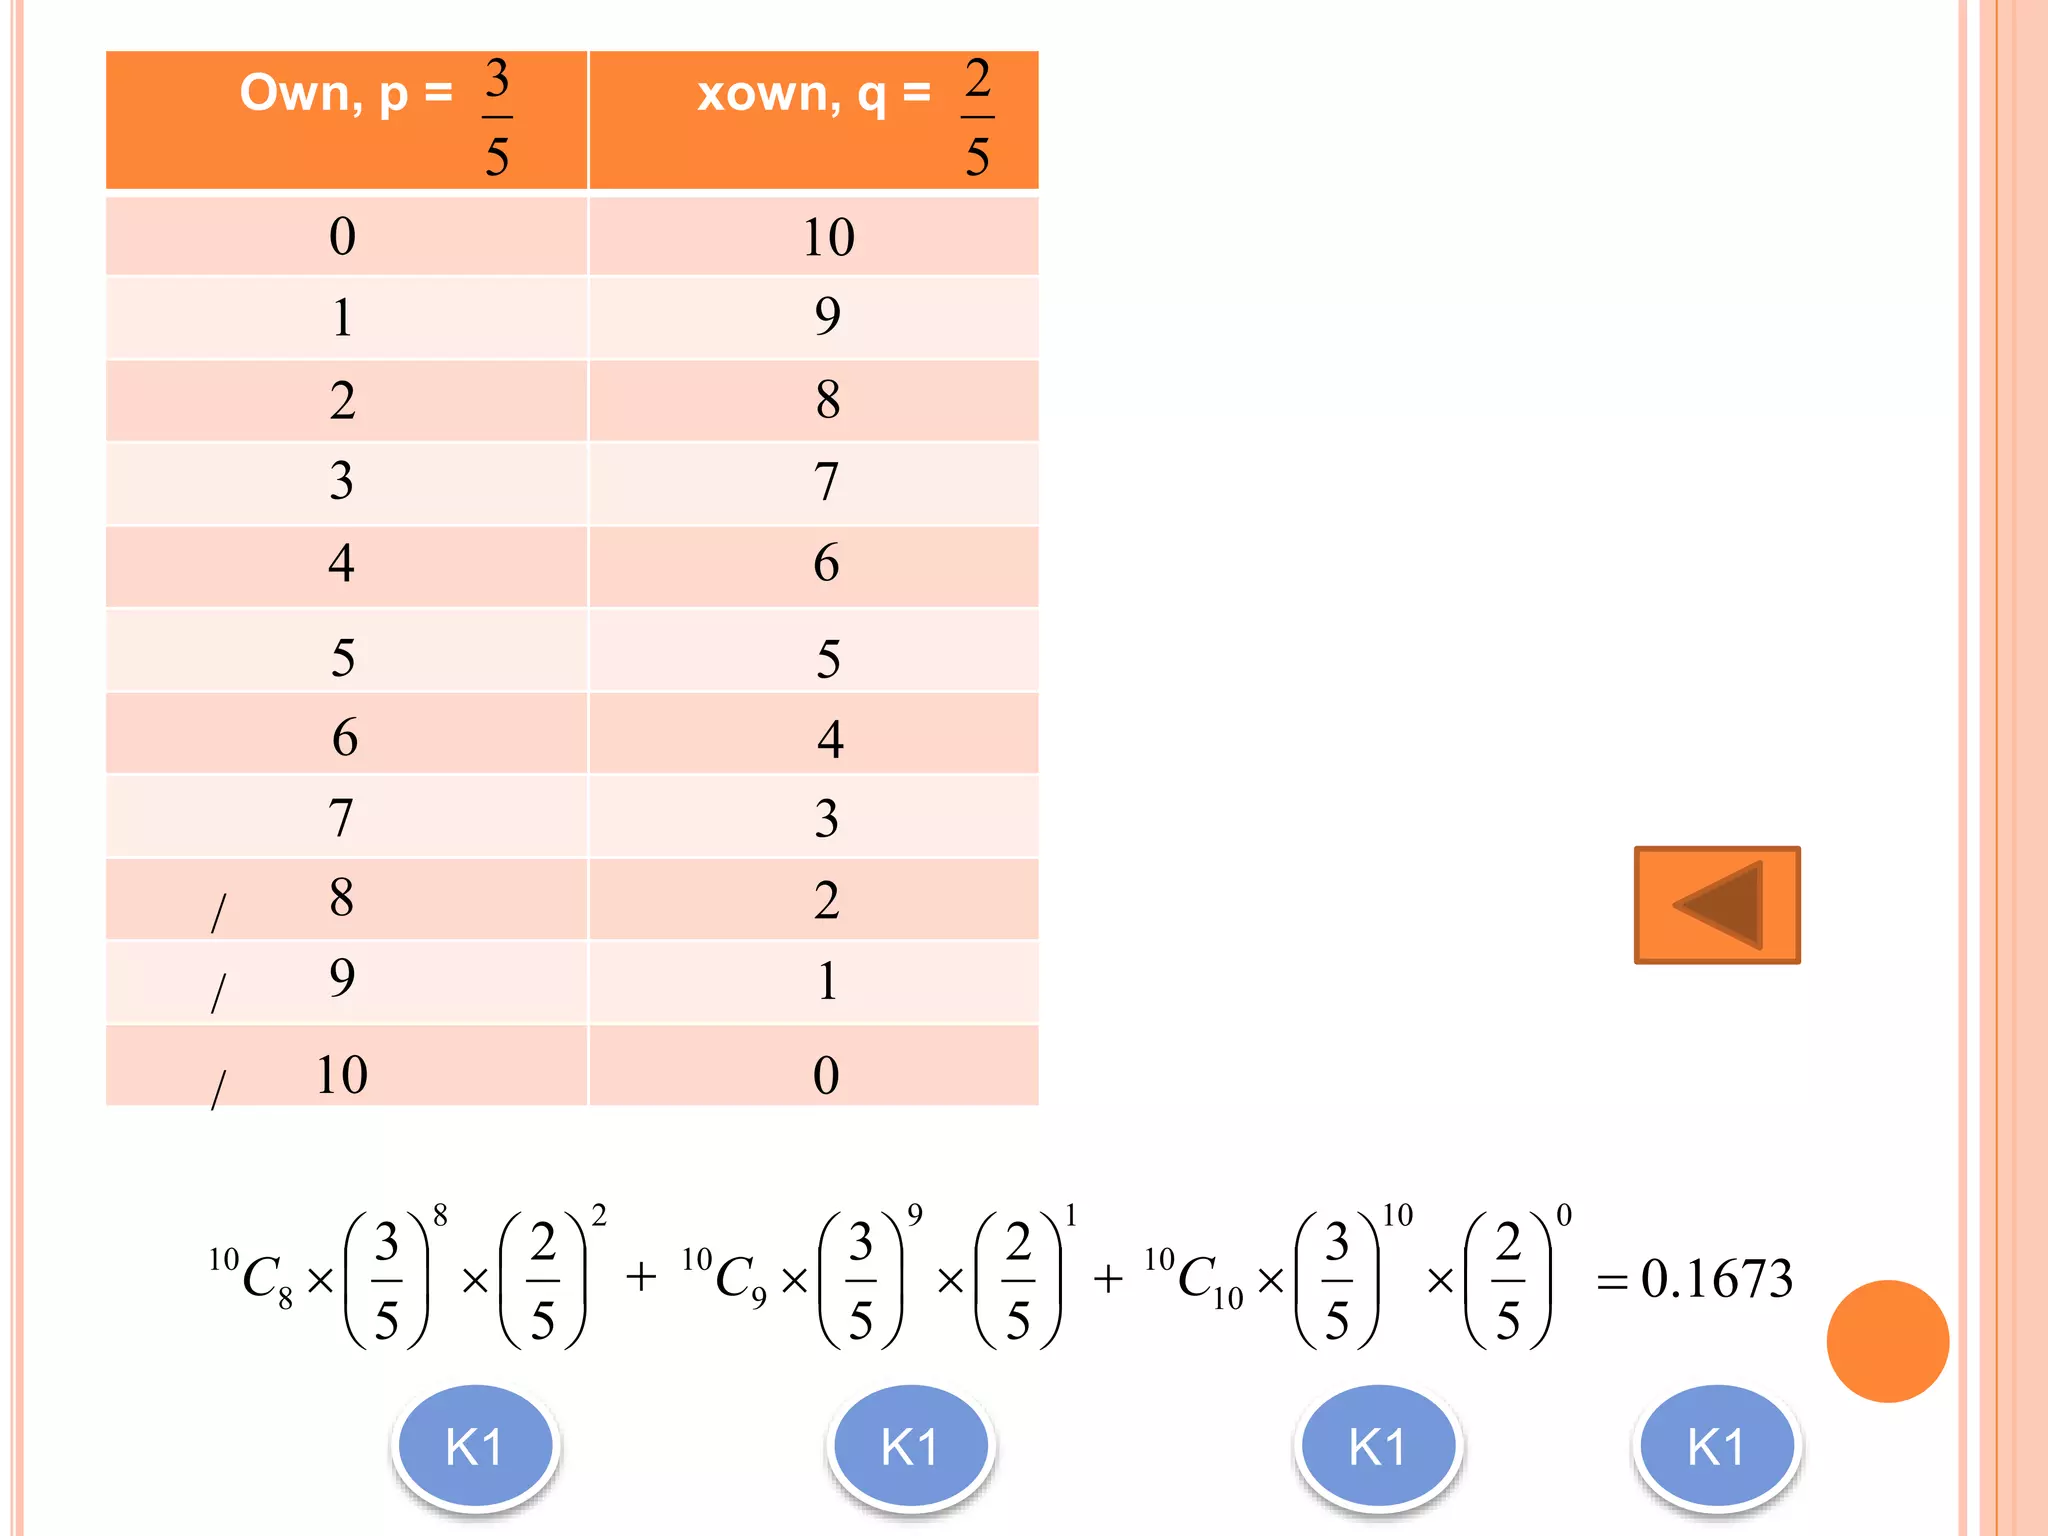
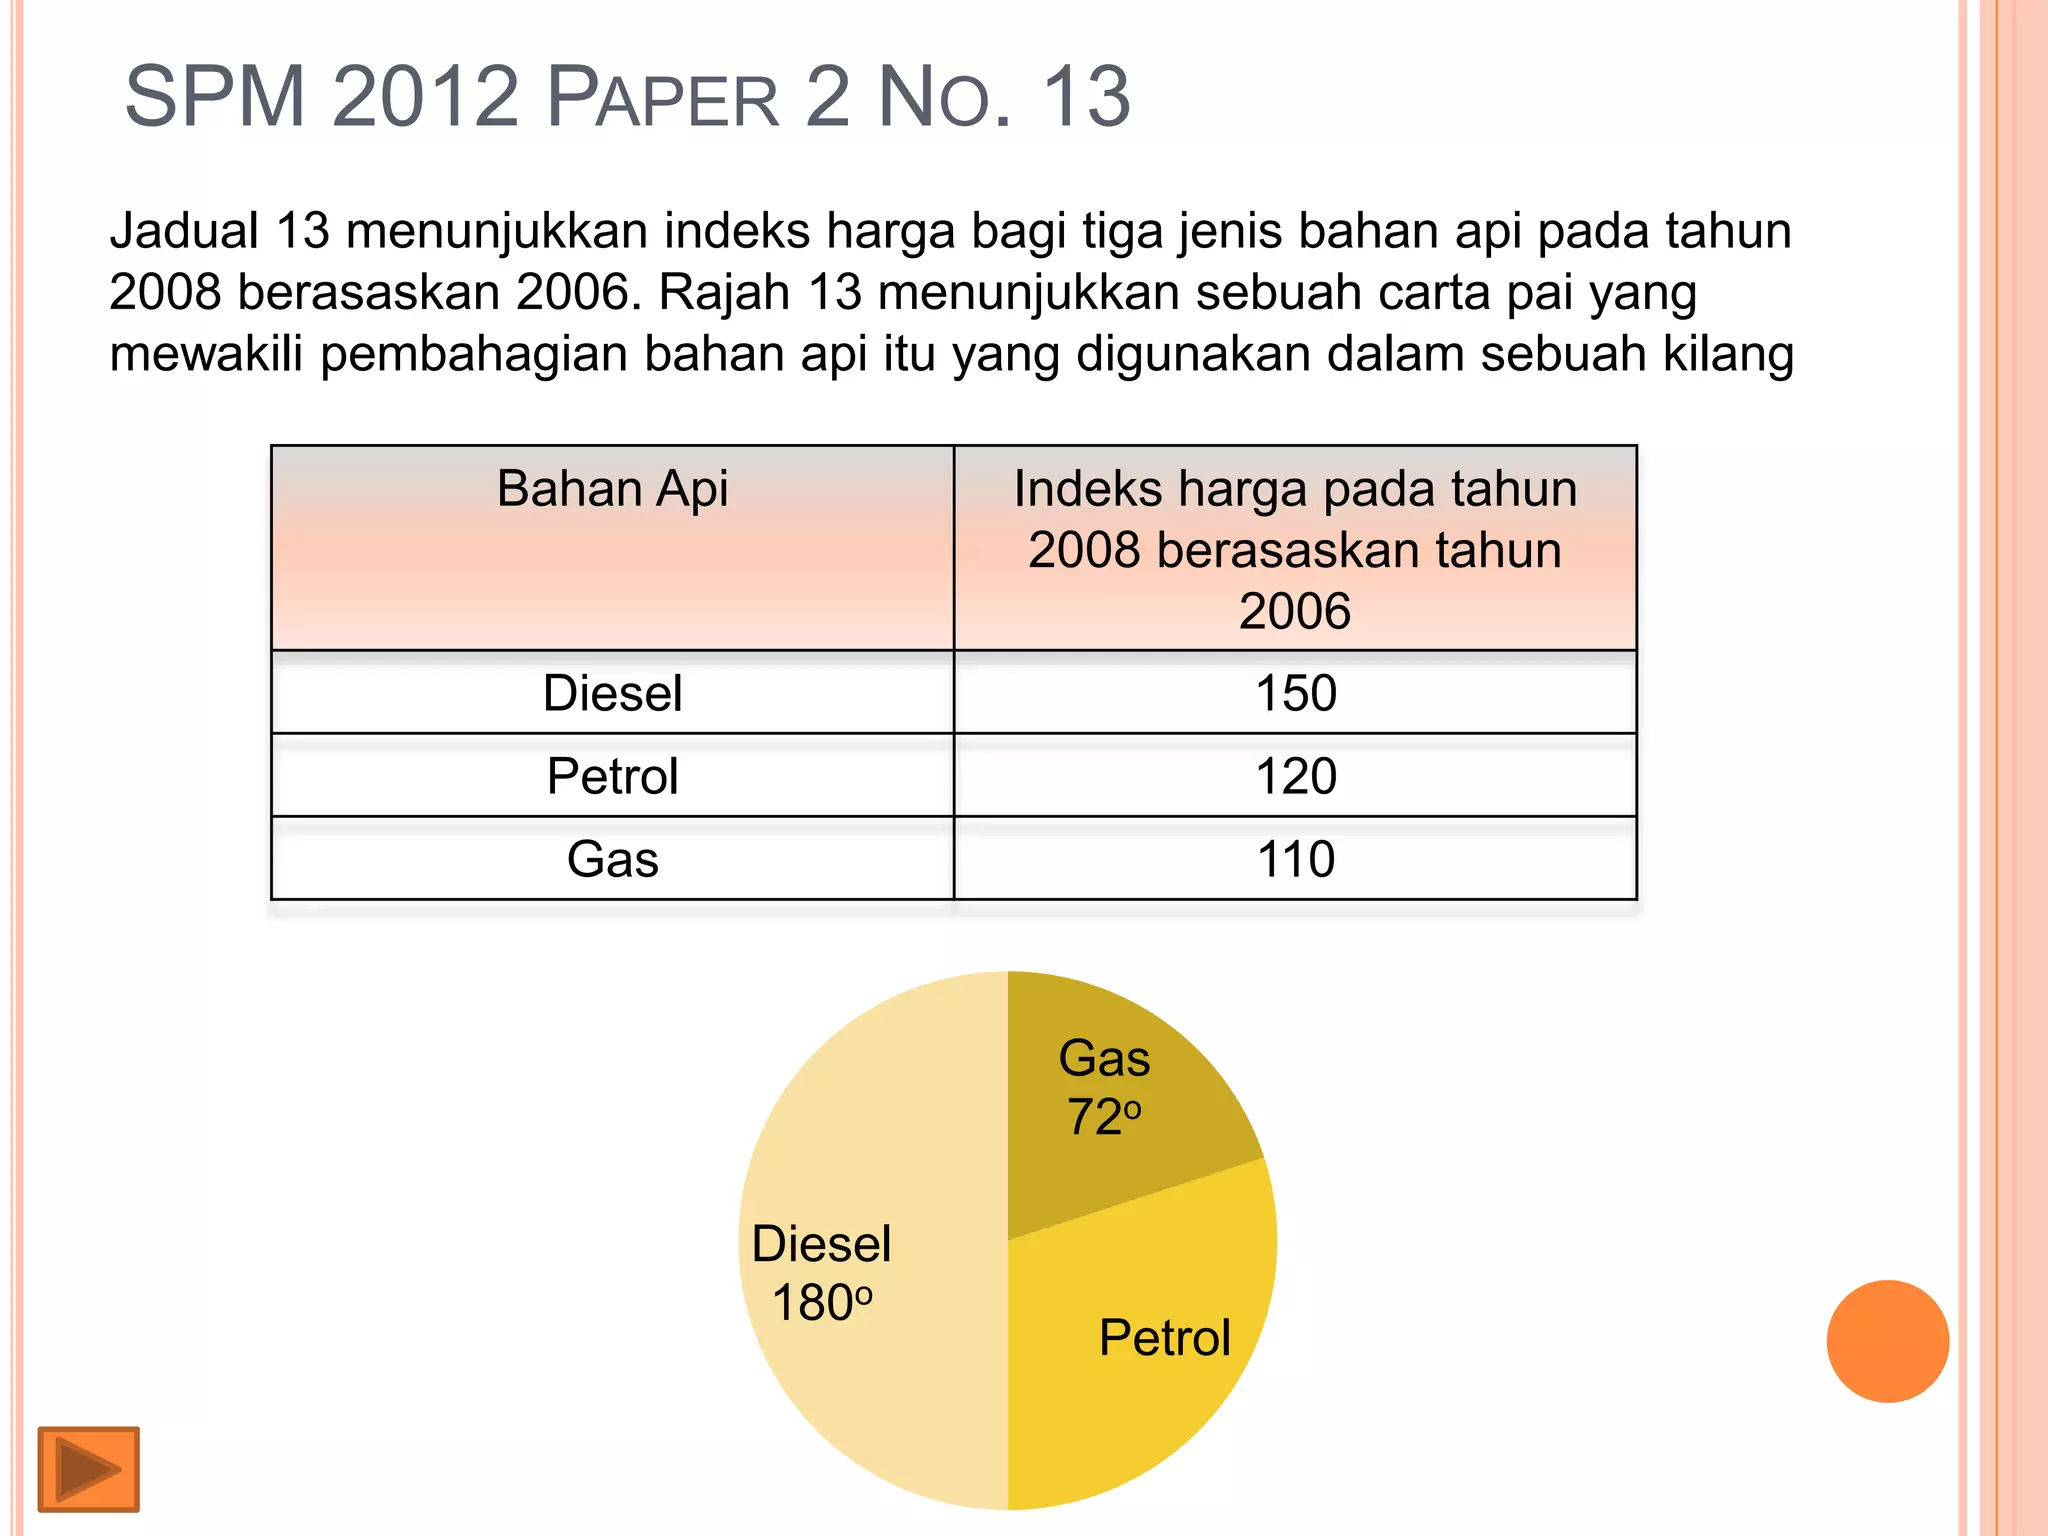
![SPM 2012 PAPER 2 NO. 11
(a) In a survey carried out in a particular district, it is
found that three out of five families own a national
car. If 10 families are chosen at random from the
district, calculate the probability that at least 8 families
own a national car [4 marks]](https://image.slidesharecdn.com/teknikmenjawabmatematiktambahan1-150118233354-conversion-gate02/75/Teknik-menjawab-matematik-tambahan-1-99-2048.jpg)


![(a) Jika kilang itu membelanjakan RM9000 seminggu untuk diesel
dalam tahun 2008, cari perbelanjaan yang sepadan untuk diesel
dalam tahun 2006
[2 markah]
100
2006
2008
20082006
Q
Q
I
9000RM2008Q
100
9000
150
2006
Q
K1
100
150
9000
2006 Q
60002006 Q N1](https://image.slidesharecdn.com/teknikmenjawabmatematiktambahan1-150118233354-conversion-gate02/75/Teknik-menjawab-matematik-tambahan-1-173-2048.jpg)
![(b) Hitung indeks gubahan bagi perbelanjaan bahan api kilang itu dalam
tahun 2008 berasaskan 2006
[3 markah]
W
WI
I ii
360
)72(110)108(120)180(150
20082006
I K2
133 N1](https://image.slidesharecdn.com/teknikmenjawabmatematiktambahan1-150118233354-conversion-gate02/75/Teknik-menjawab-matematik-tambahan-1-174-2048.jpg)
![(d) Harga diesel meningkat sebanyak 30%, harga petrol
meningkat 20% sementara harga gas tidak berubah dari
tahun 2008 ke tahun 2010. Hitungkan indeks gubahan bagi
perbelanjaan bahan api kilang itu dalam tahun 2010
berasaskan tahun 2006
[3 markah]
201020082006I 150
100
130
195
201020082006I 120
100
120
144
360
)72(110)108(144)180(195 **
20102006
I K2
7.162 N1](https://image.slidesharecdn.com/teknikmenjawabmatematiktambahan1-150118233354-conversion-gate02/75/Teknik-menjawab-matematik-tambahan-1-176-2048.jpg)

![(a) Cari nilai x, y dan z
[4 markah]
100
2005
2007
20072005
Q
Q
I
100
4
5
x 125 P1
100
3
150
y
100
3
150y 5.4 P1
100
3
120
z
120
100
3z 5.2
P1
K1](https://image.slidesharecdn.com/teknikmenjawabmatematiktambahan1-150118233354-conversion-gate02/75/Teknik-menjawab-matematik-tambahan-1-178-2048.jpg)
![(b)Hitungkan indeks gubahan bagi kos membuat makanan
itu pada tahun 2007 berasaskan 2005
[2 markah]
W
WI
I ii
100
)24(120)48(125)12(150)16(125
20072005
I
K2
8.12620072005 I N1](https://image.slidesharecdn.com/teknikmenjawabmatematiktambahan1-150118233354-conversion-gate02/75/Teknik-menjawab-matematik-tambahan-1-179-2048.jpg)
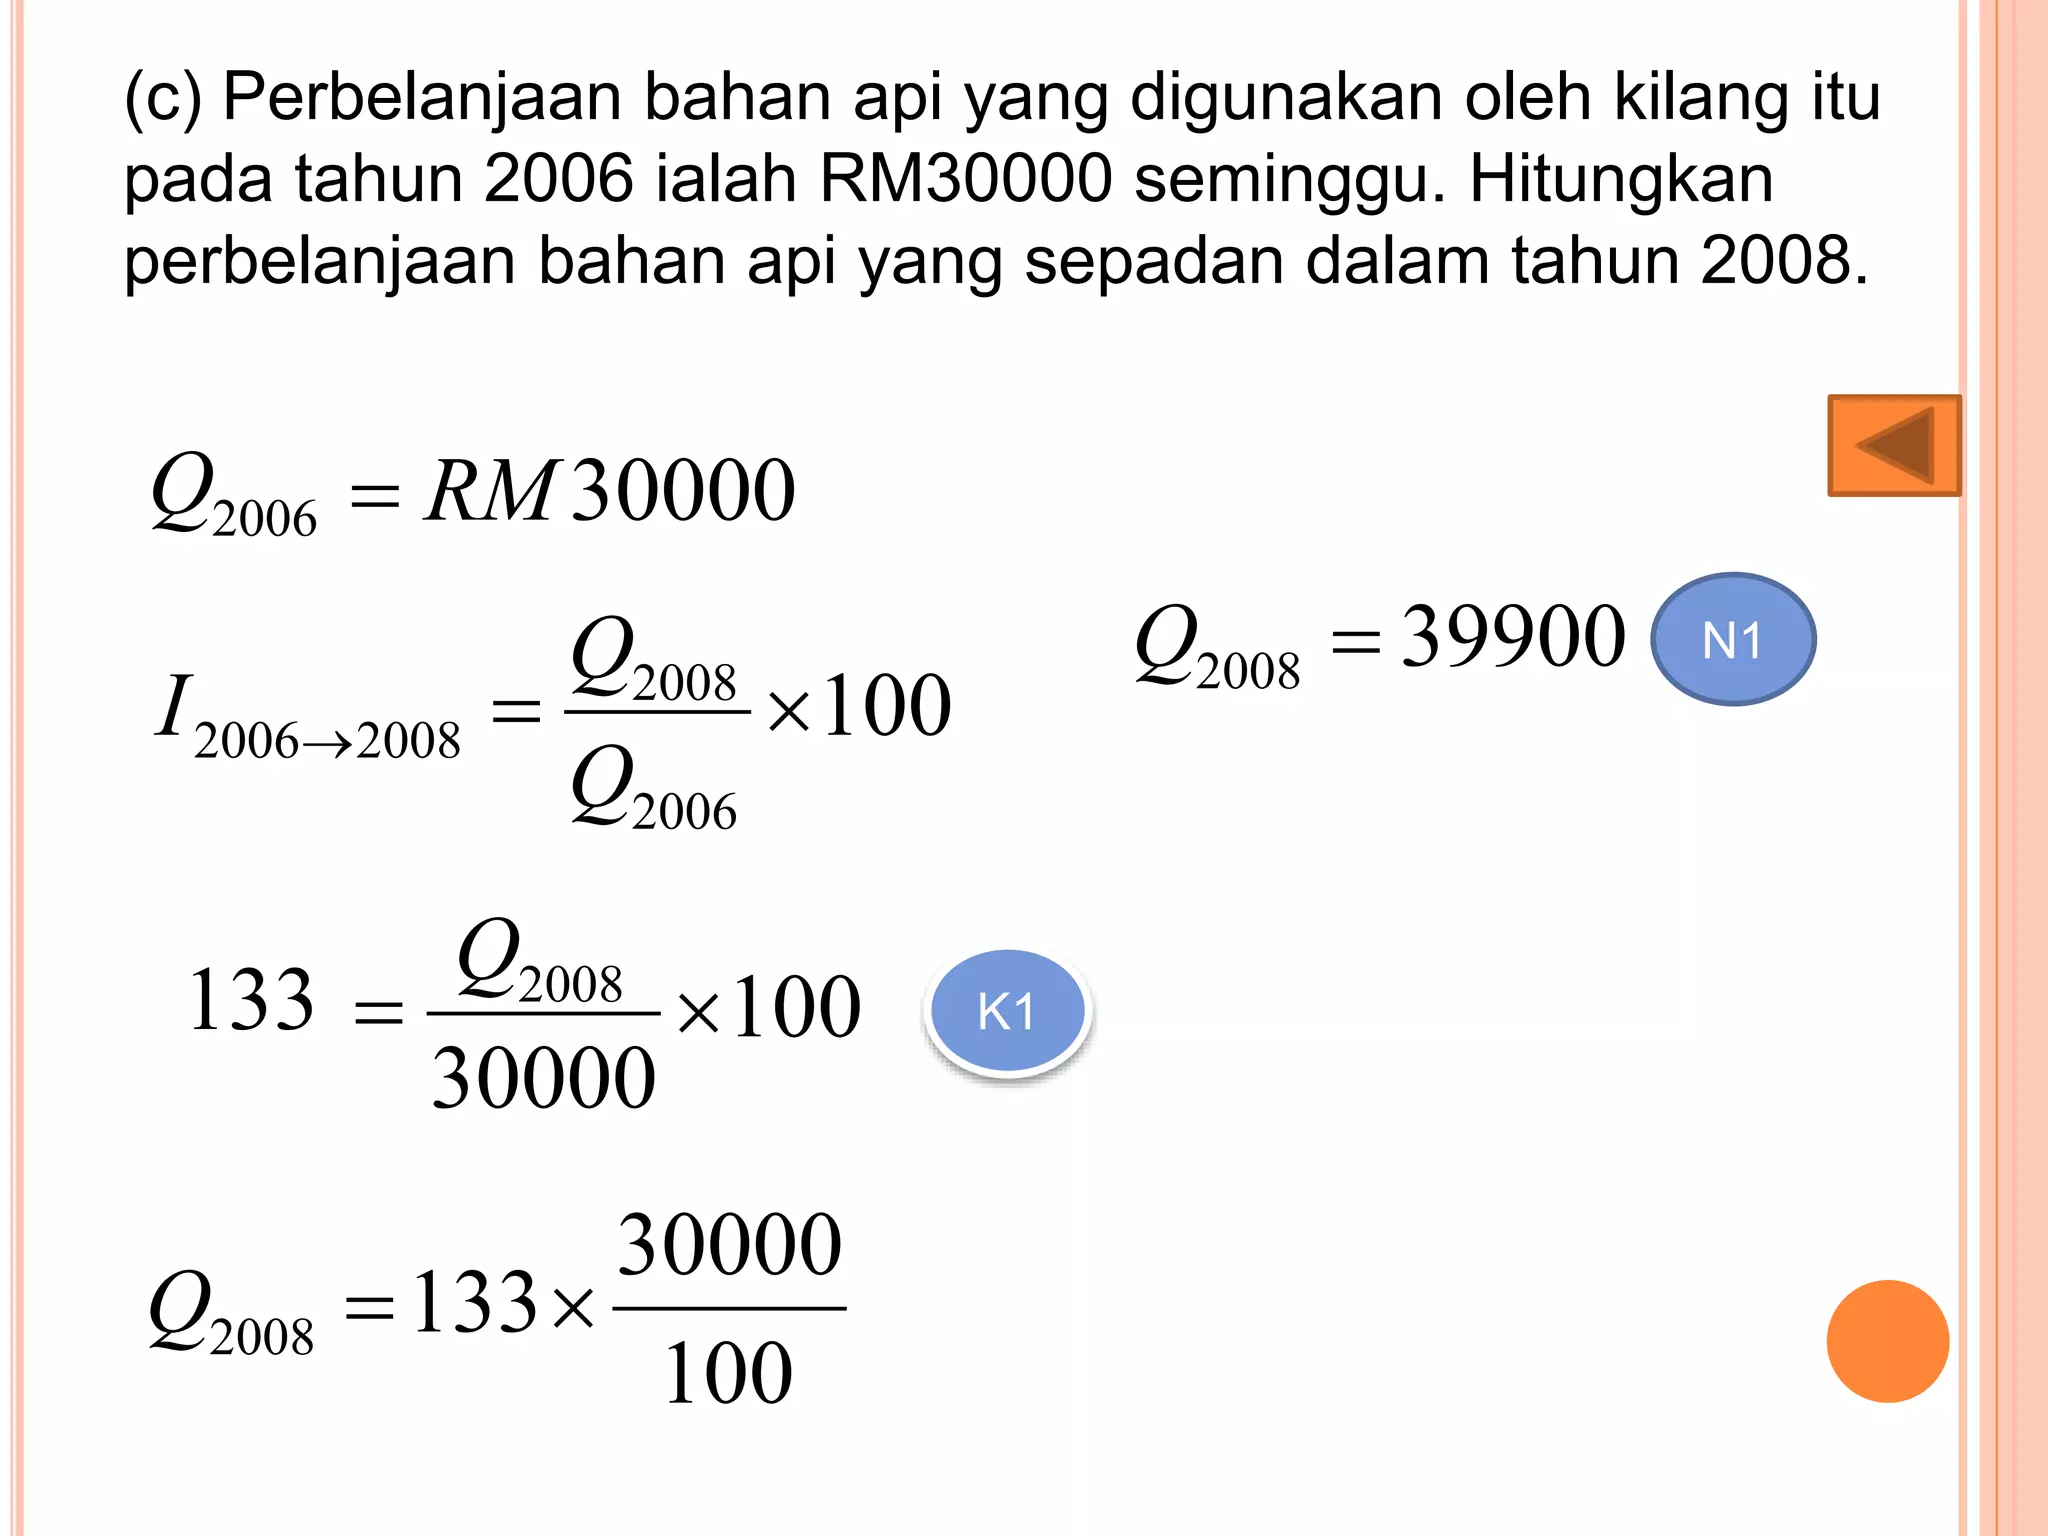
![(c) Kos untuk membuat sepeket makanan itu dalam tahun
2005 ialah RM50. Hitungkan kos yang sepadan pada tahun
2007
[2markah]
50RM2005Q
100
2005
2007
20072005
Q
Q
I
100
50
2007
Q
8.126 K1
100
50
8.1262007 Q
4.632008 Q N1](https://image.slidesharecdn.com/teknikmenjawabmatematiktambahan1-150118233354-conversion-gate02/75/Teknik-menjawab-matematik-tambahan-1-180-2048.jpg)
![(d) Kos bagi semua bahan makanan itu meningkat
sebanyak 15% dari tahun 2007 ke tahun 2009. Cari indeks
gubahan bagi tahun 2009 berasaskan 2005
[2 markah]
8.12620072005 I
100
115
8.126200920072005 I K1
82.14520092005 I N1](https://image.slidesharecdn.com/teknikmenjawabmatematiktambahan1-150118233354-conversion-gate02/75/Teknik-menjawab-matematik-tambahan-1-181-2048.jpg)


![(c) Indeks gubahan untuk kos pengeluaran beg itu pada
tahun 2006 berasaskan 2004 ialah 118.5. Kos bahan-bahan
P, Q, dan R yang digunakan mengikut nisbah 2:1:3. Cari
nilai y
[3 markah]
W
WI
I ii
5.118
312
)3()1(116)2(125
0604
y
I K2
115y N1](https://image.slidesharecdn.com/teknikmenjawabmatematiktambahan1-150118233354-conversion-gate02/75/Teknik-menjawab-matematik-tambahan-1-186-2048.jpg)
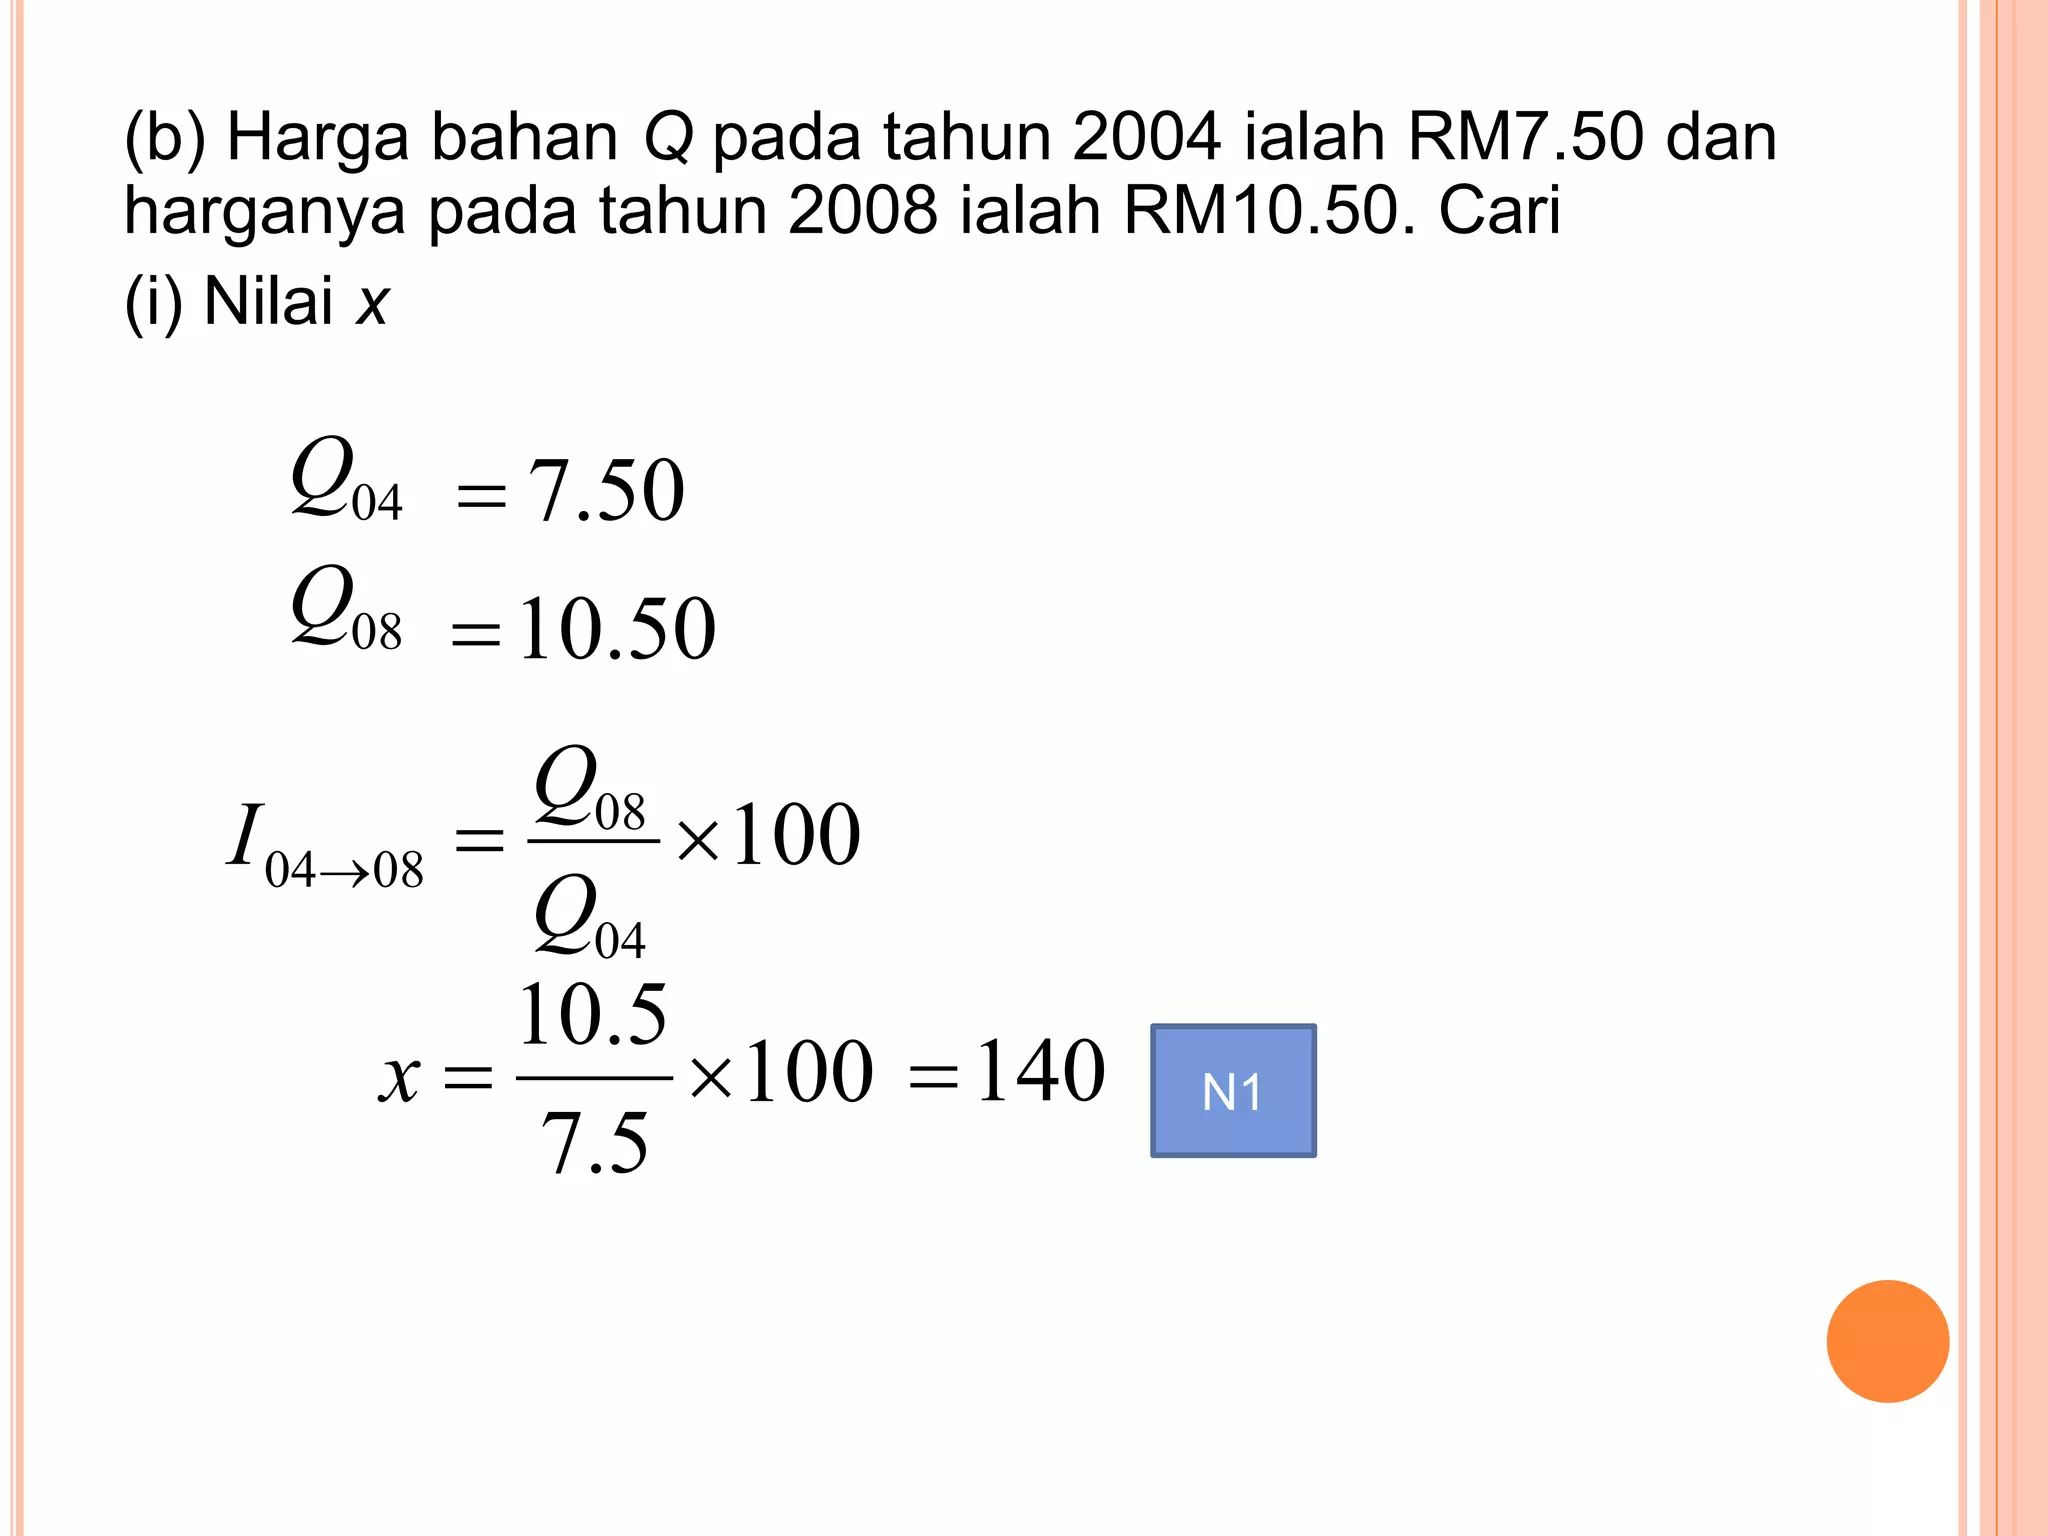
![(d) Diberi harga beg itu pada tahun 2006 ialah RM47.40.
Cari harga yang sepadan bagi beg itu pada tahun 2004
[2 markah]
40.4706Q
100
04
06
0604
Q
Q
I
100
40.47
5.118
04
Q
K1
100
5.118
40.47
04 Q 40 N1](https://image.slidesharecdn.com/teknikmenjawabmatematiktambahan1-150118233354-conversion-gate02/75/Teknik-menjawab-matematik-tambahan-1-187-2048.jpg)


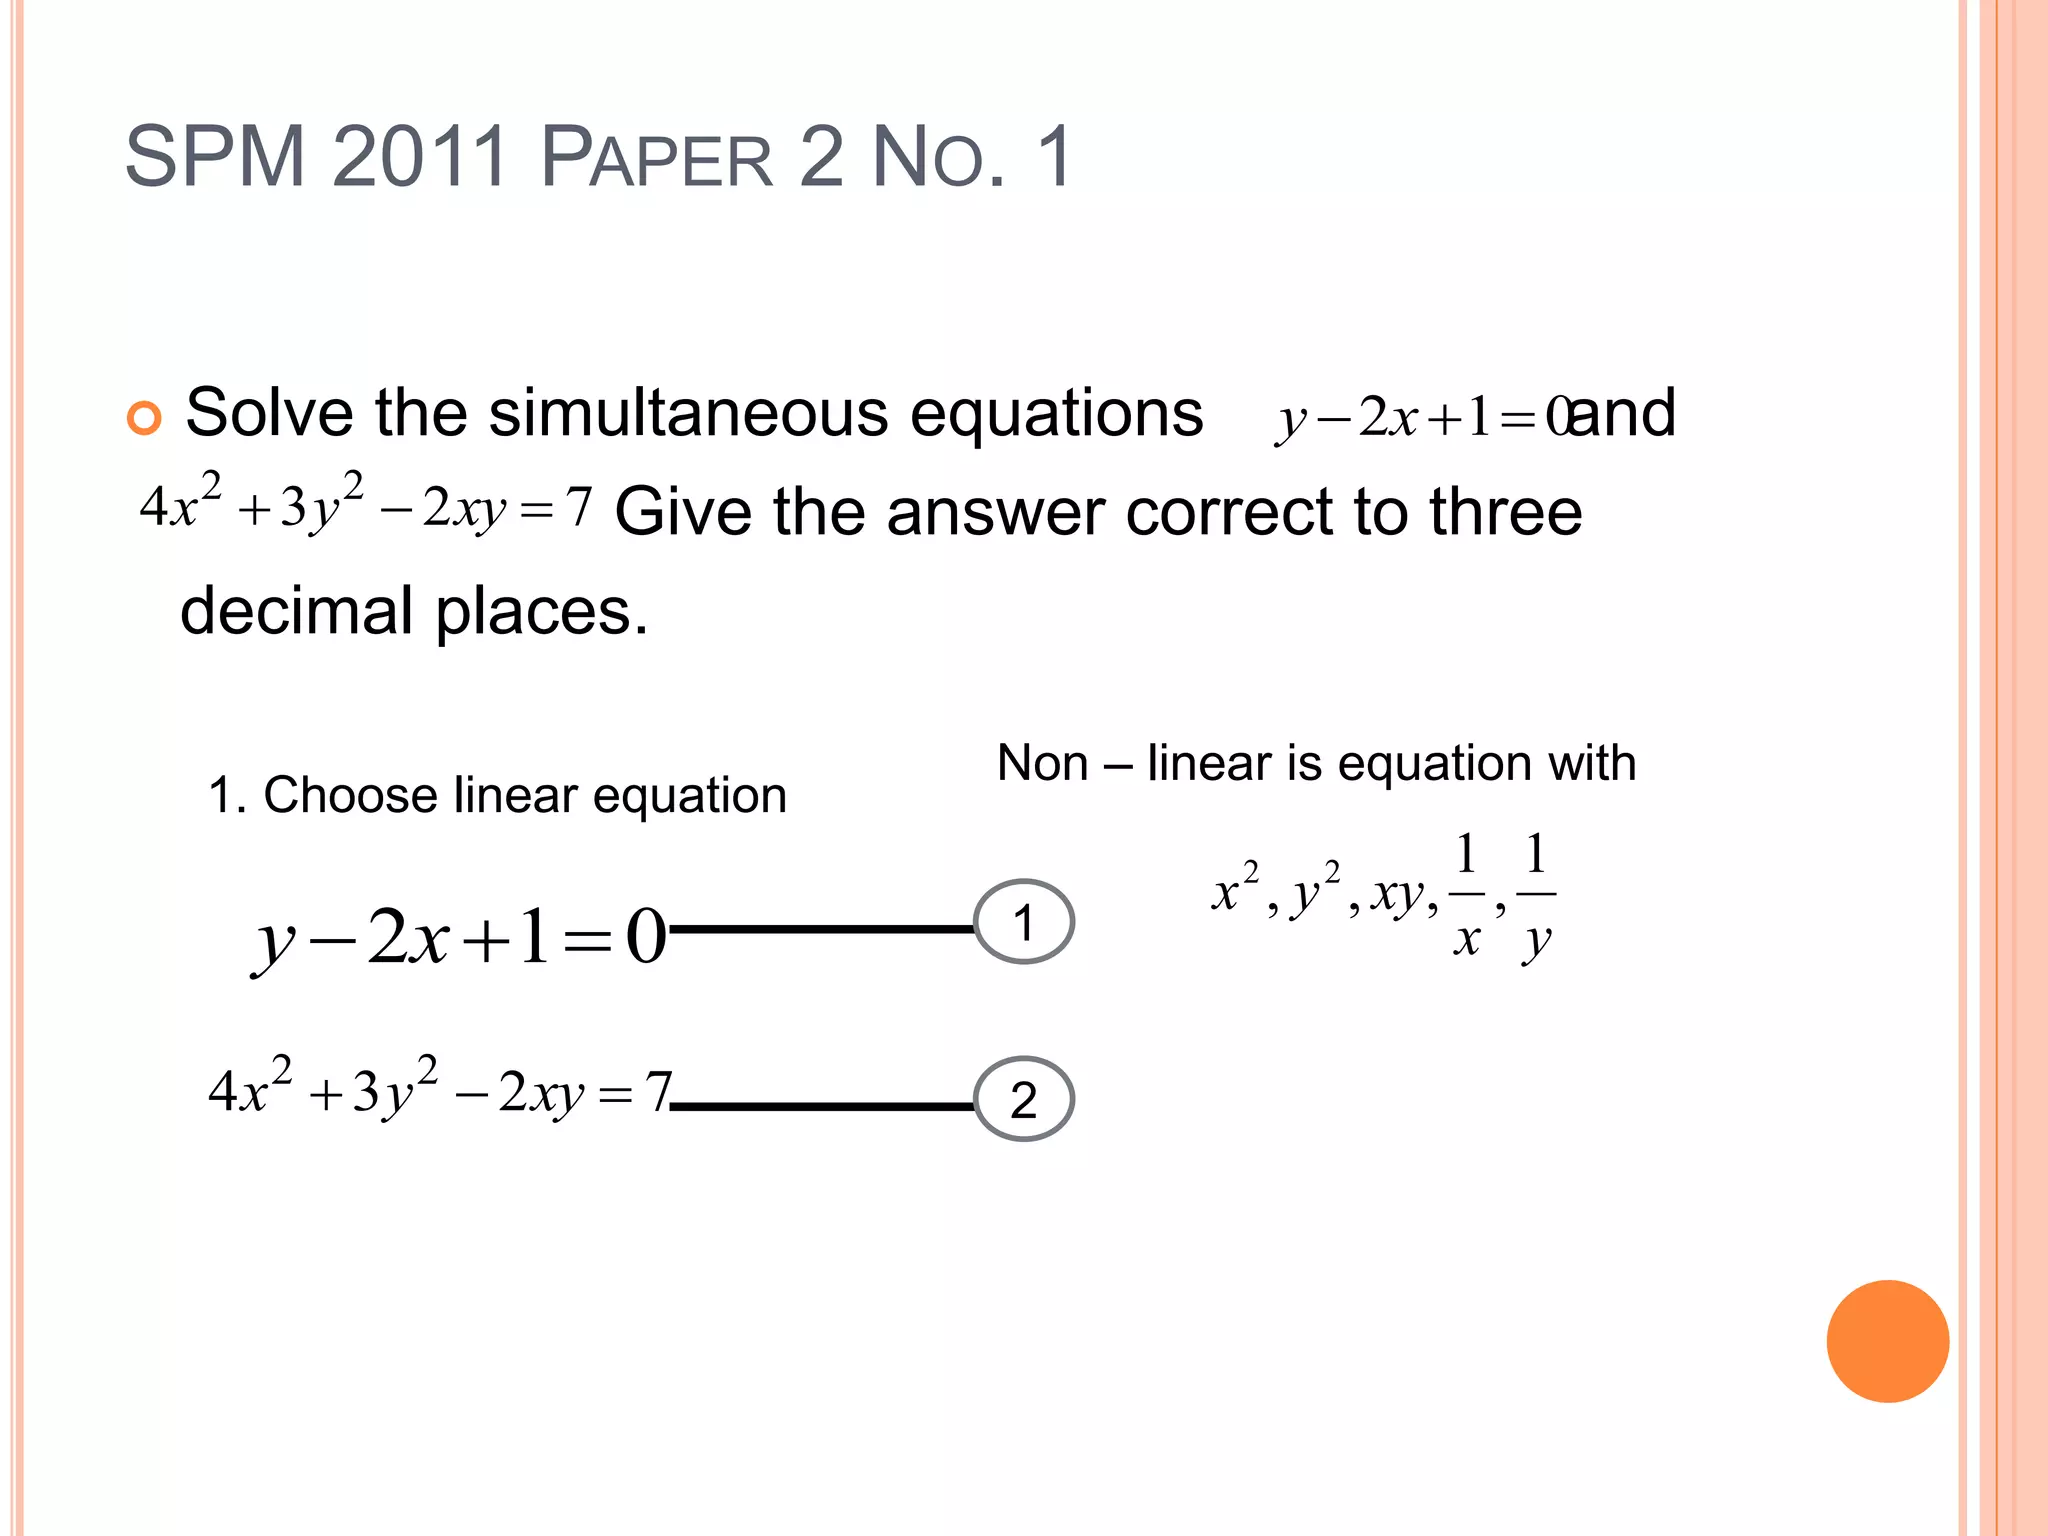
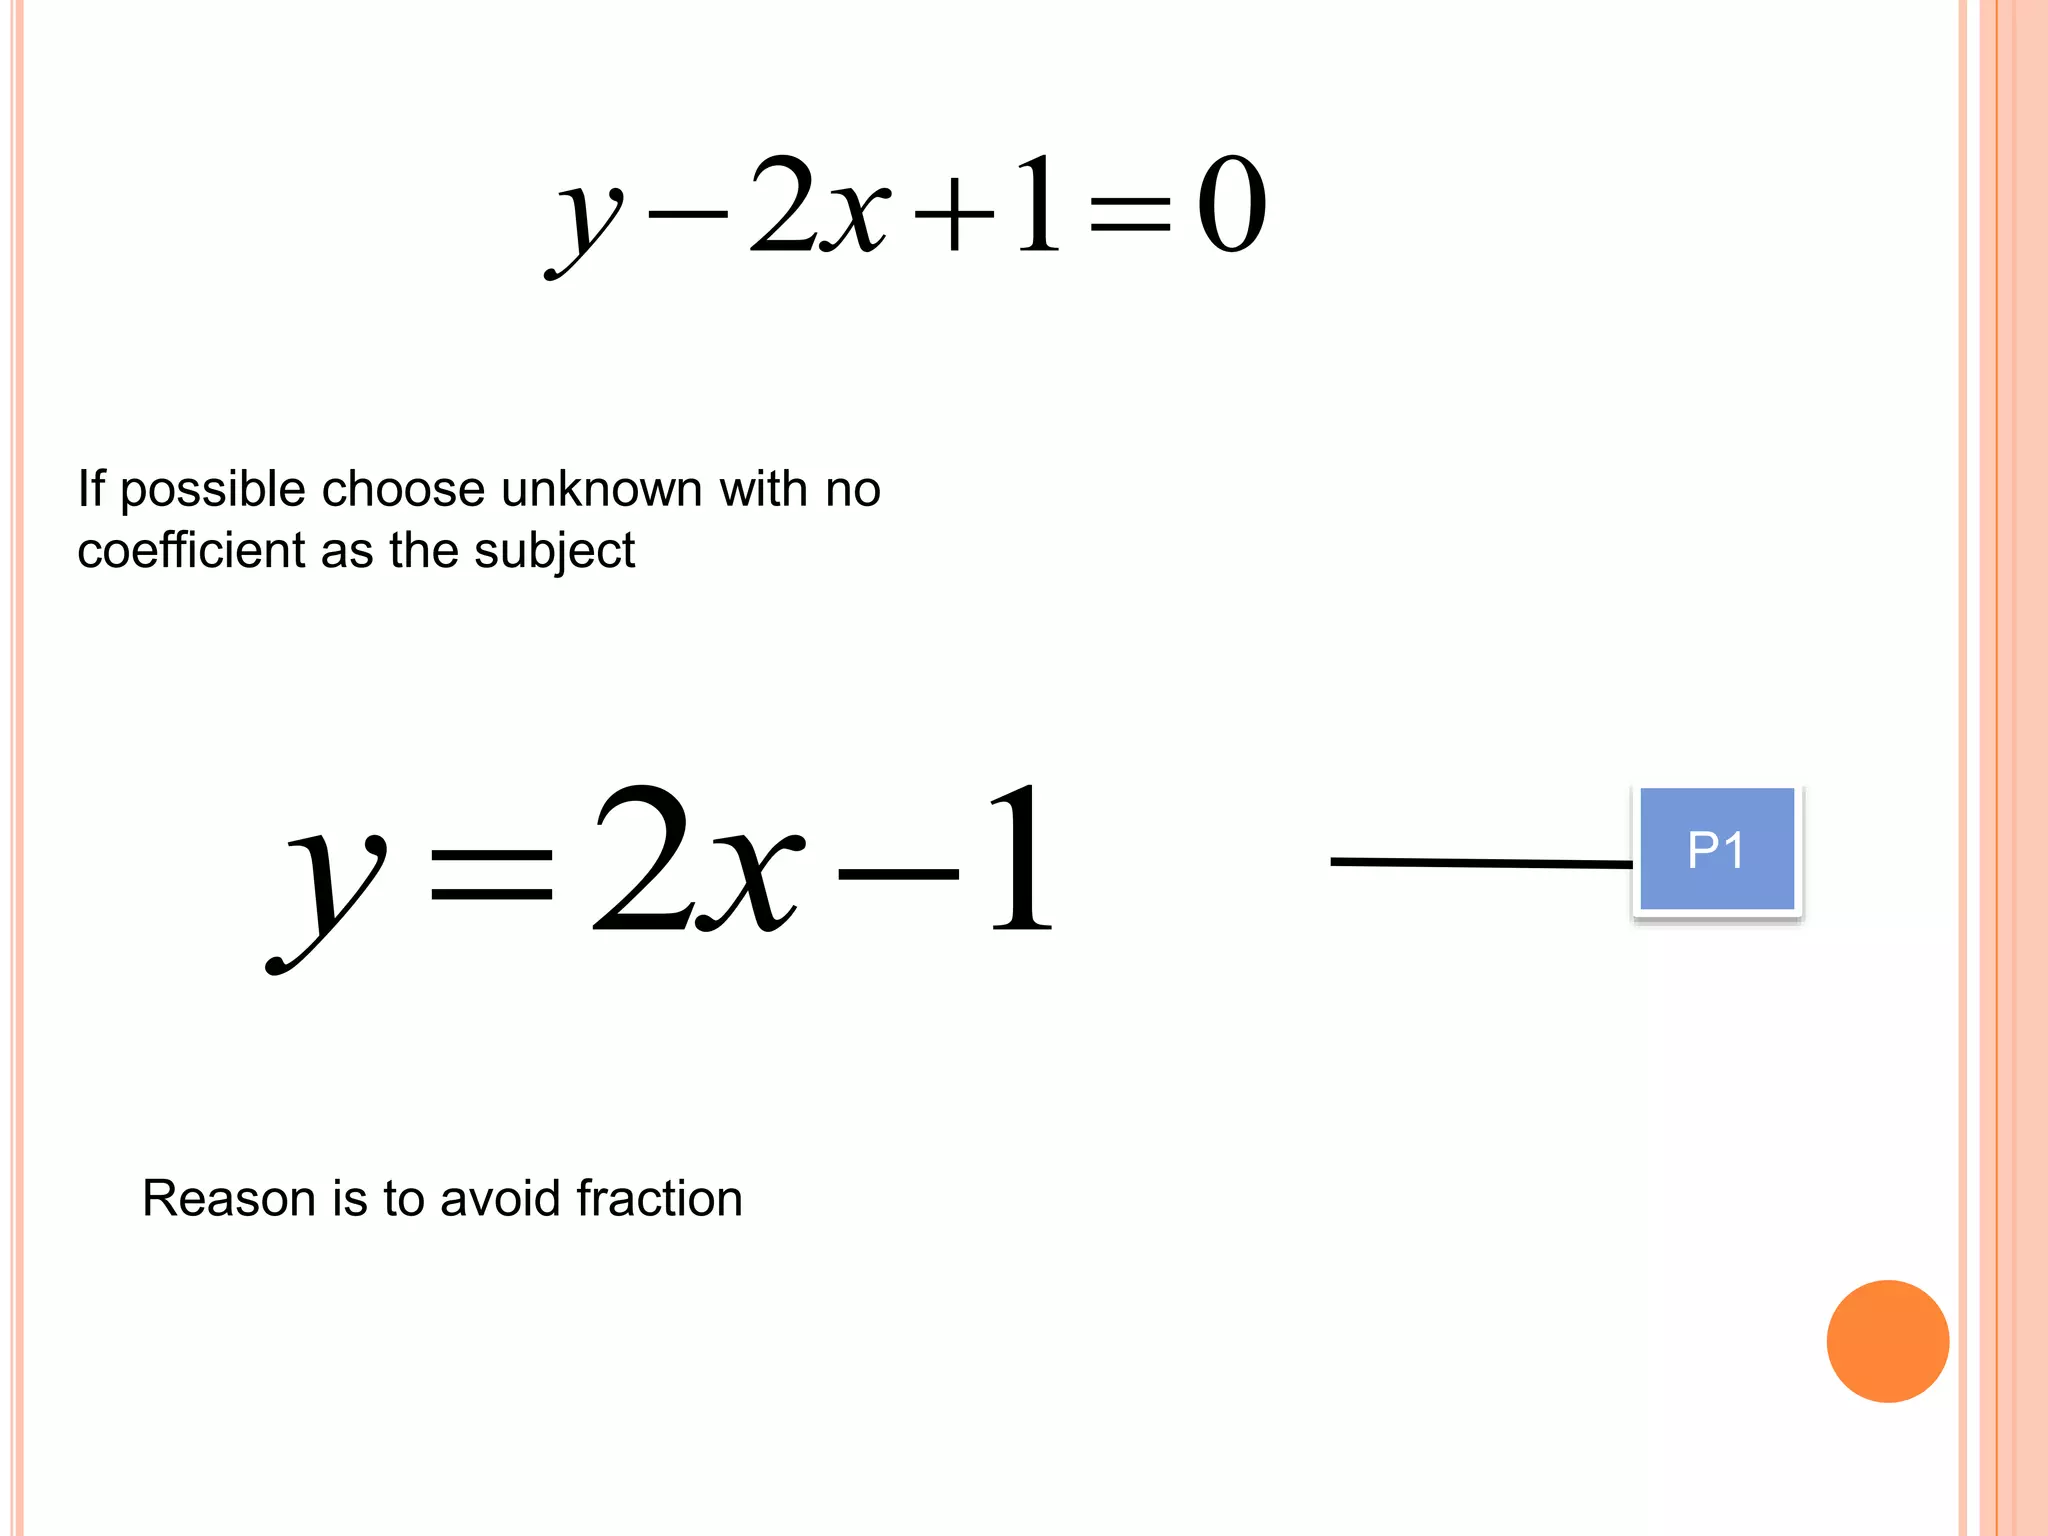
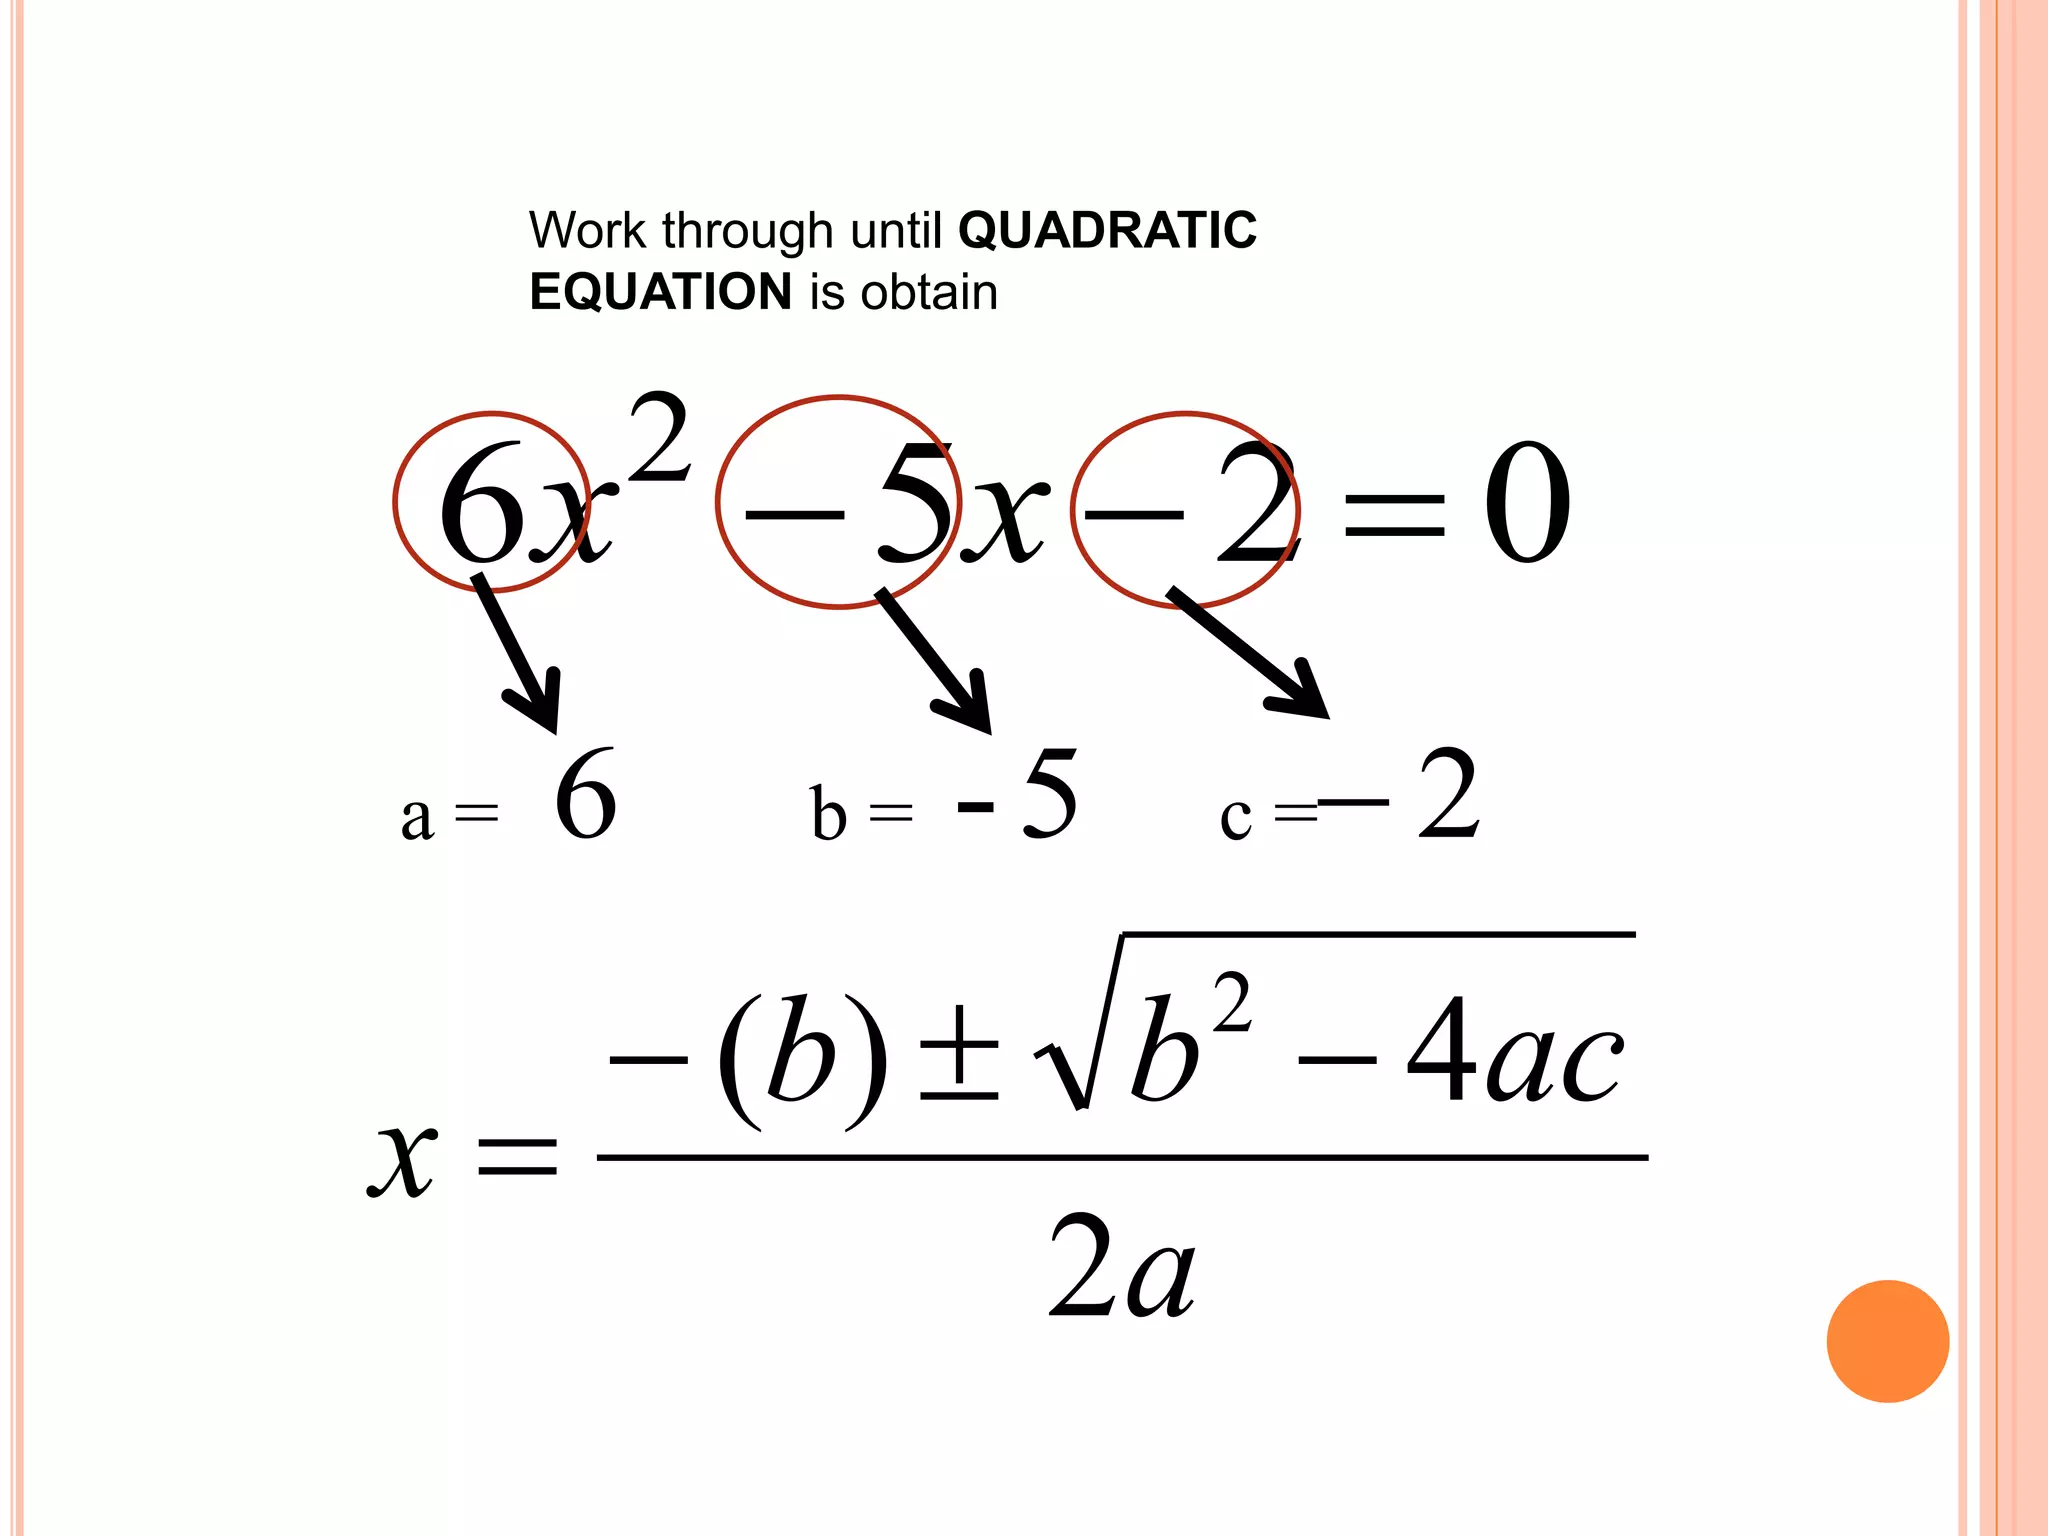
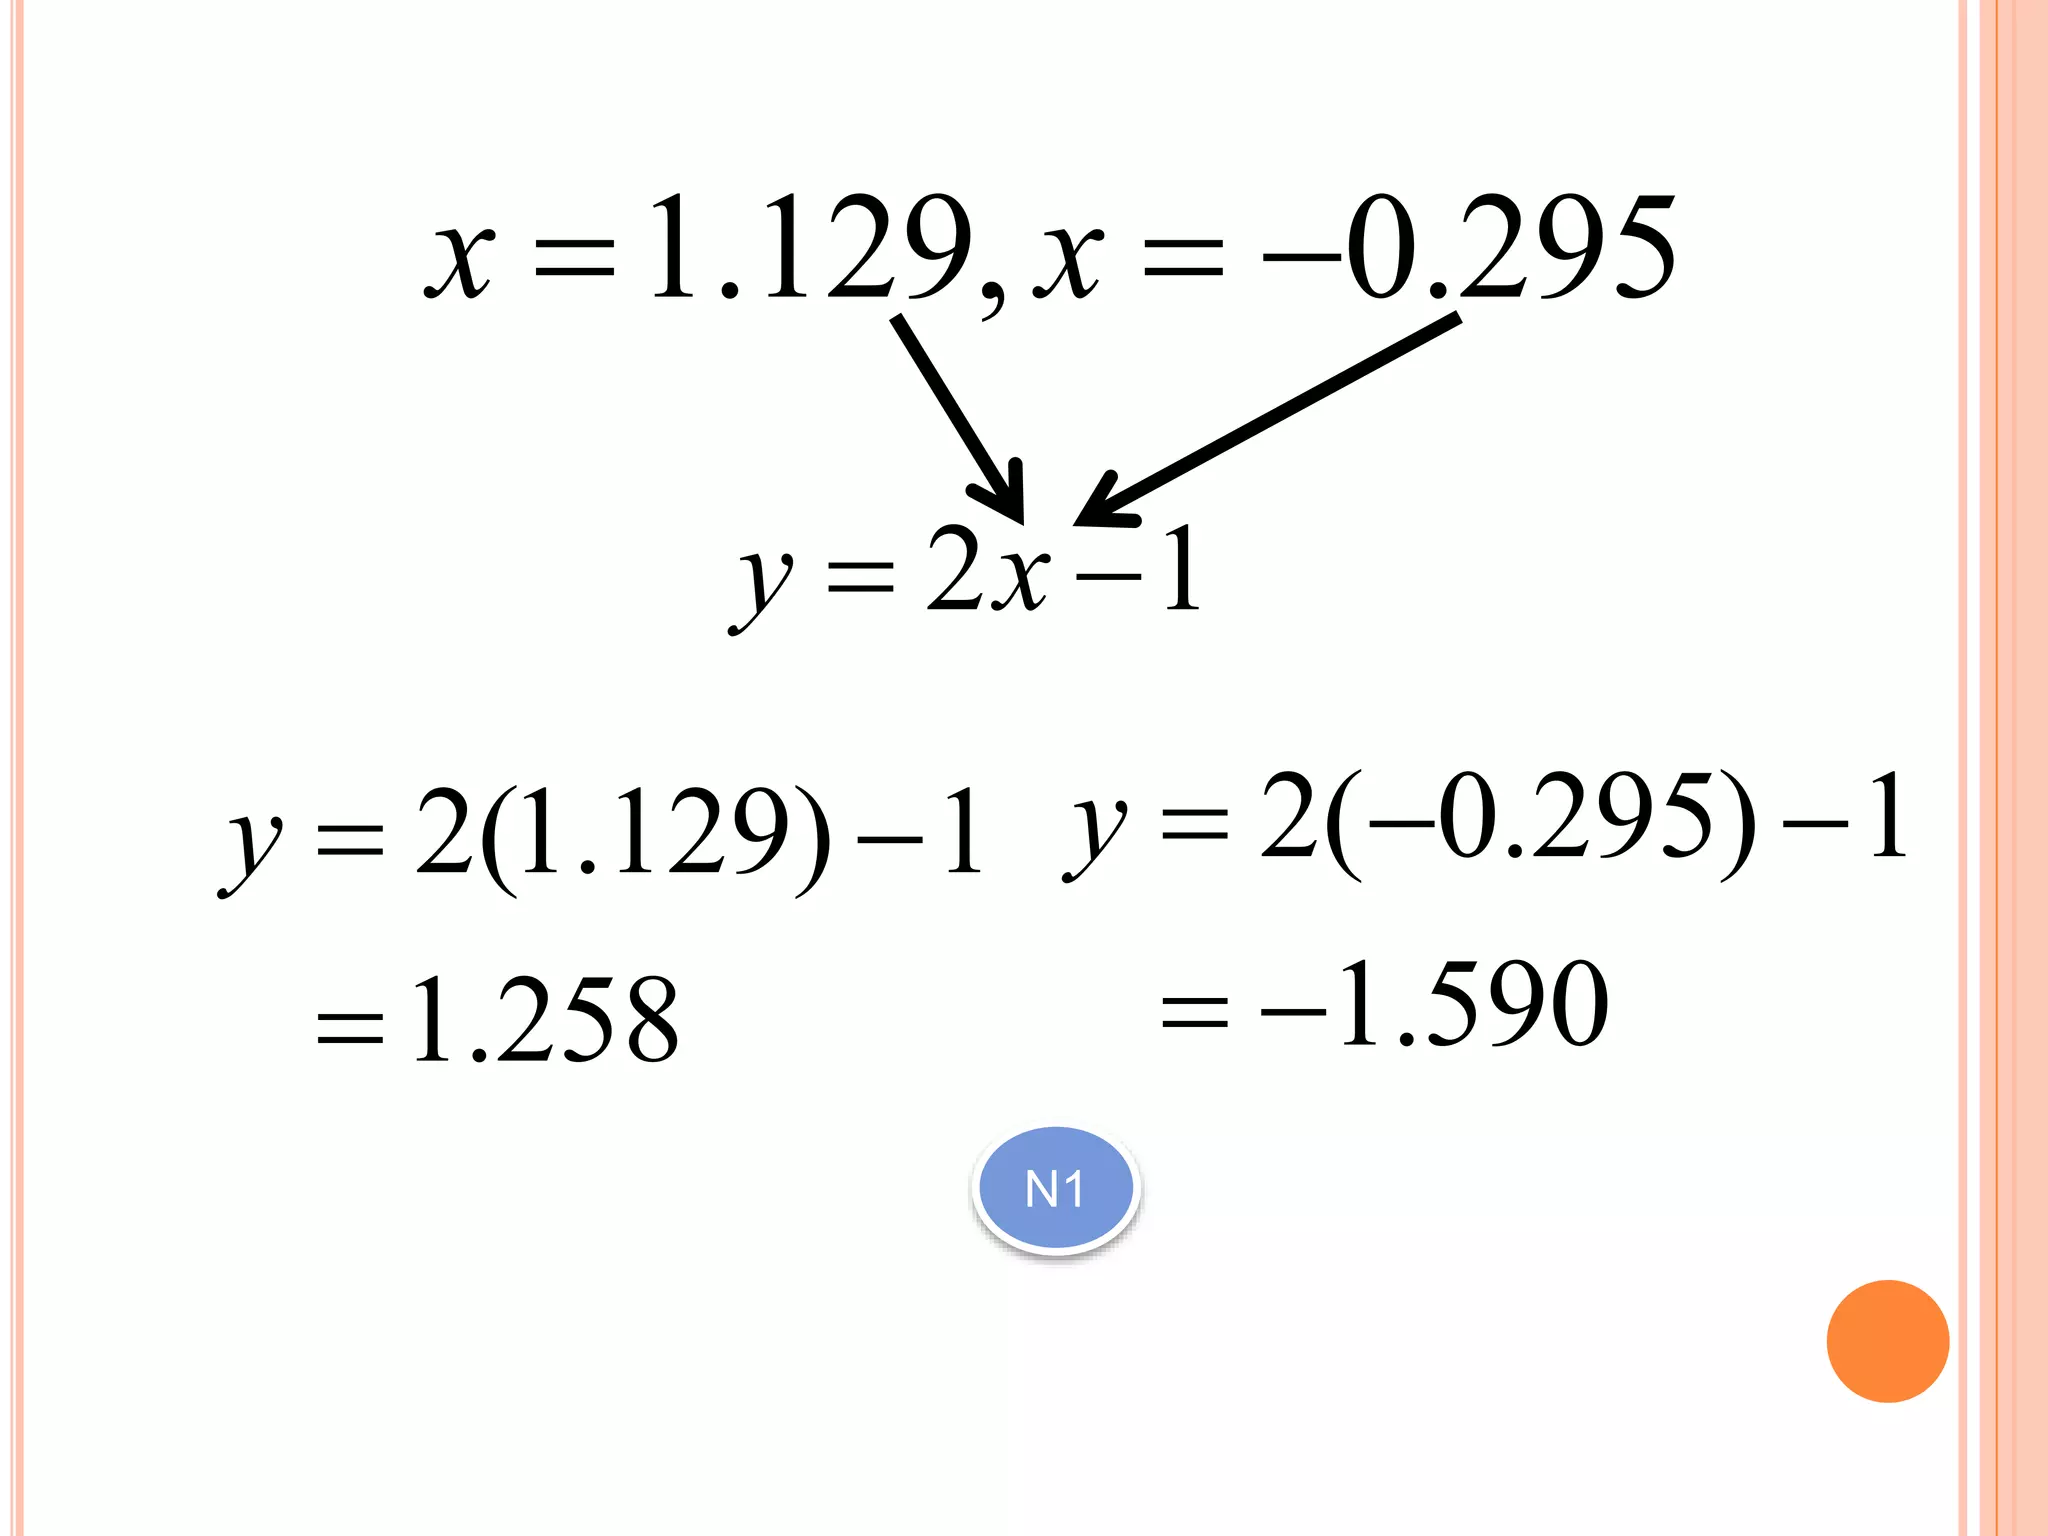
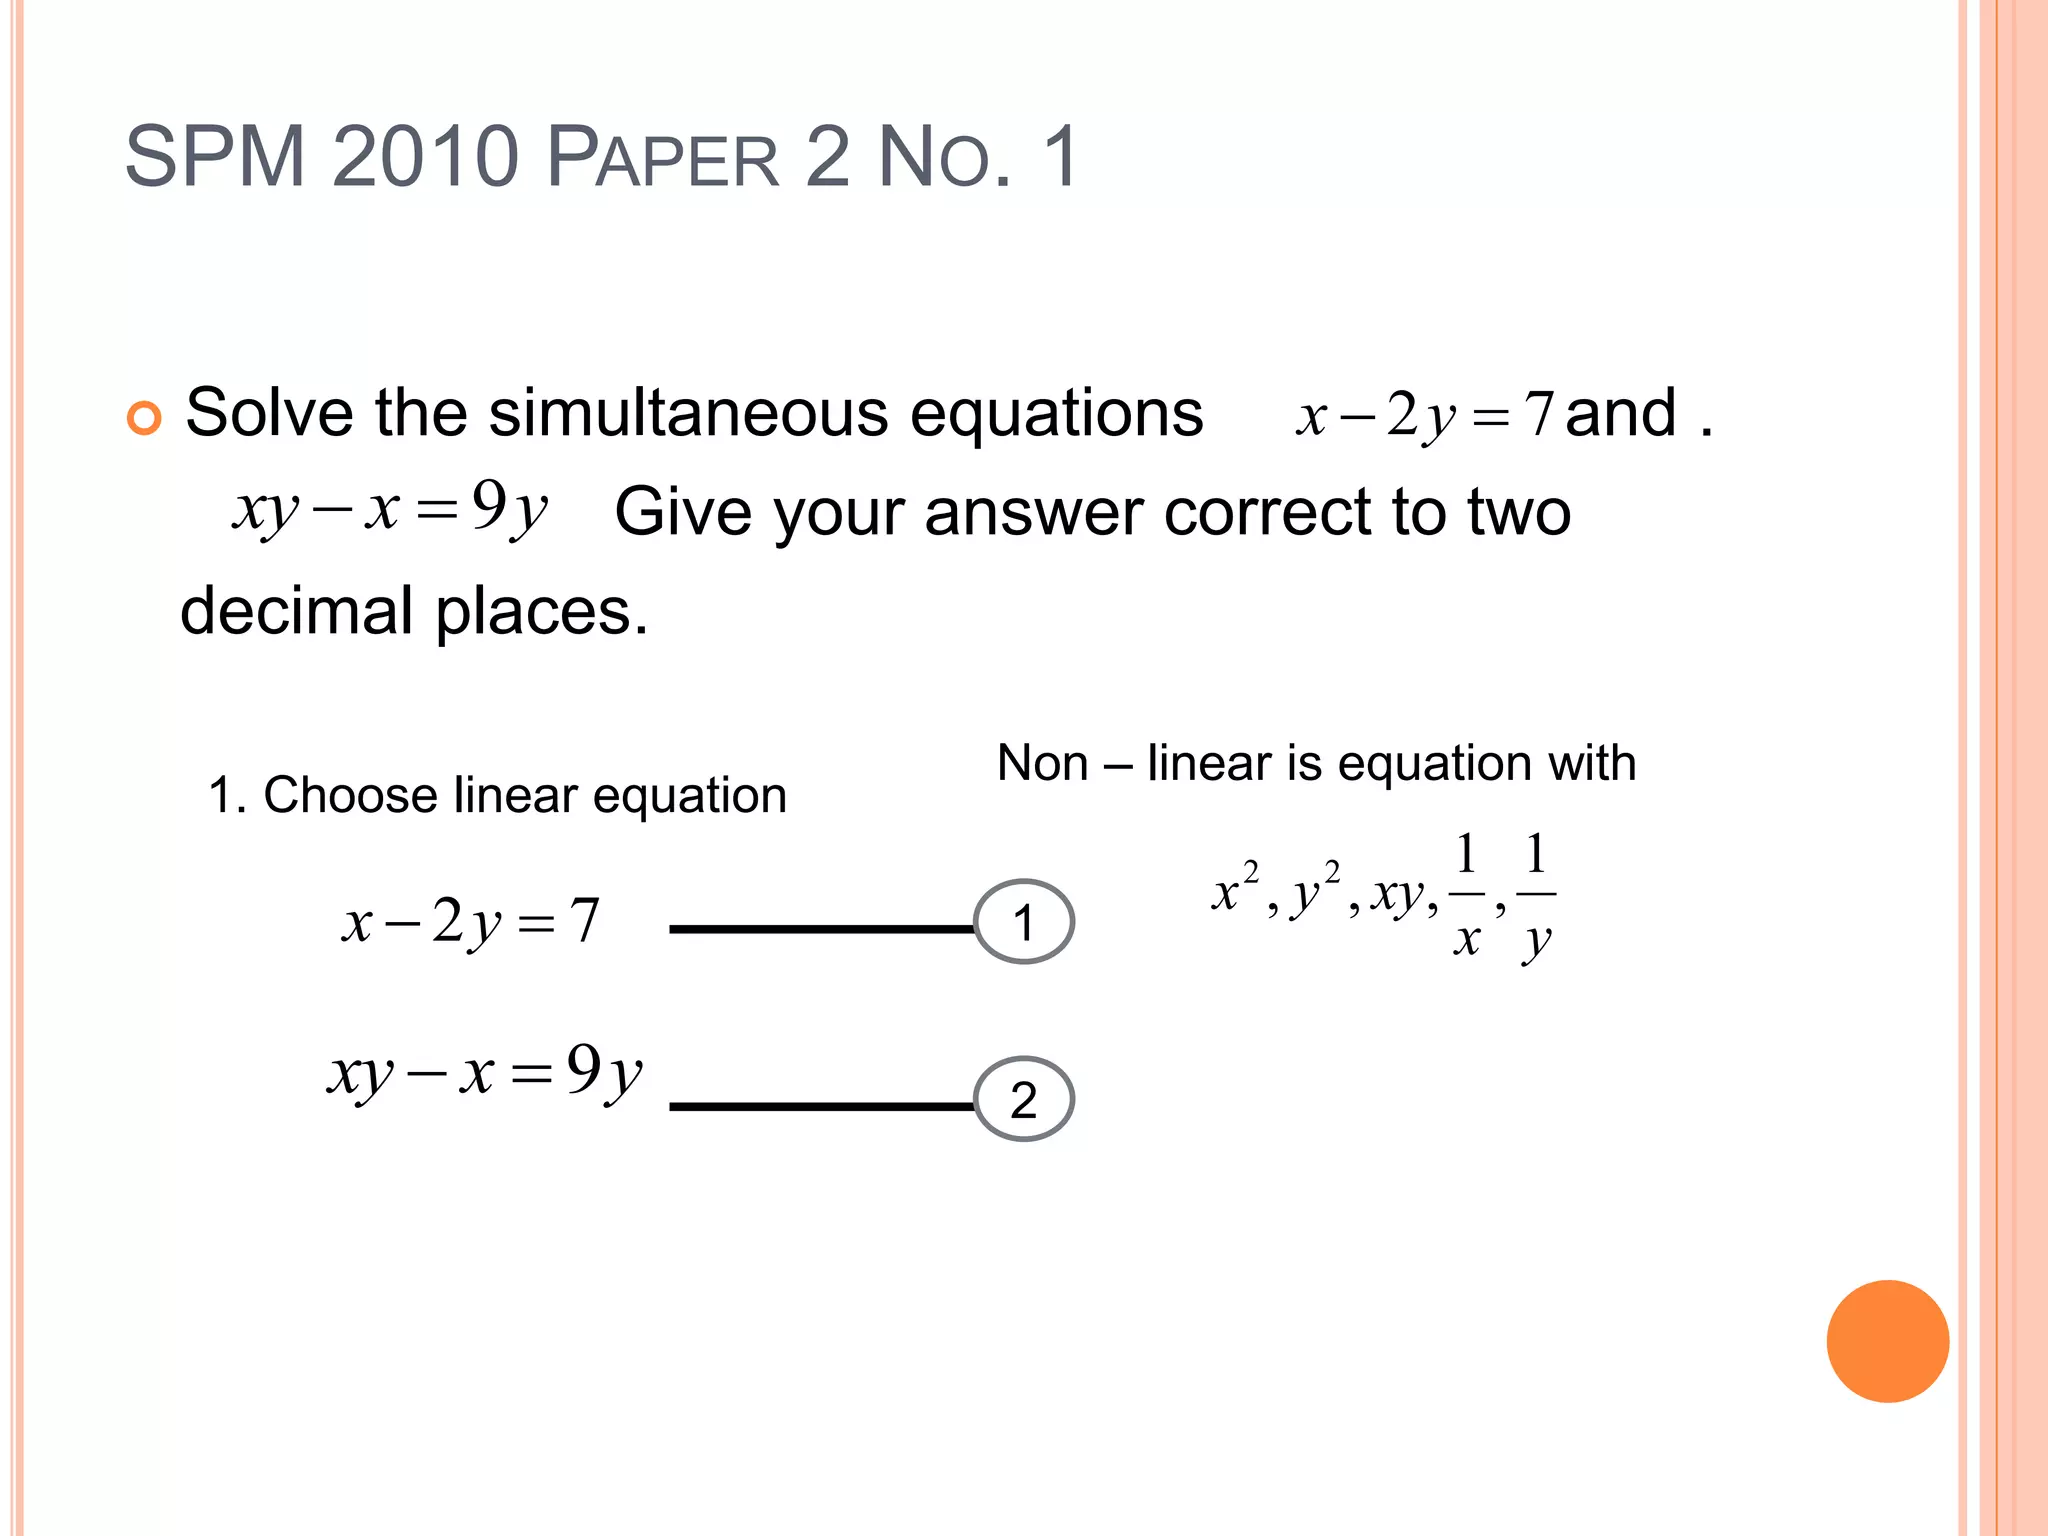
The document provides examples of how to solve simultaneous equations that appear on the SPM Mathematics paper 2 exam. It includes 4 examples from past years of the exam with the step-by-step workings shown. The key steps are to identify the linear equation, isolate one variable, substitute into the other equation to obtain a quadratic equation, then solve the quadratic equation to find the solutions to the simultaneous equations. Additional examples are provided for sketching graphs to determine the number of solutions to related equations. The document aims to help students with the techniques required to answer simultaneous equation and graph sketching questions on the SPM Mathematics paper 2 exam.
Introduction to mathematics answering techniques presented by Aidil-Nur Bin Zainal.
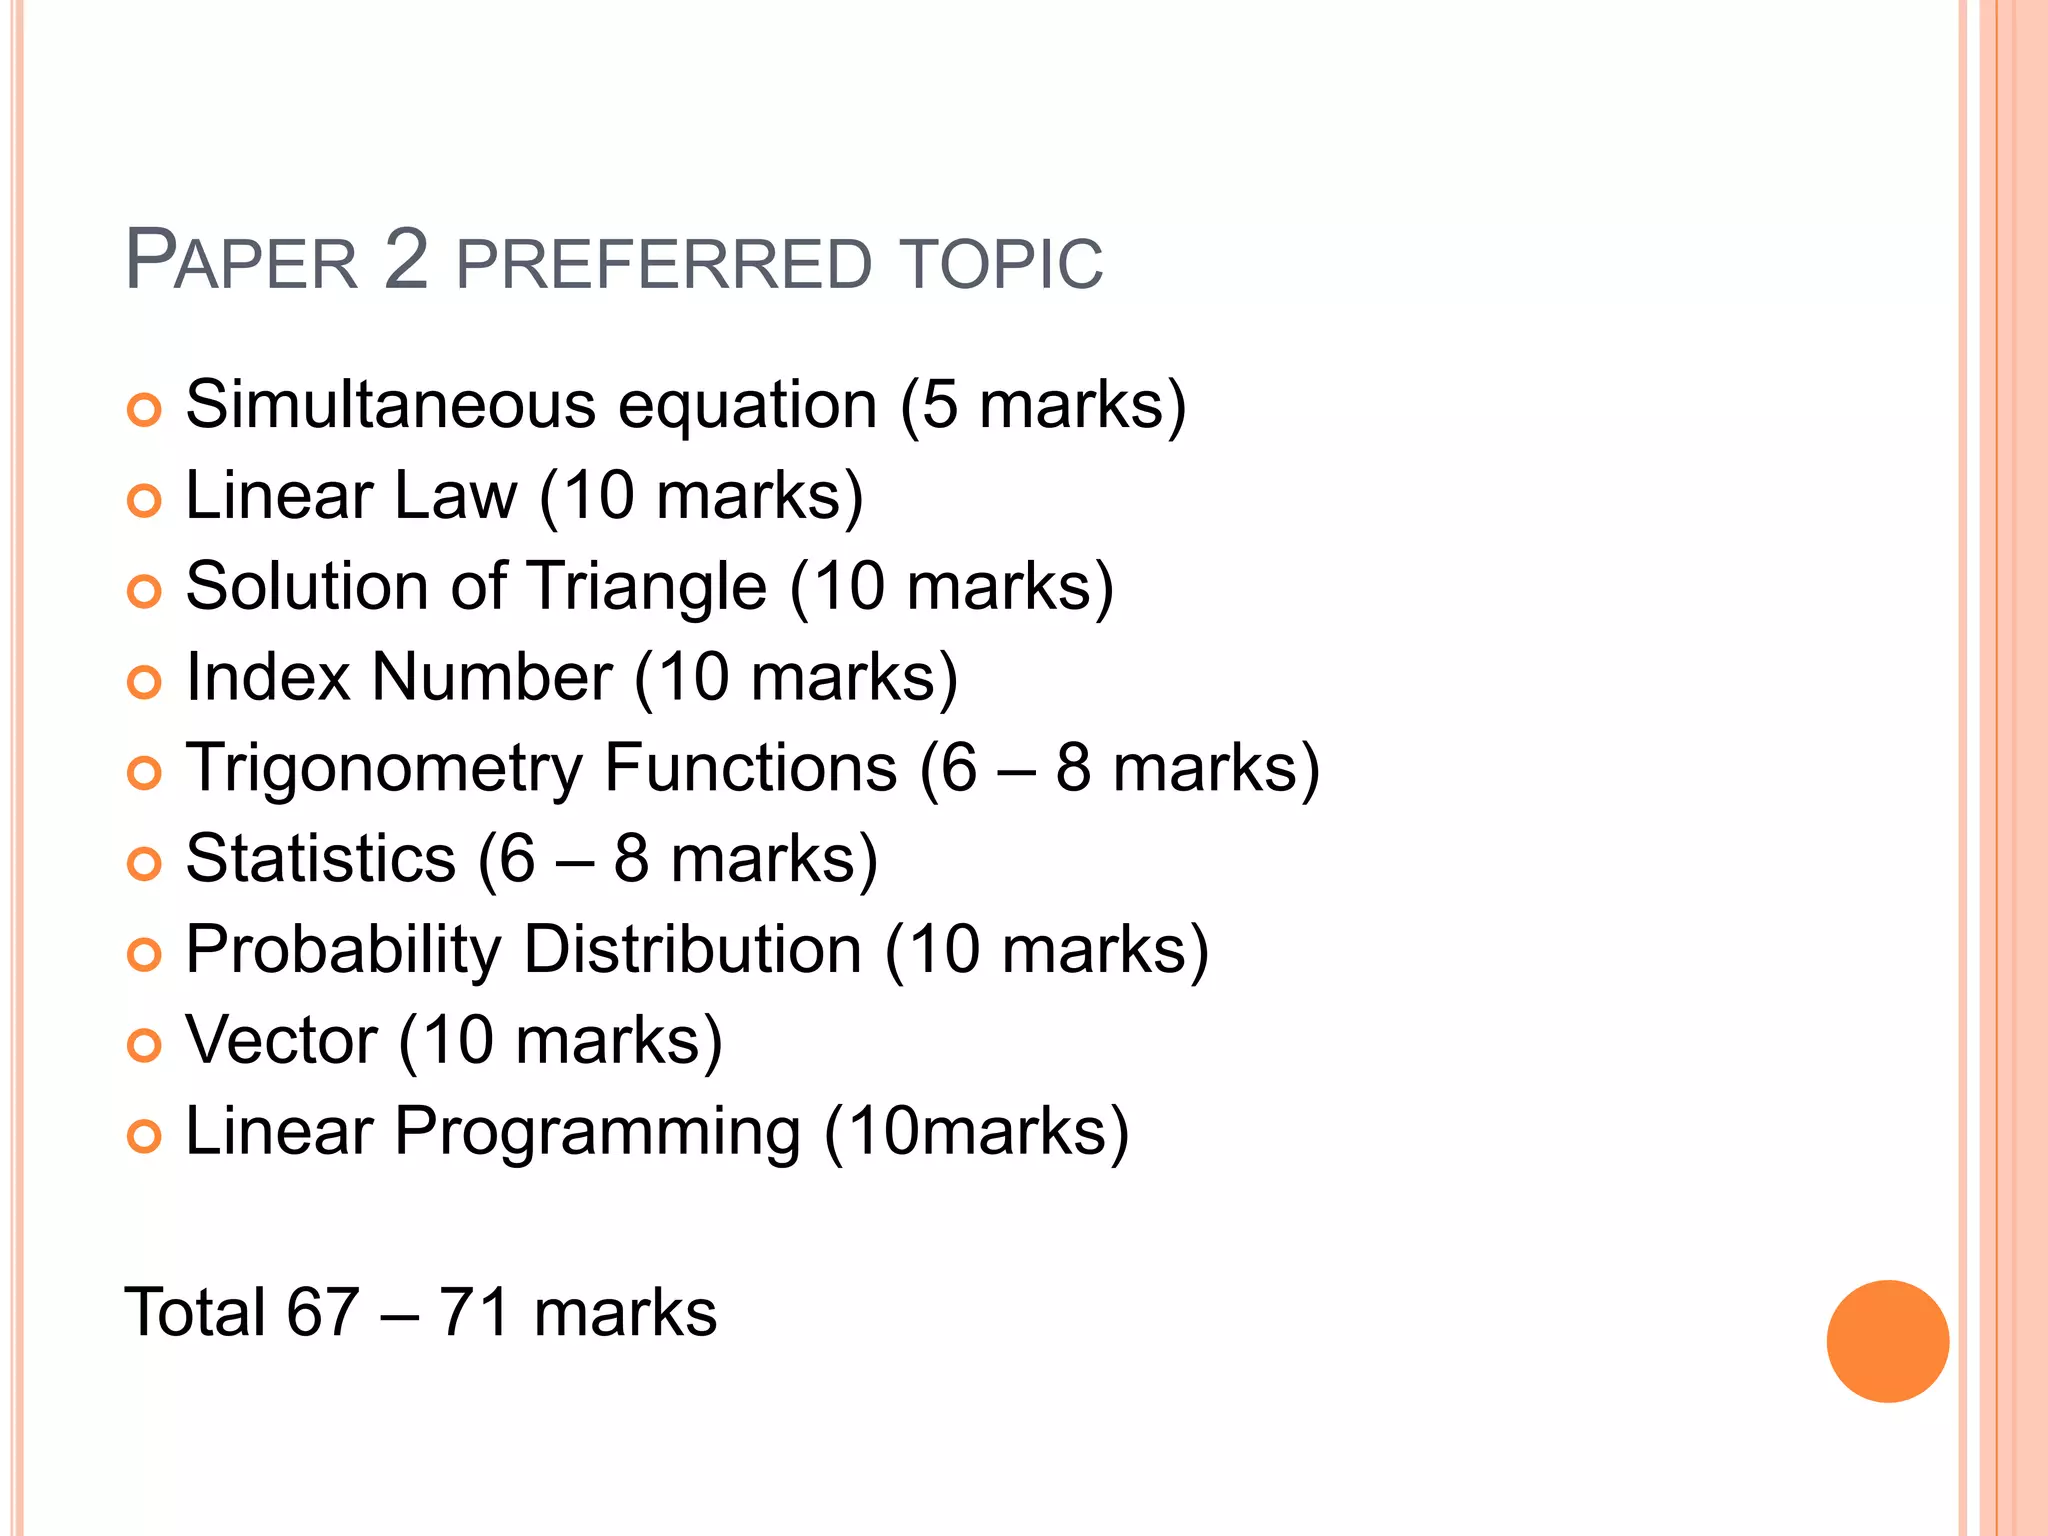
Overview of Paper 2 topics including simultaneous equations, linear laws, trigonometry, etc. Total marks range: 67-71.
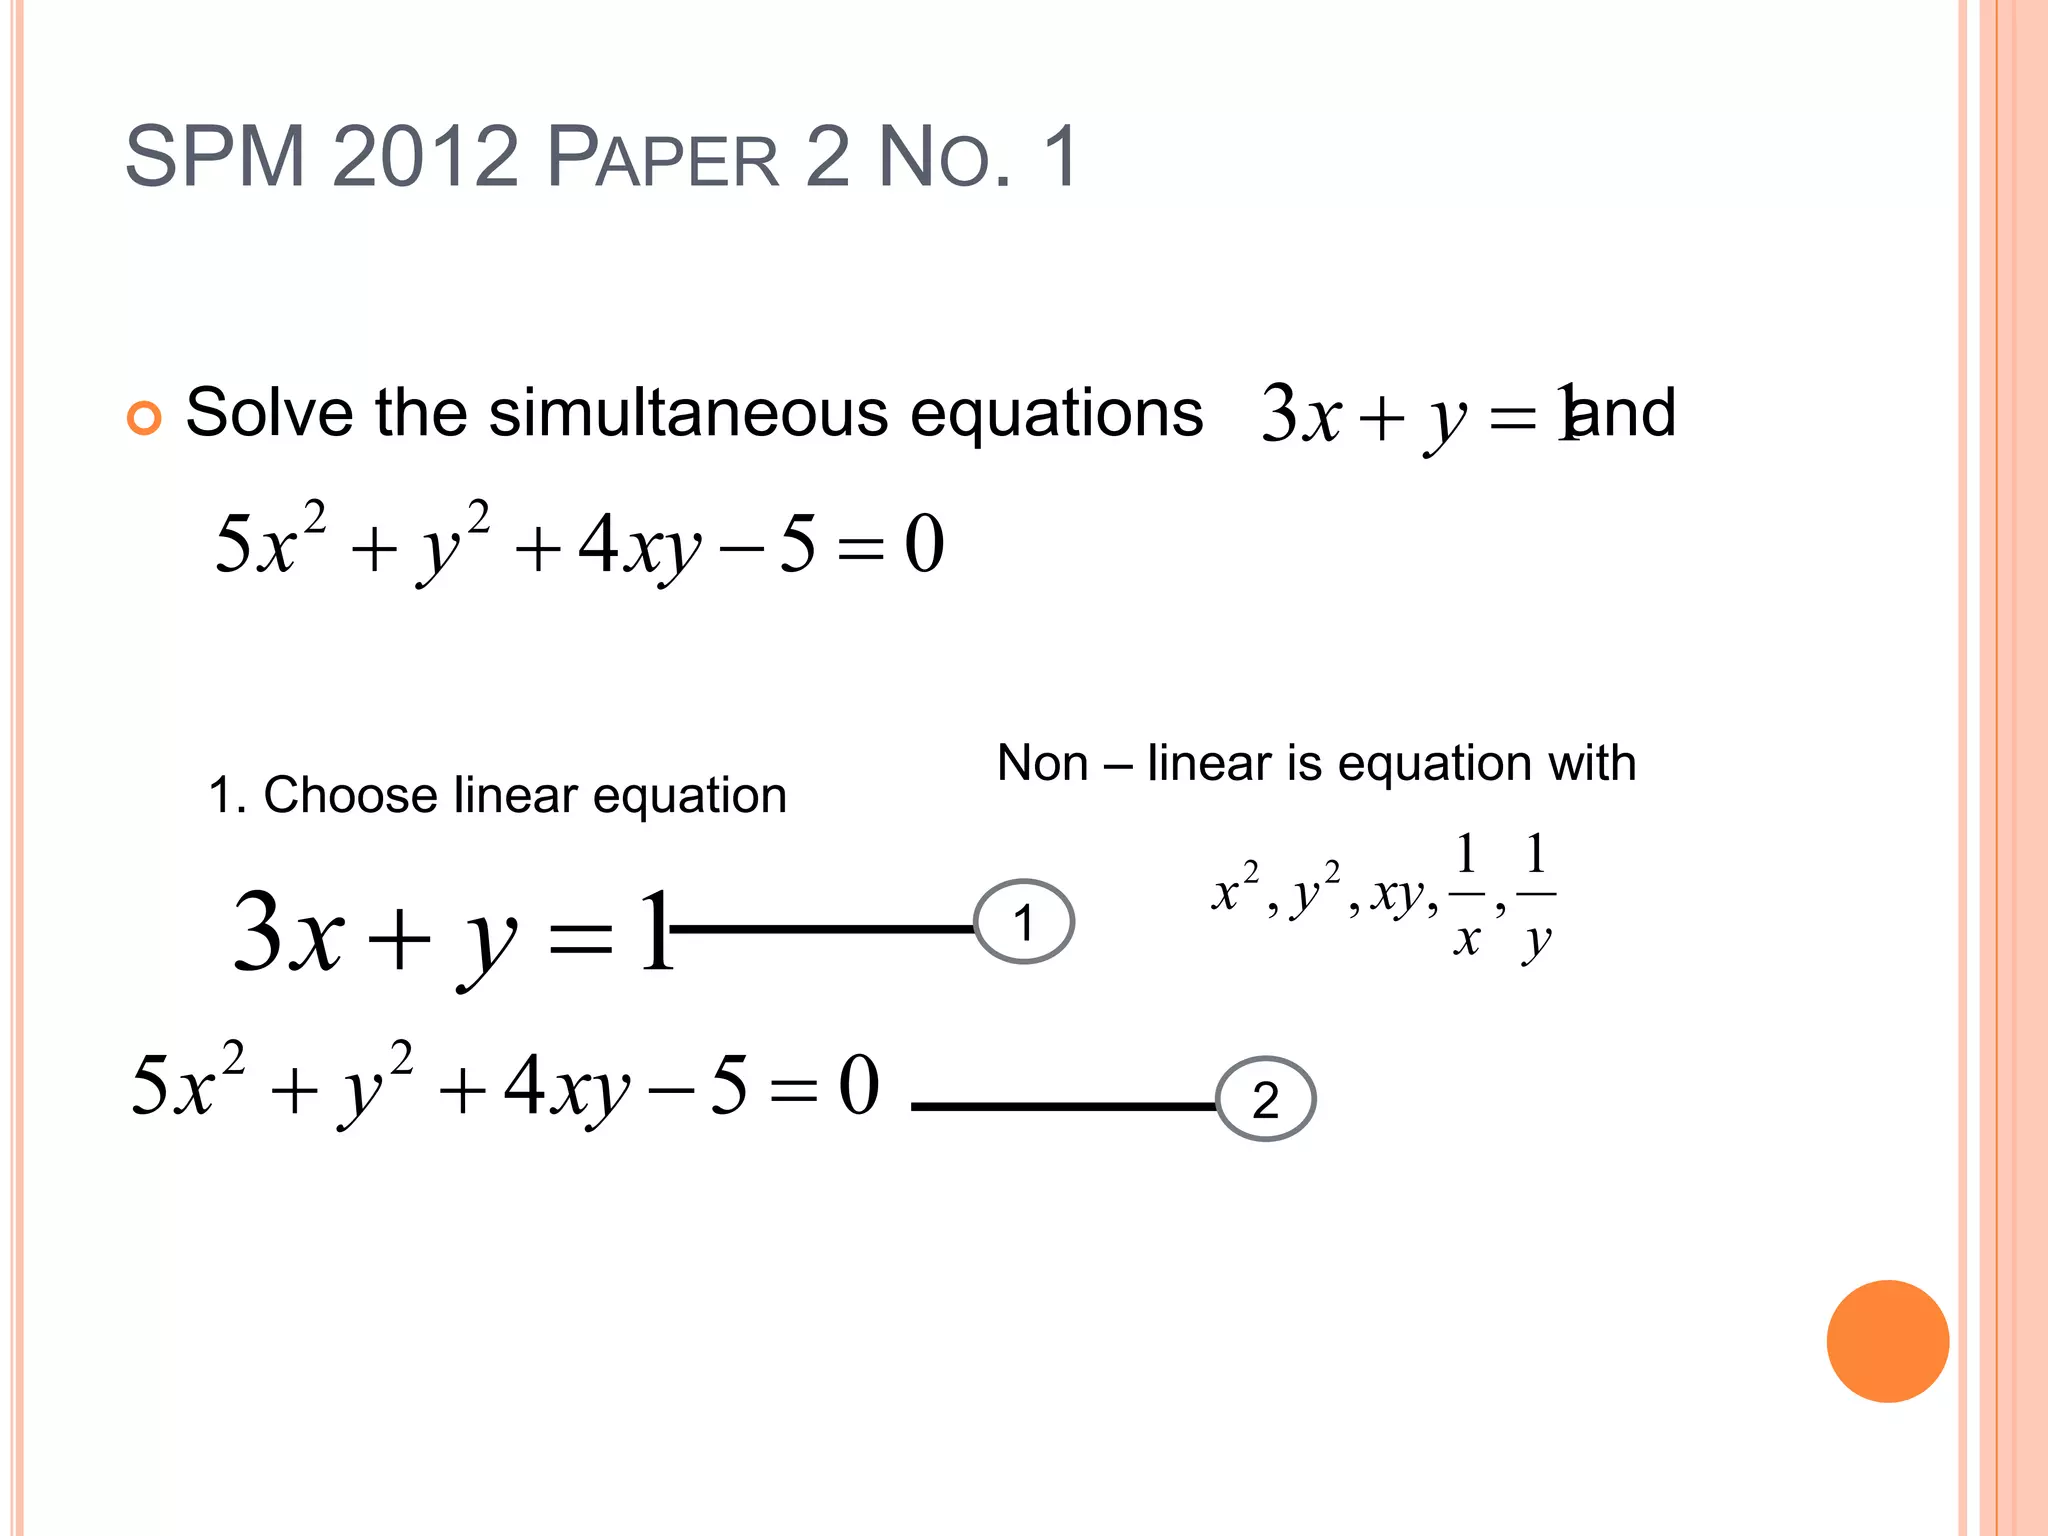
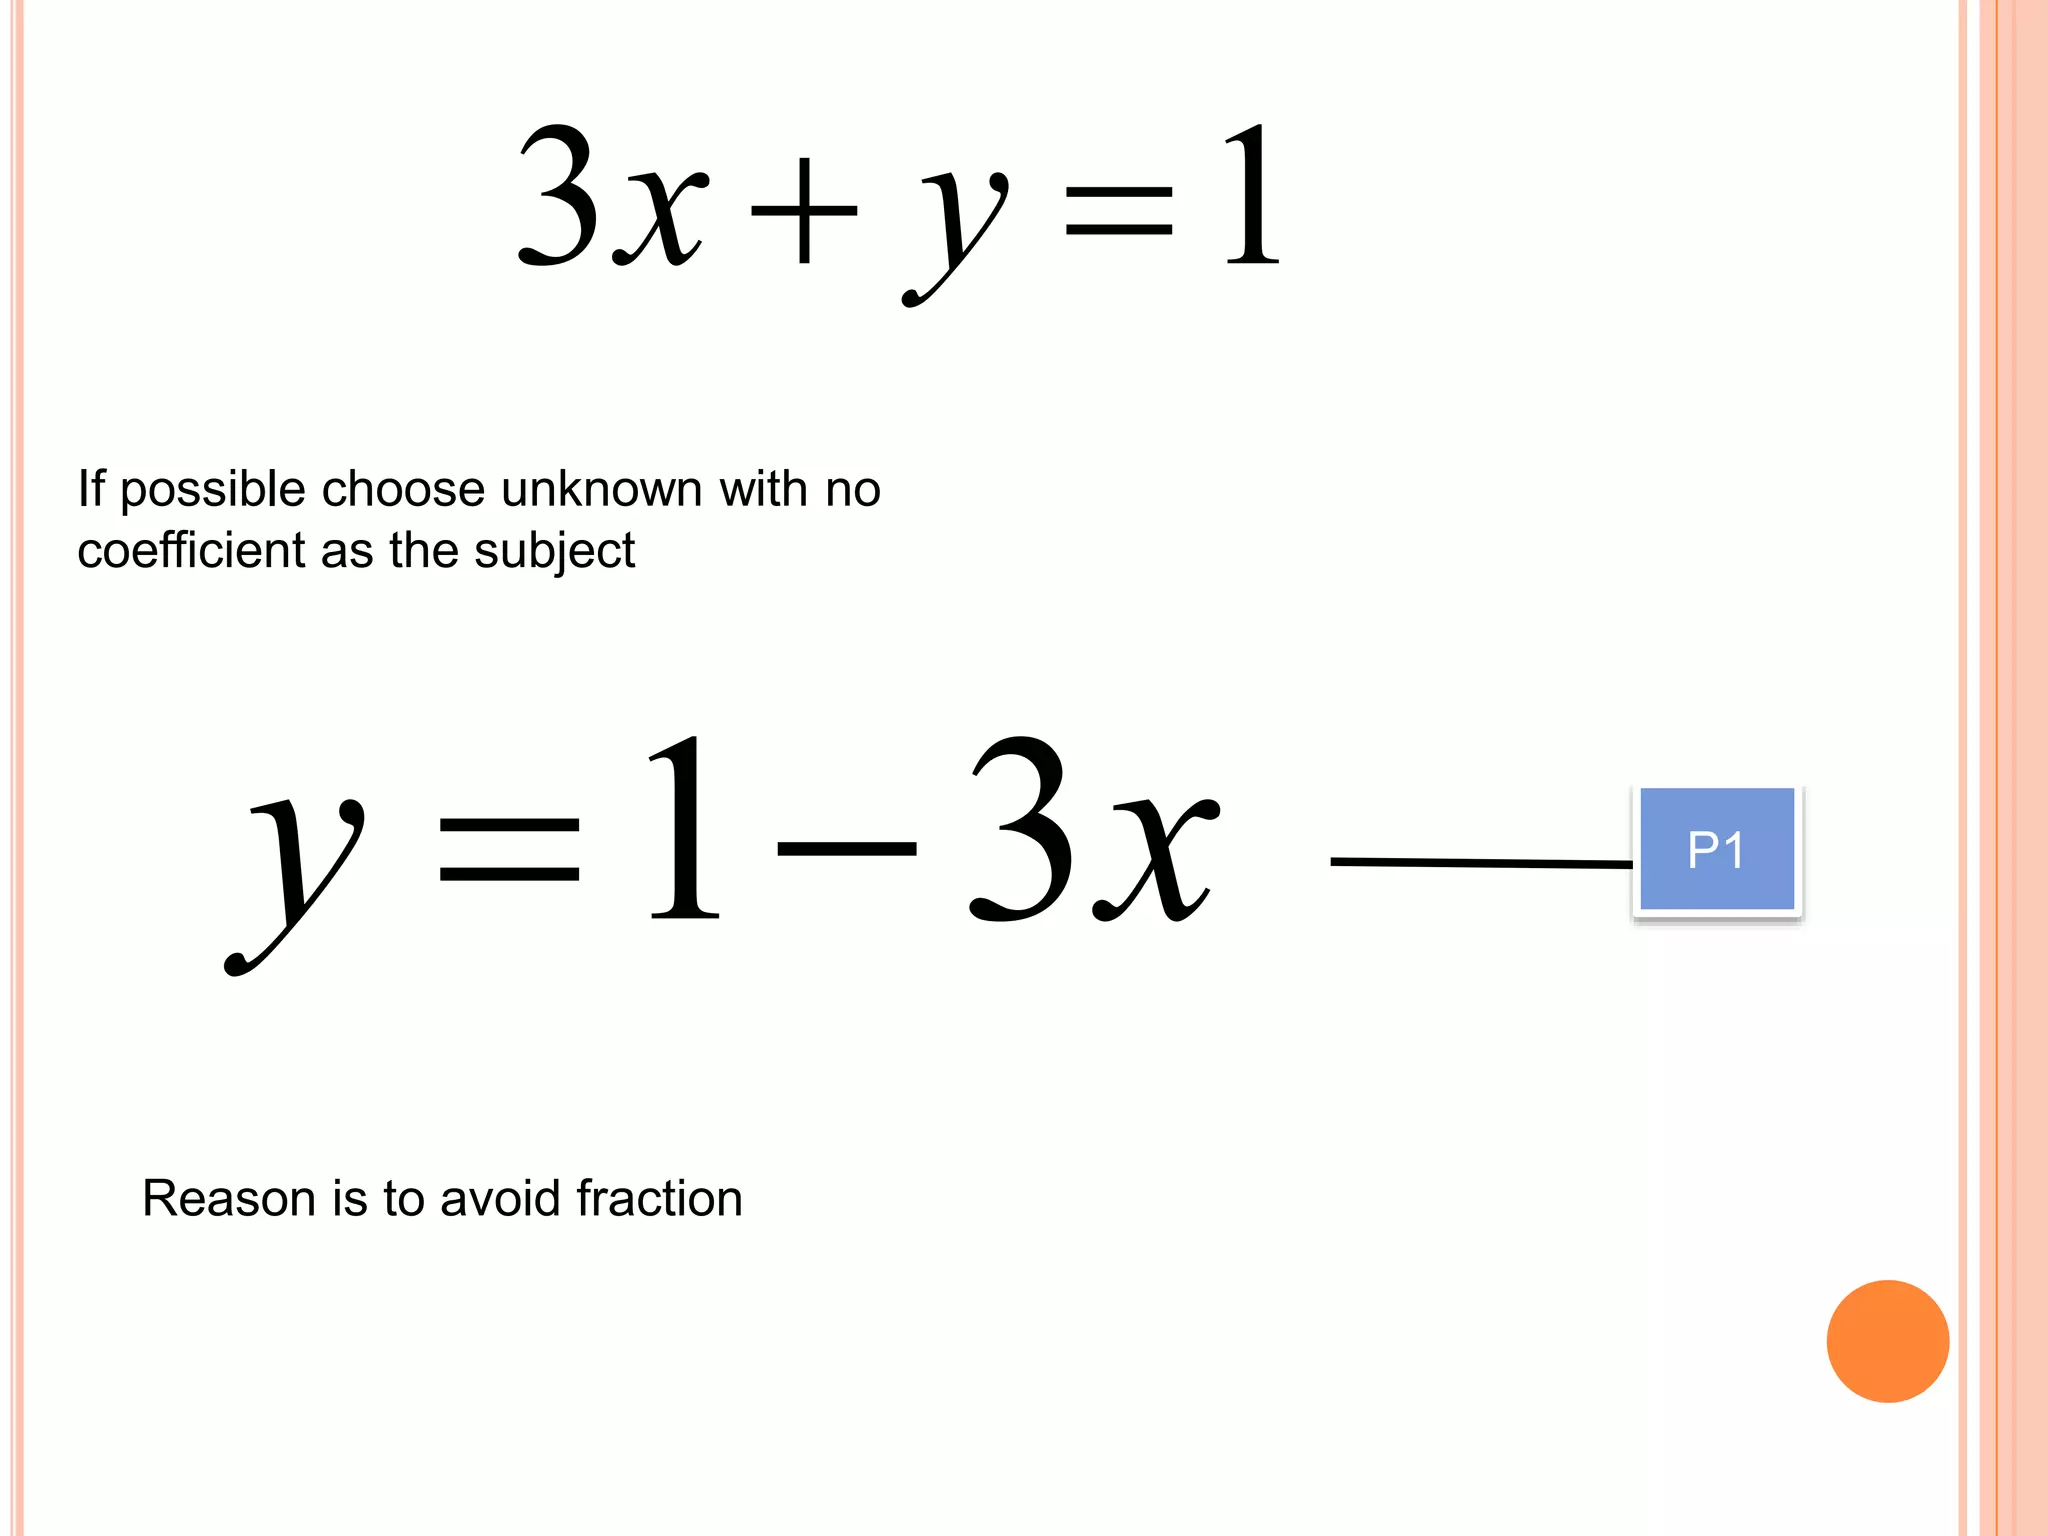
Worked example on solving simultaneous equations from SPM 2012, emphasizing linear versus non-linear equations, substitution, and solving for unknowns.
Another example from SPM 2011 focusing on similar techniques for solving simultaneous equations, including correctness to decimal places.
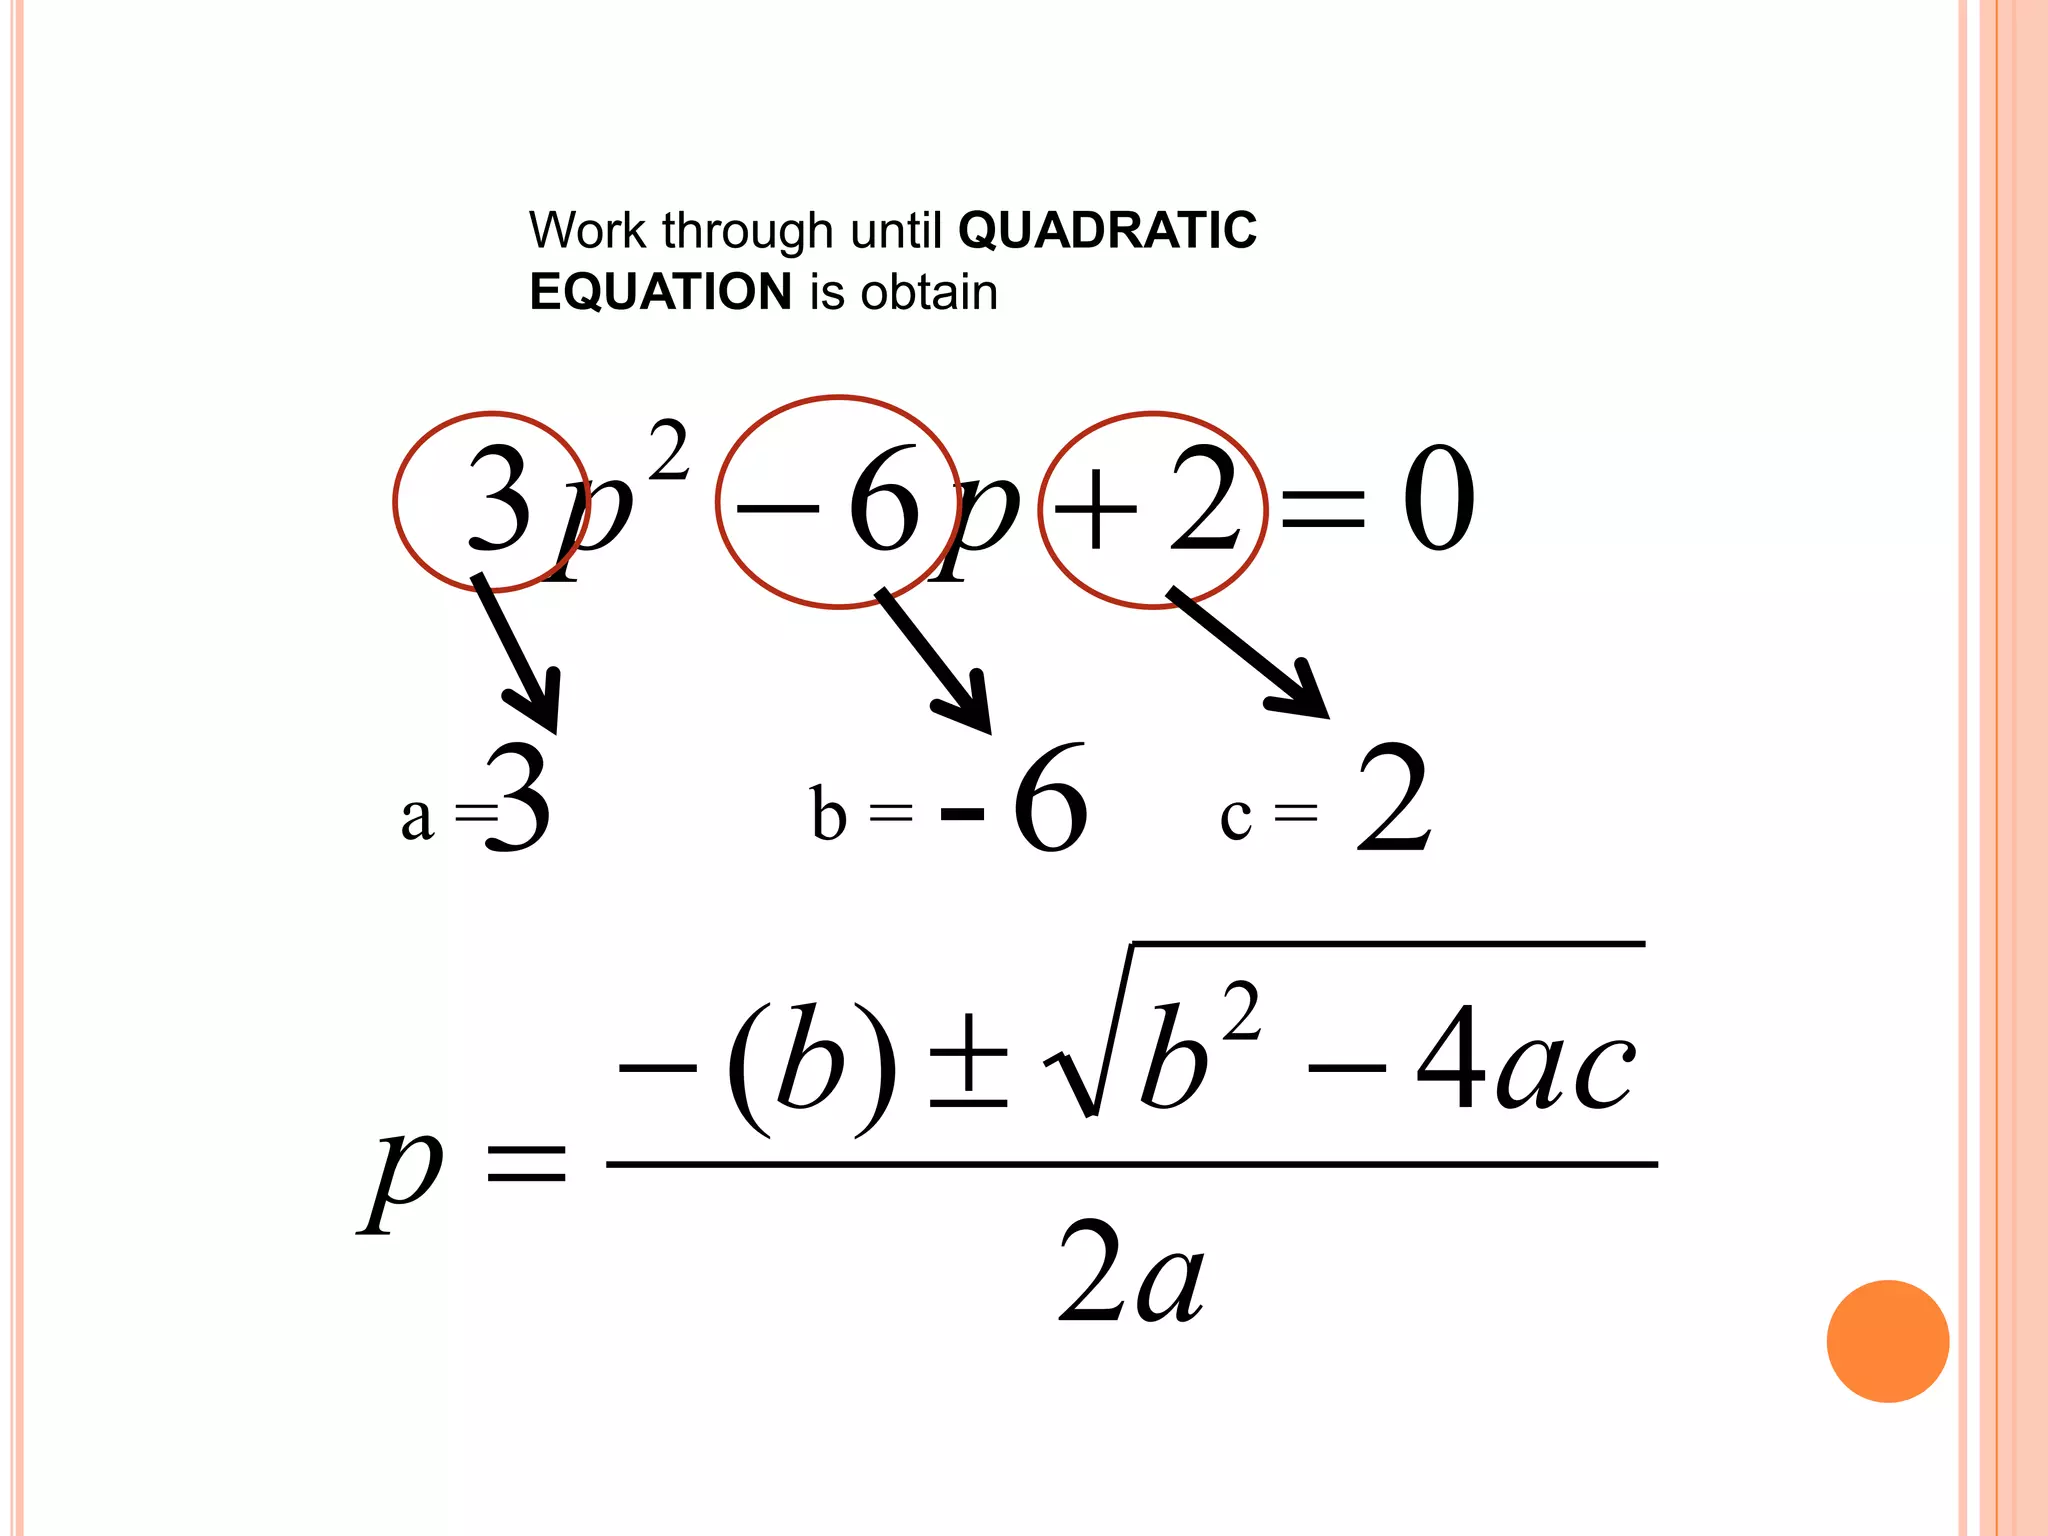
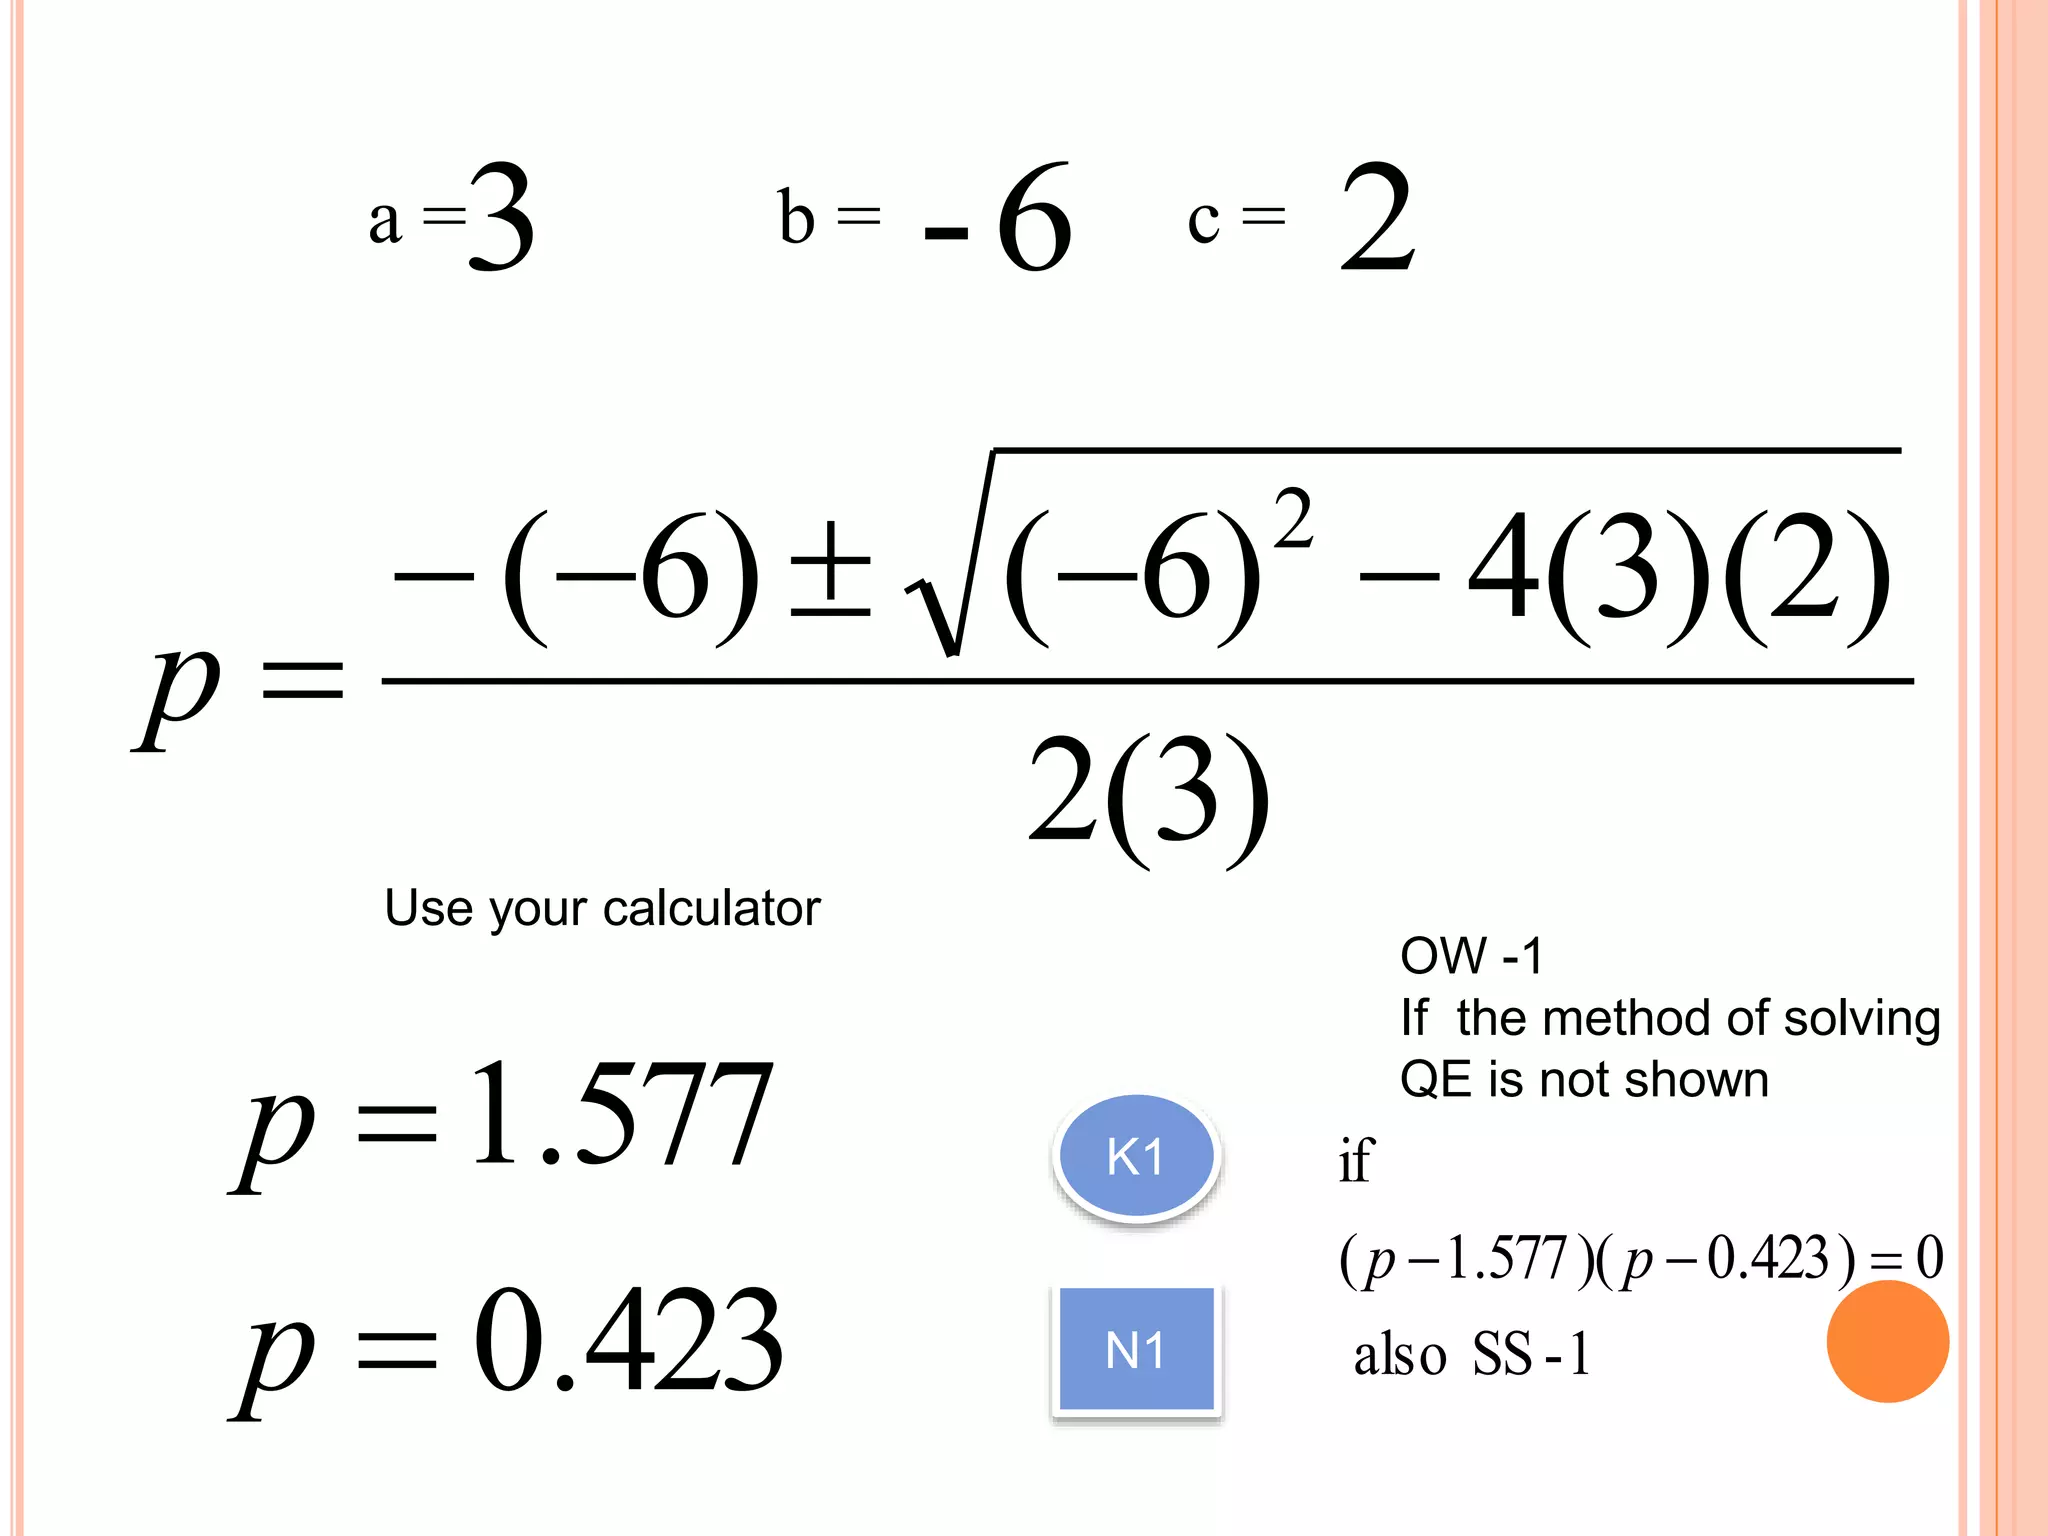
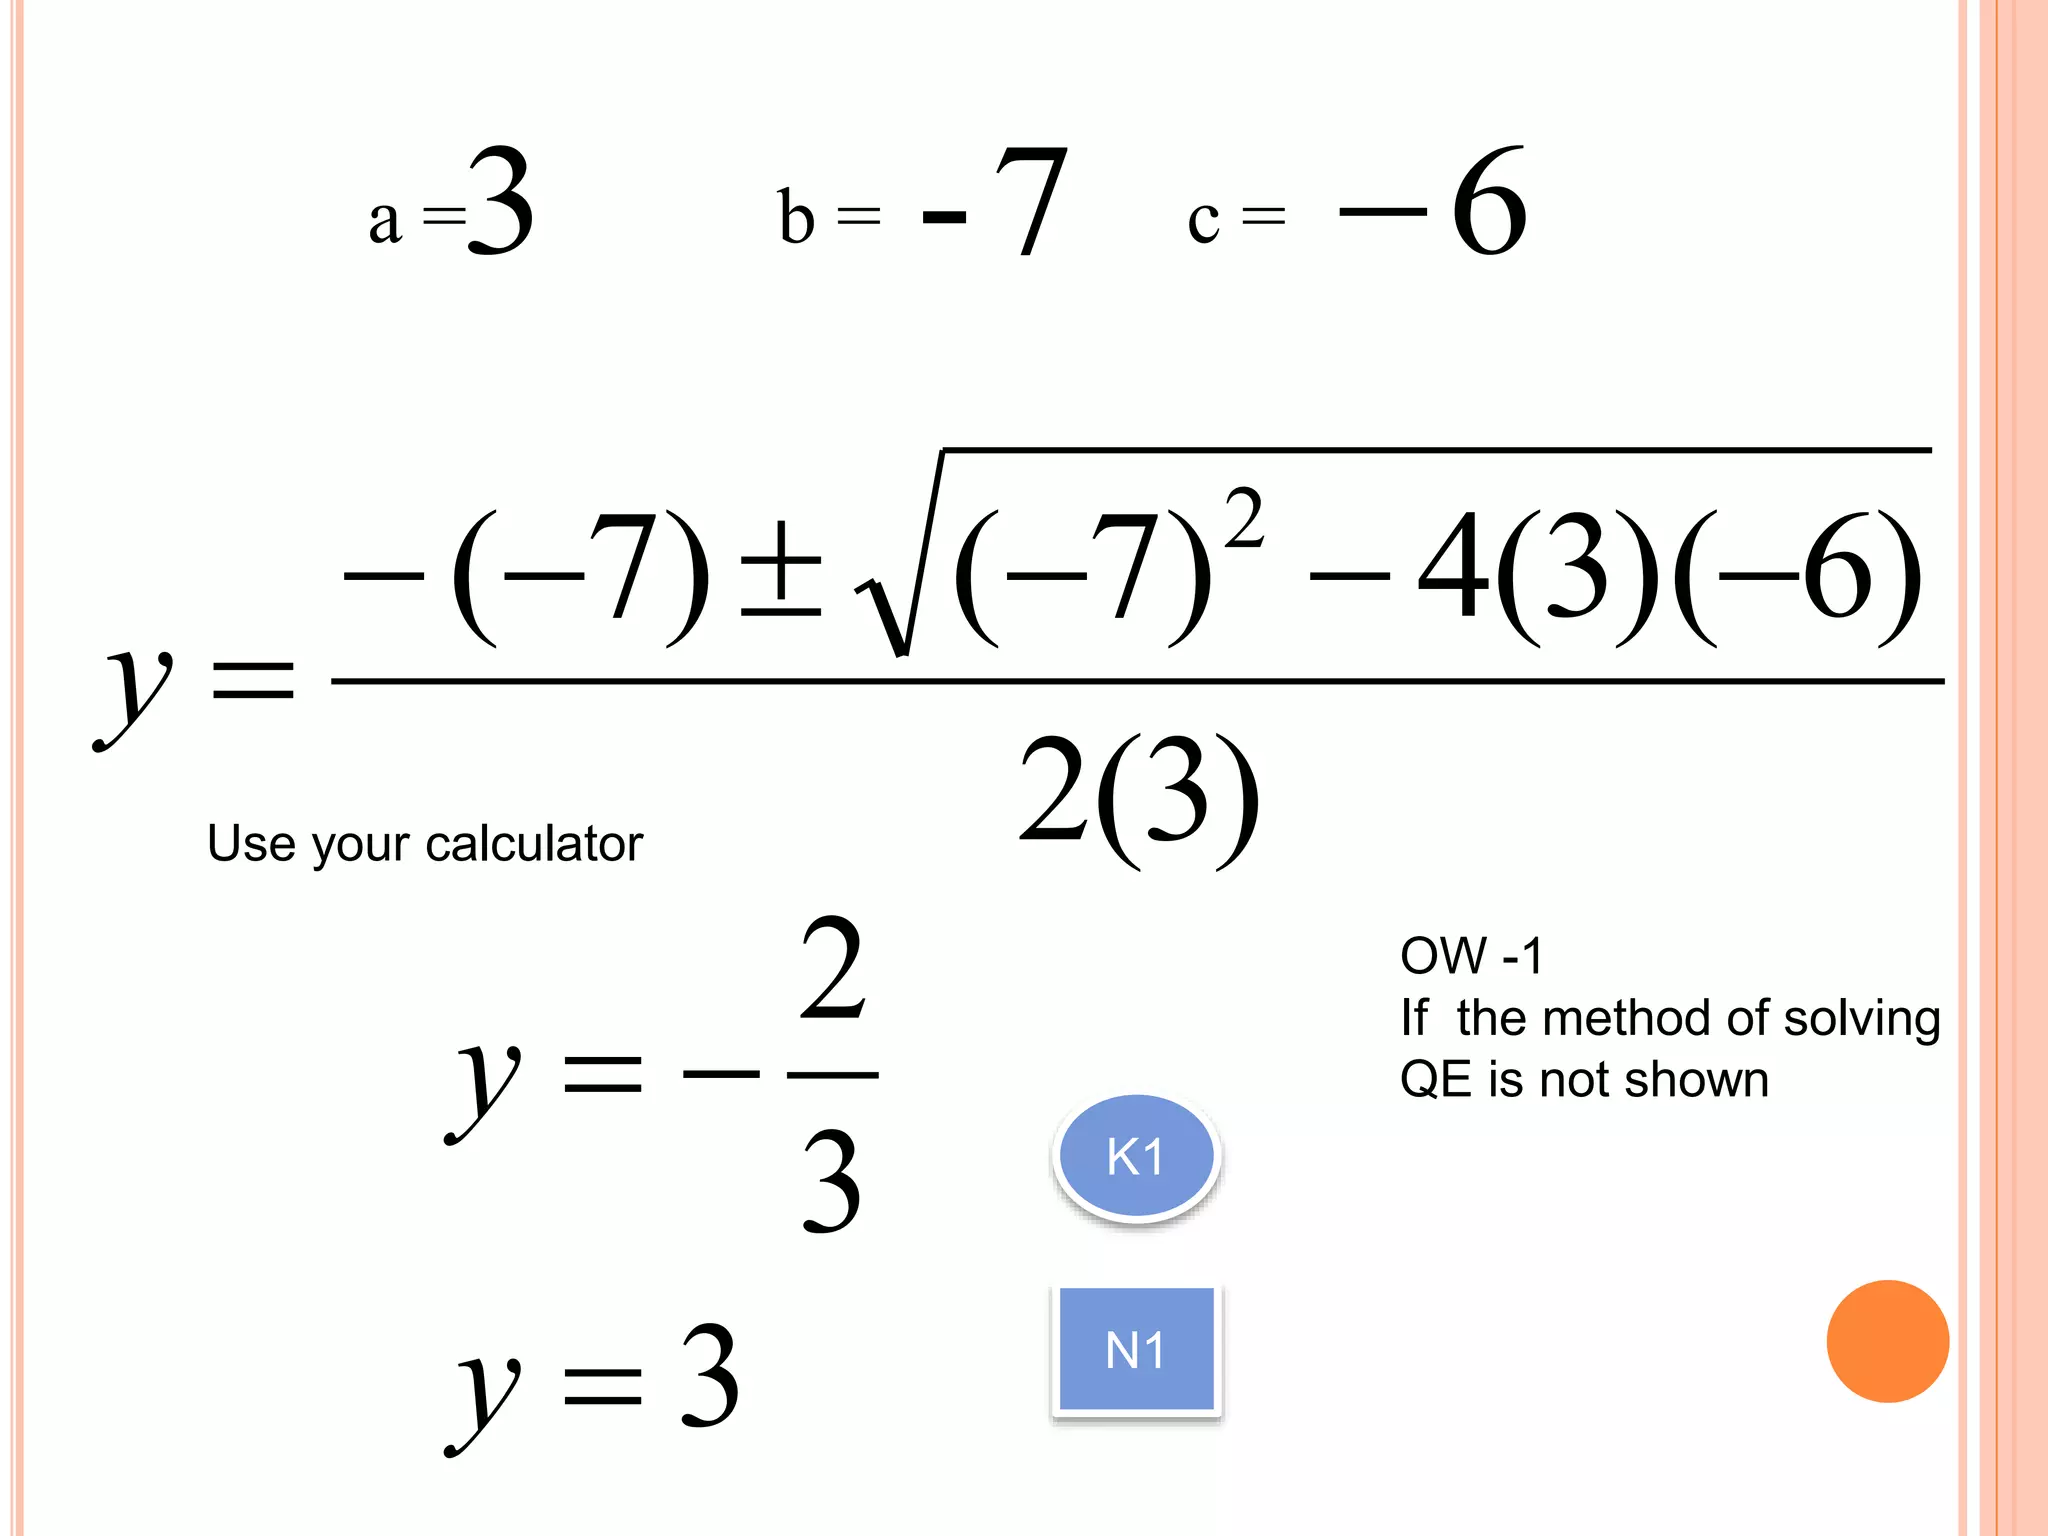
Detailed solving of simultaneous equations from SPM 2010, including substitution and arriving at quadratic equations.
SPM 2009 example, reinforcing the methods of solving simultaneous equations with connections to quadratic equations.
Another SPM 2008 example on solving simultaneous equations with detailed substitutions and methods, culminating in quadratic results.
SPM 2007 example with focus on similar solving techniques and handling quadratic equations.
Proving equations and graphing trigonometric functions from SPM 2012, discussing solutions based on intersections of graphs.
Continuation of trigonometric graph analysis showing solutions and approximating intersections.
Further exploration of trigonometric functions in graphing contexts and finding solutions to related equations.
SPM 2012 statistical problem focusing on standard deviation and adjustments for monthly income changes.
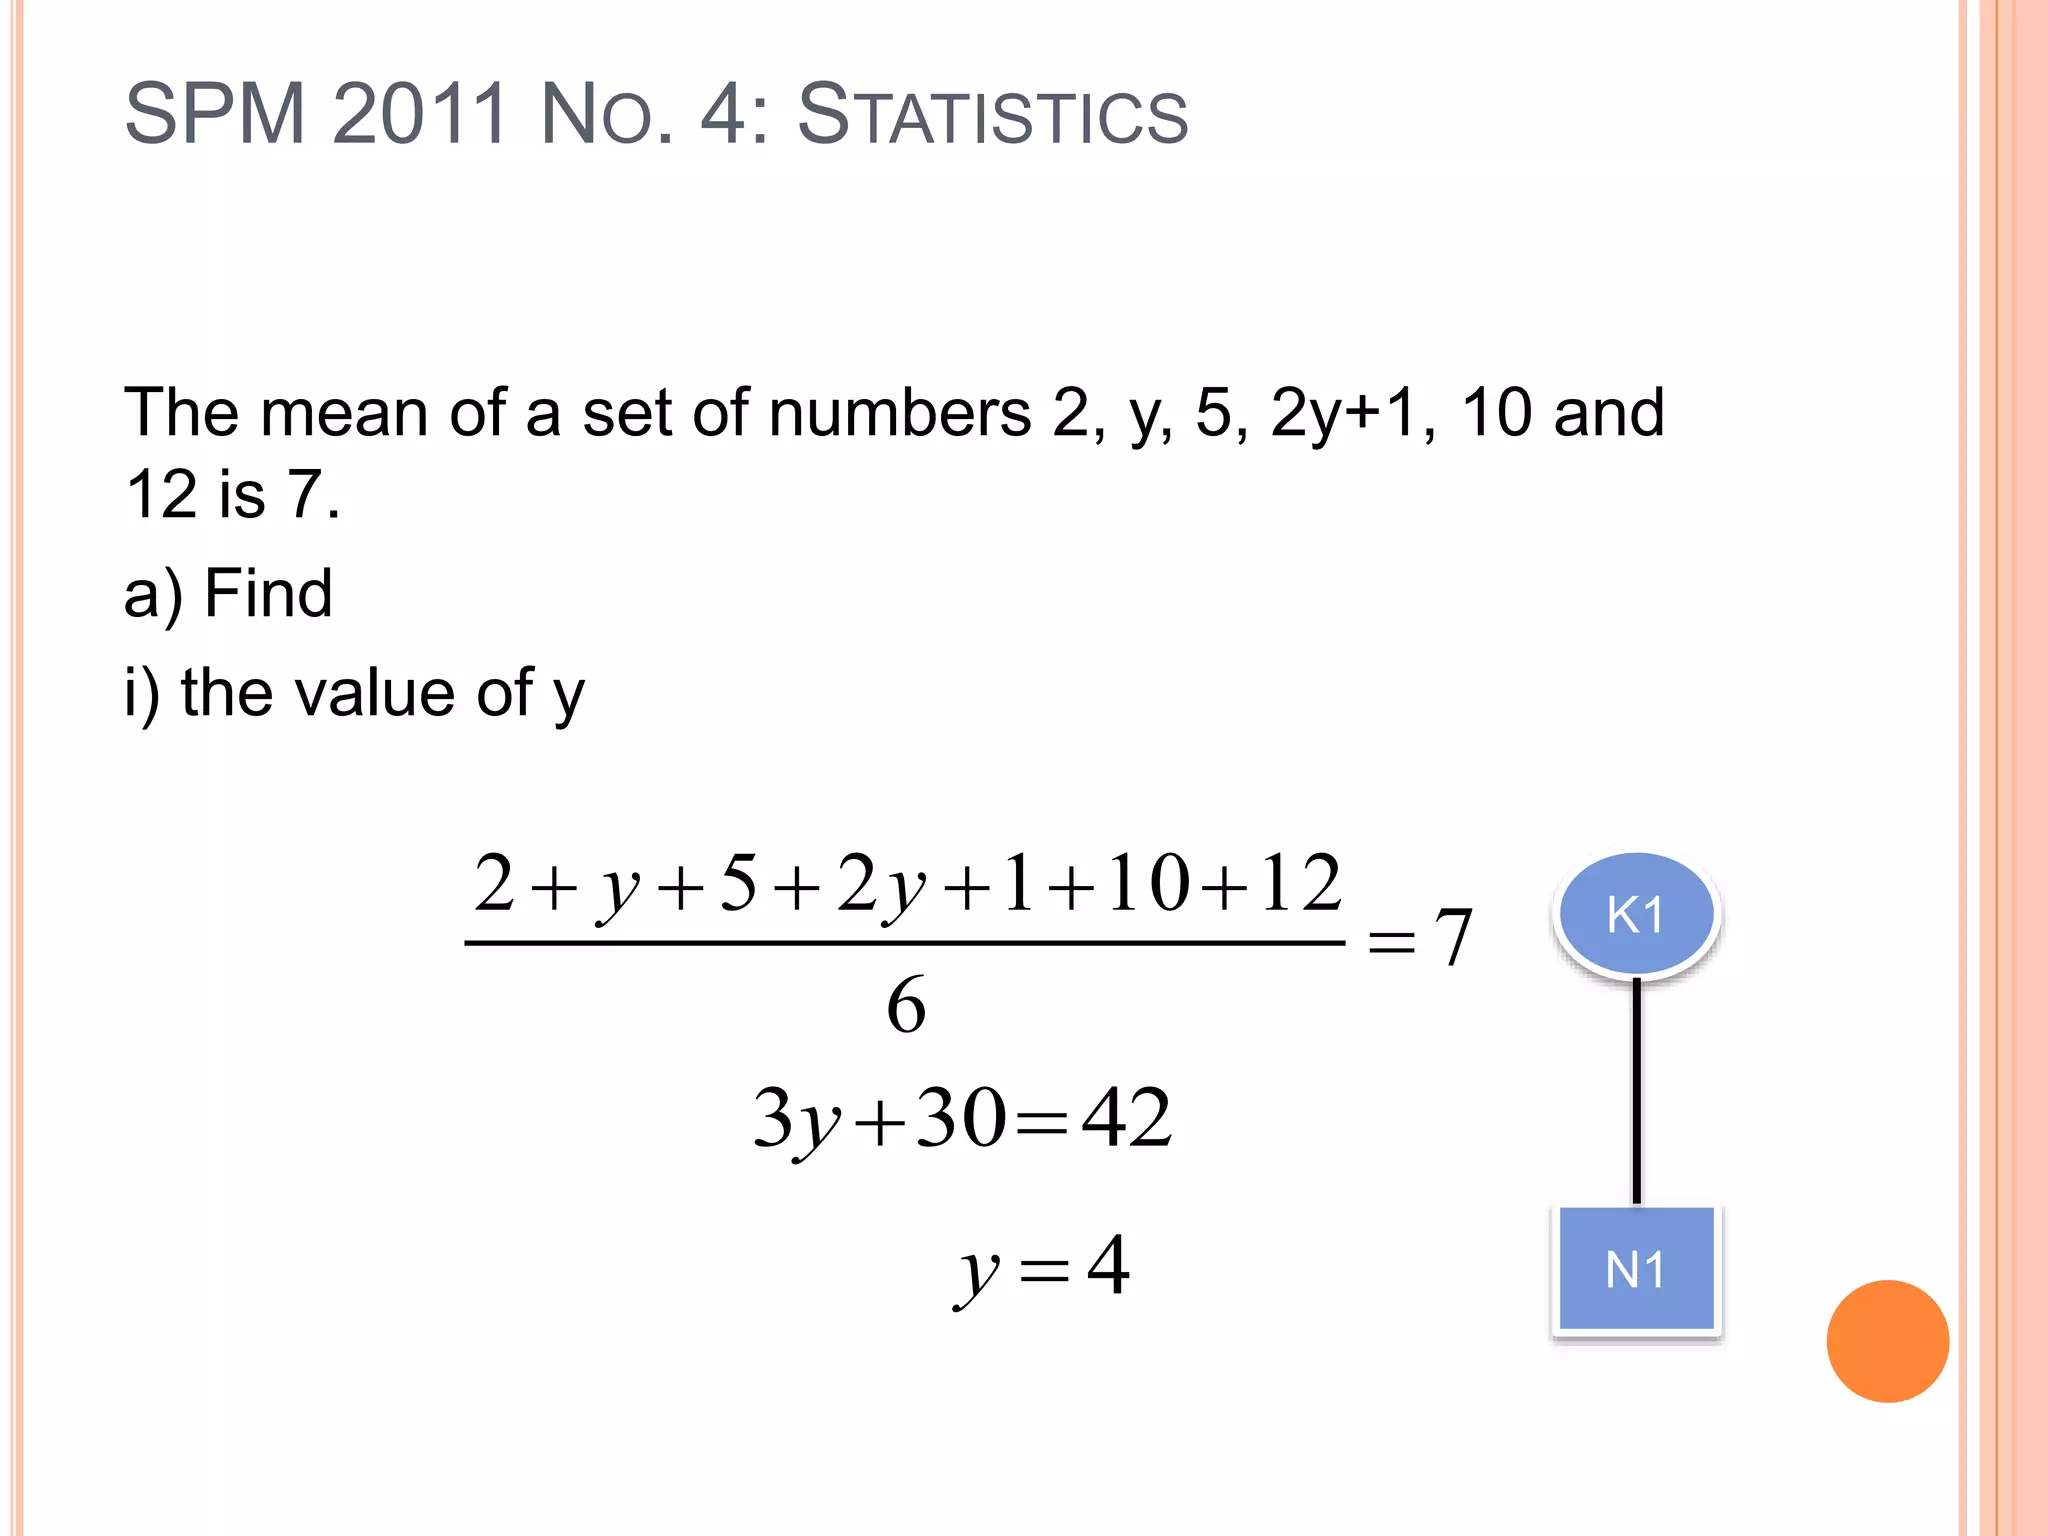
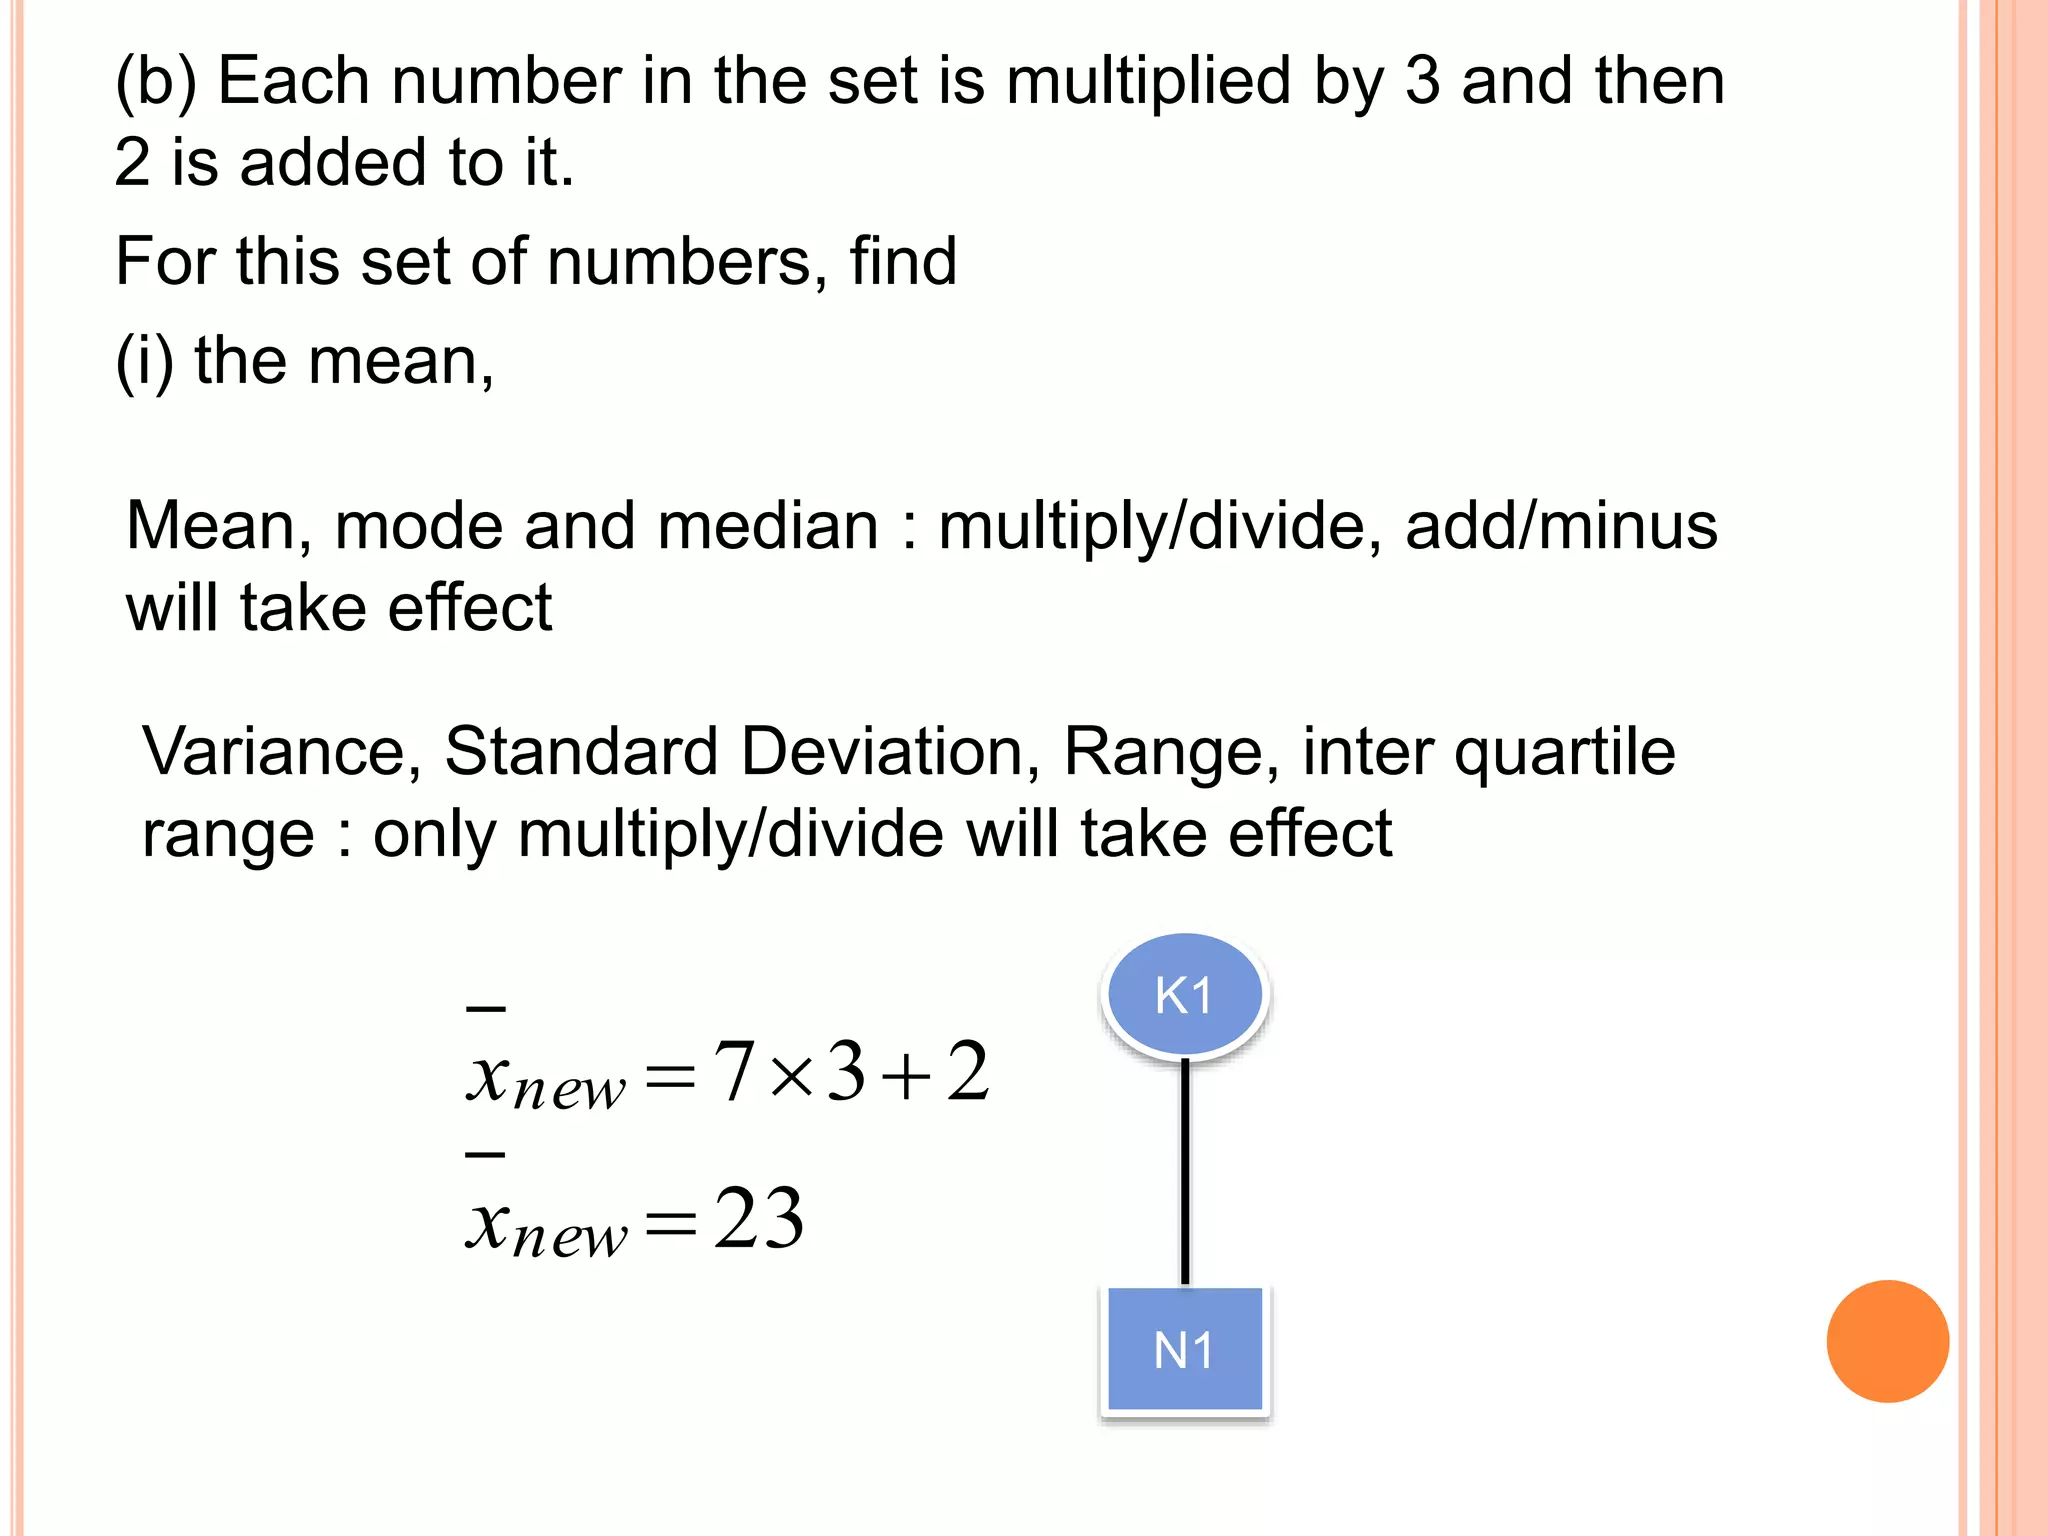
SPM 2011 statistical problem involving mean and variance calculations of a set that include transformations.
Focus on frequency distributions, histograms, and standard deviation calculations for a group of students' marks.
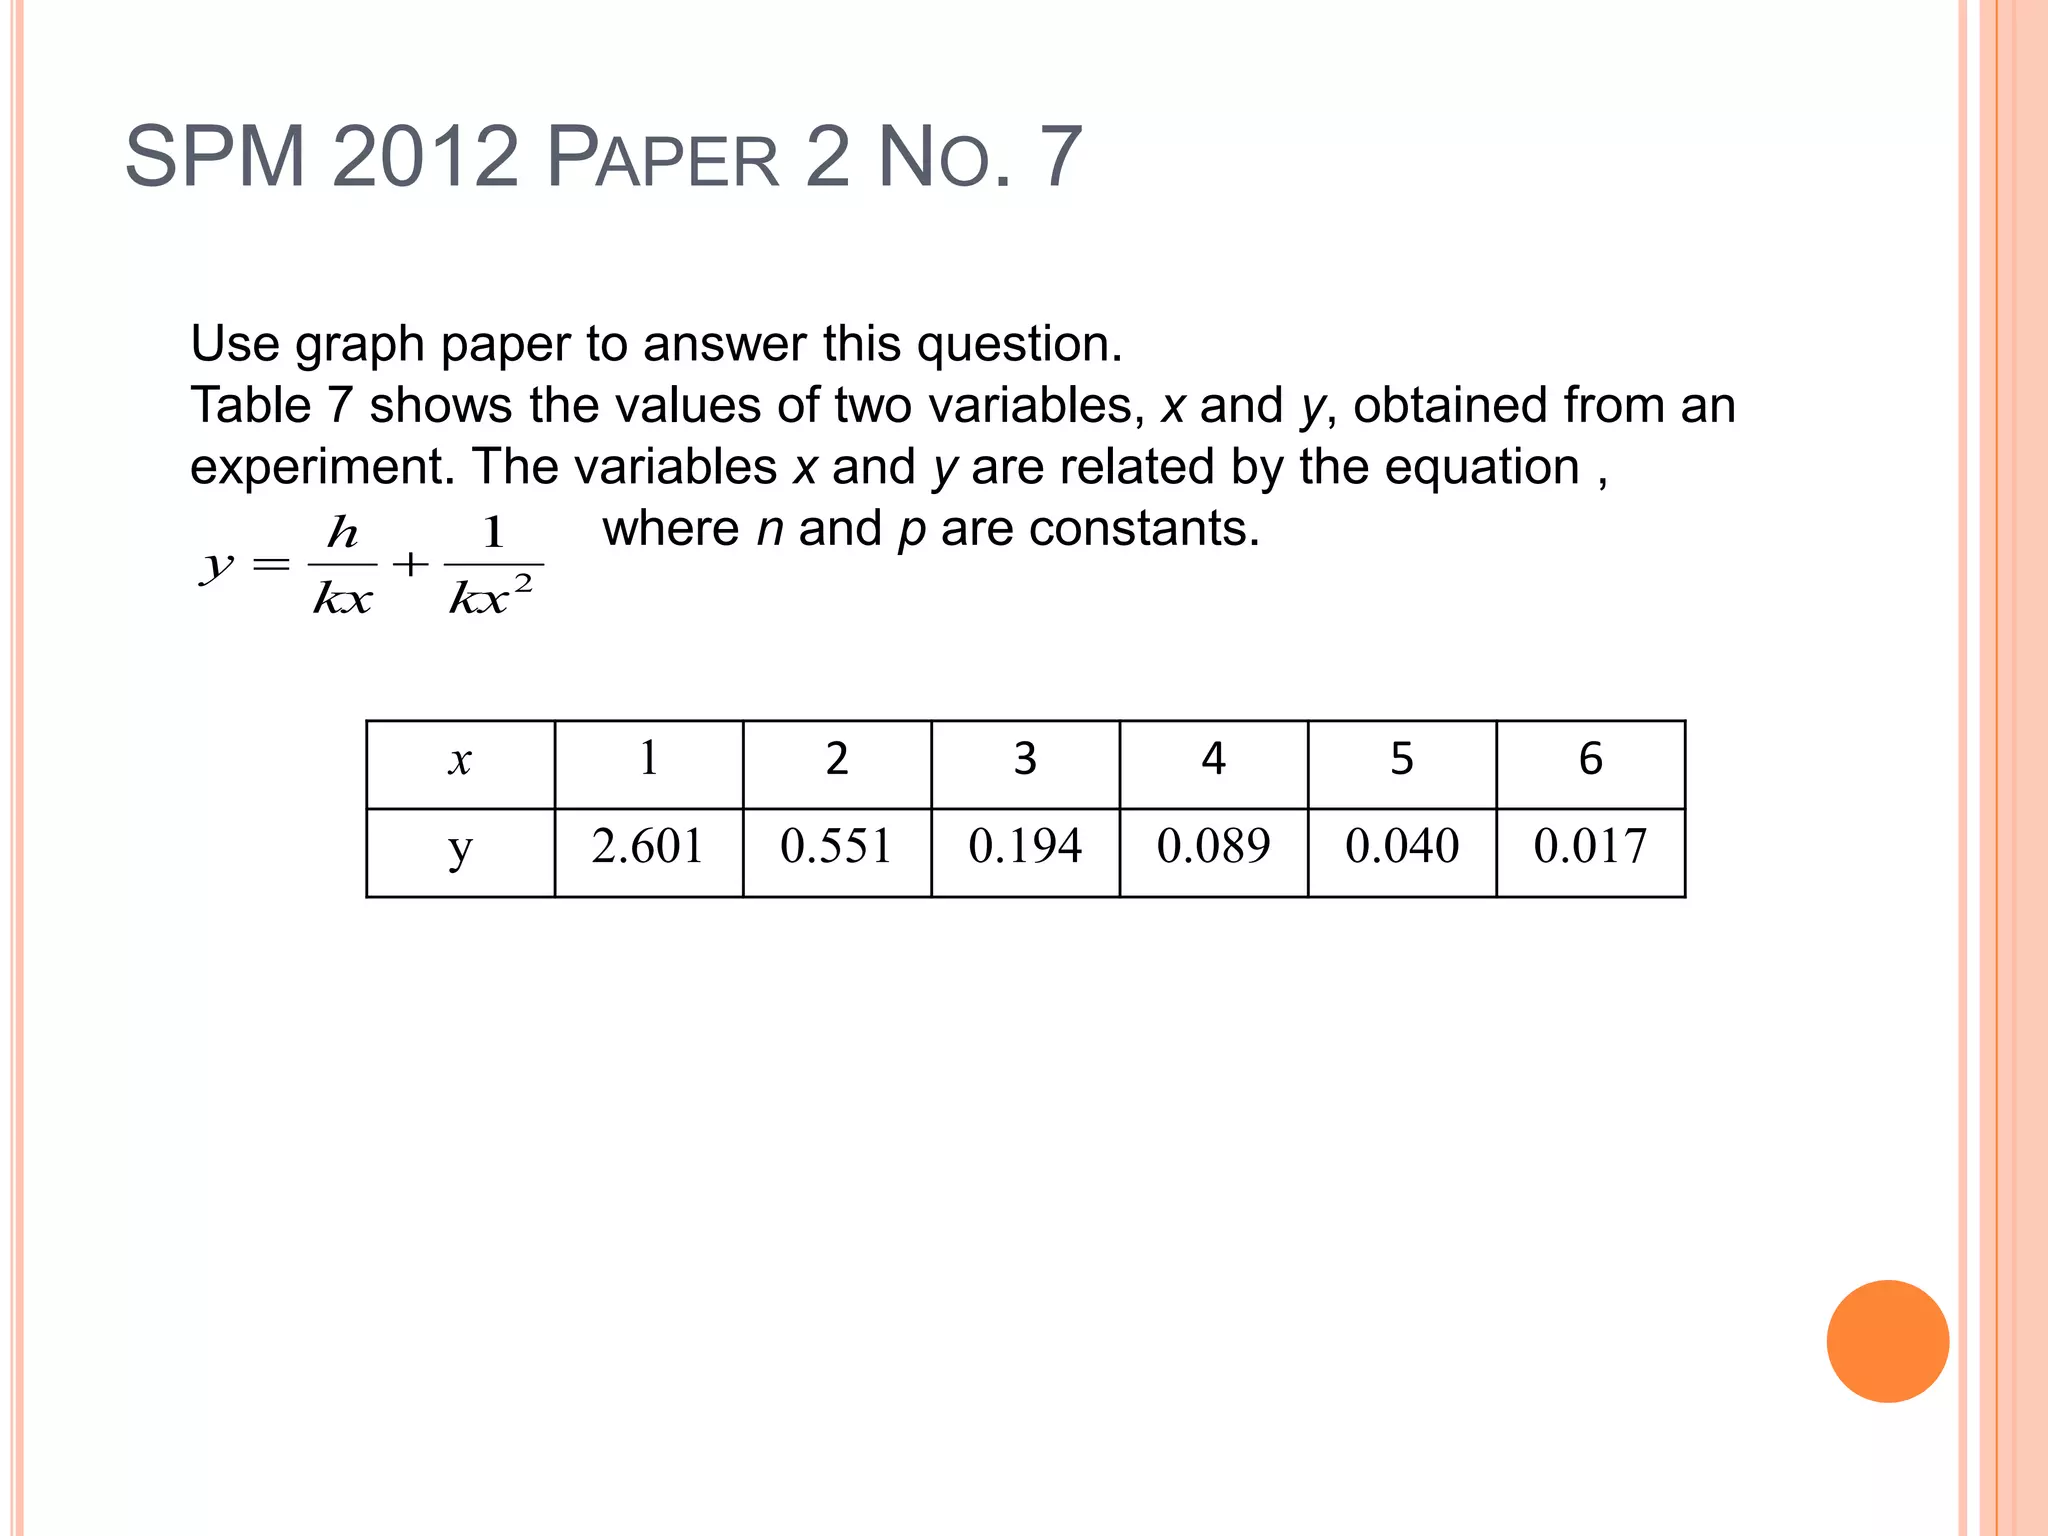
Describing relationships between variables in experiments, plotting data, and finding graphical interpretations.
Graphing and application of statistical analysis involving regression and interpretation of experimental data.
Further examination of experimental data and calculating parameters based on statistical graphing.
Working through various statistical problems, including composite index calculations based on price indices.
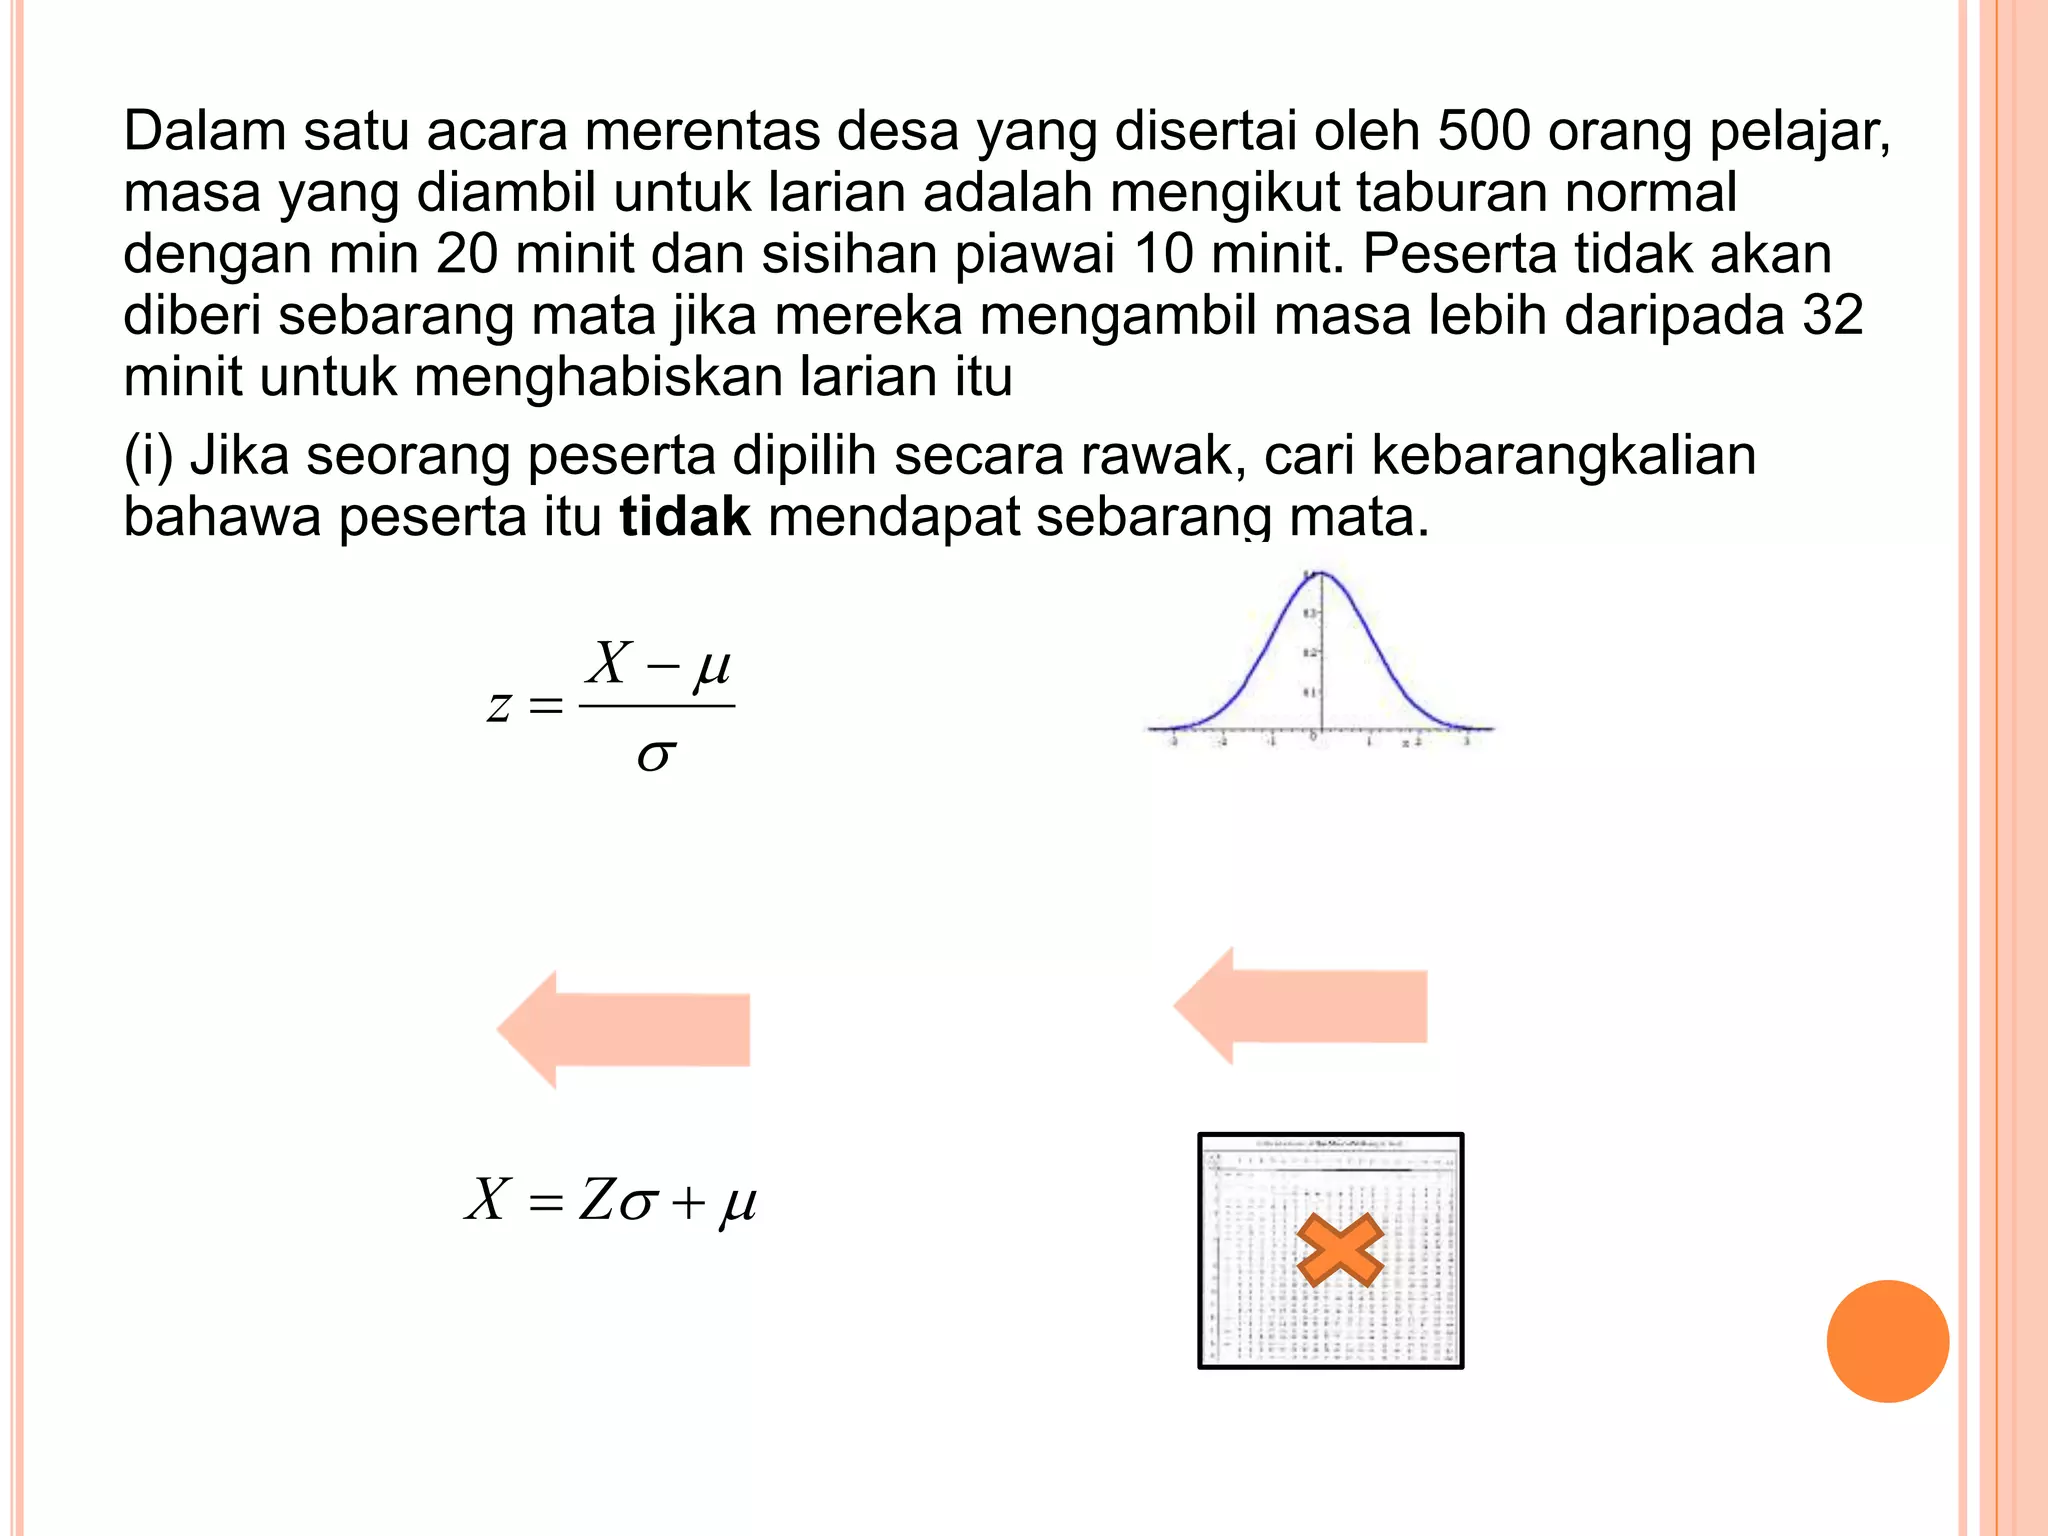
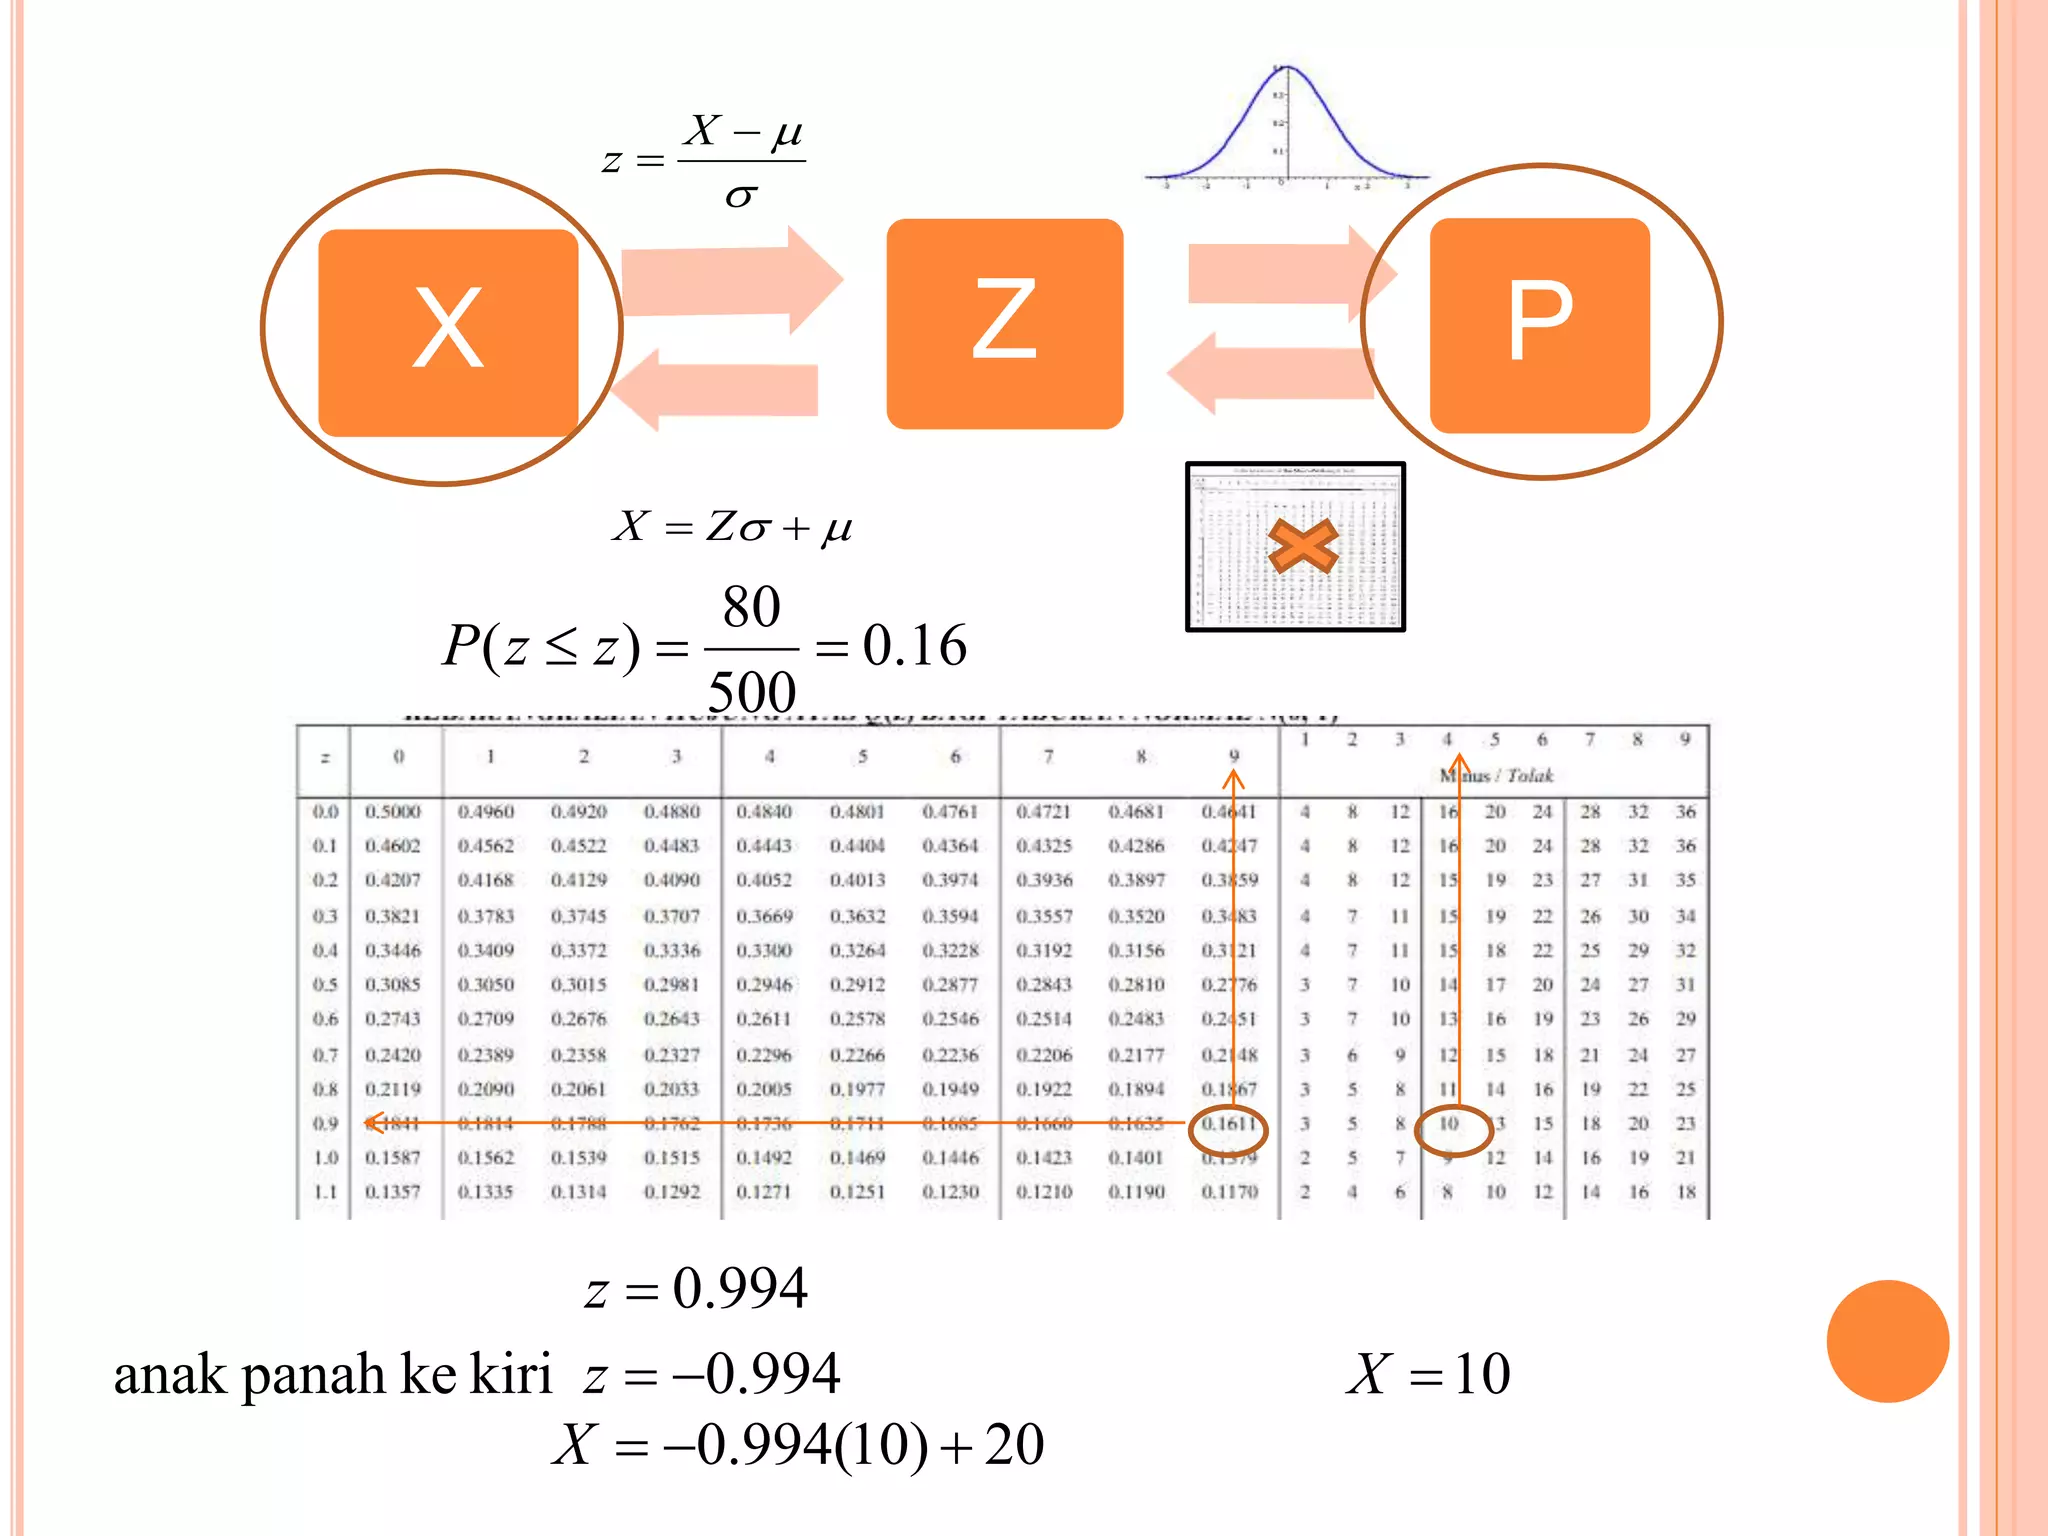
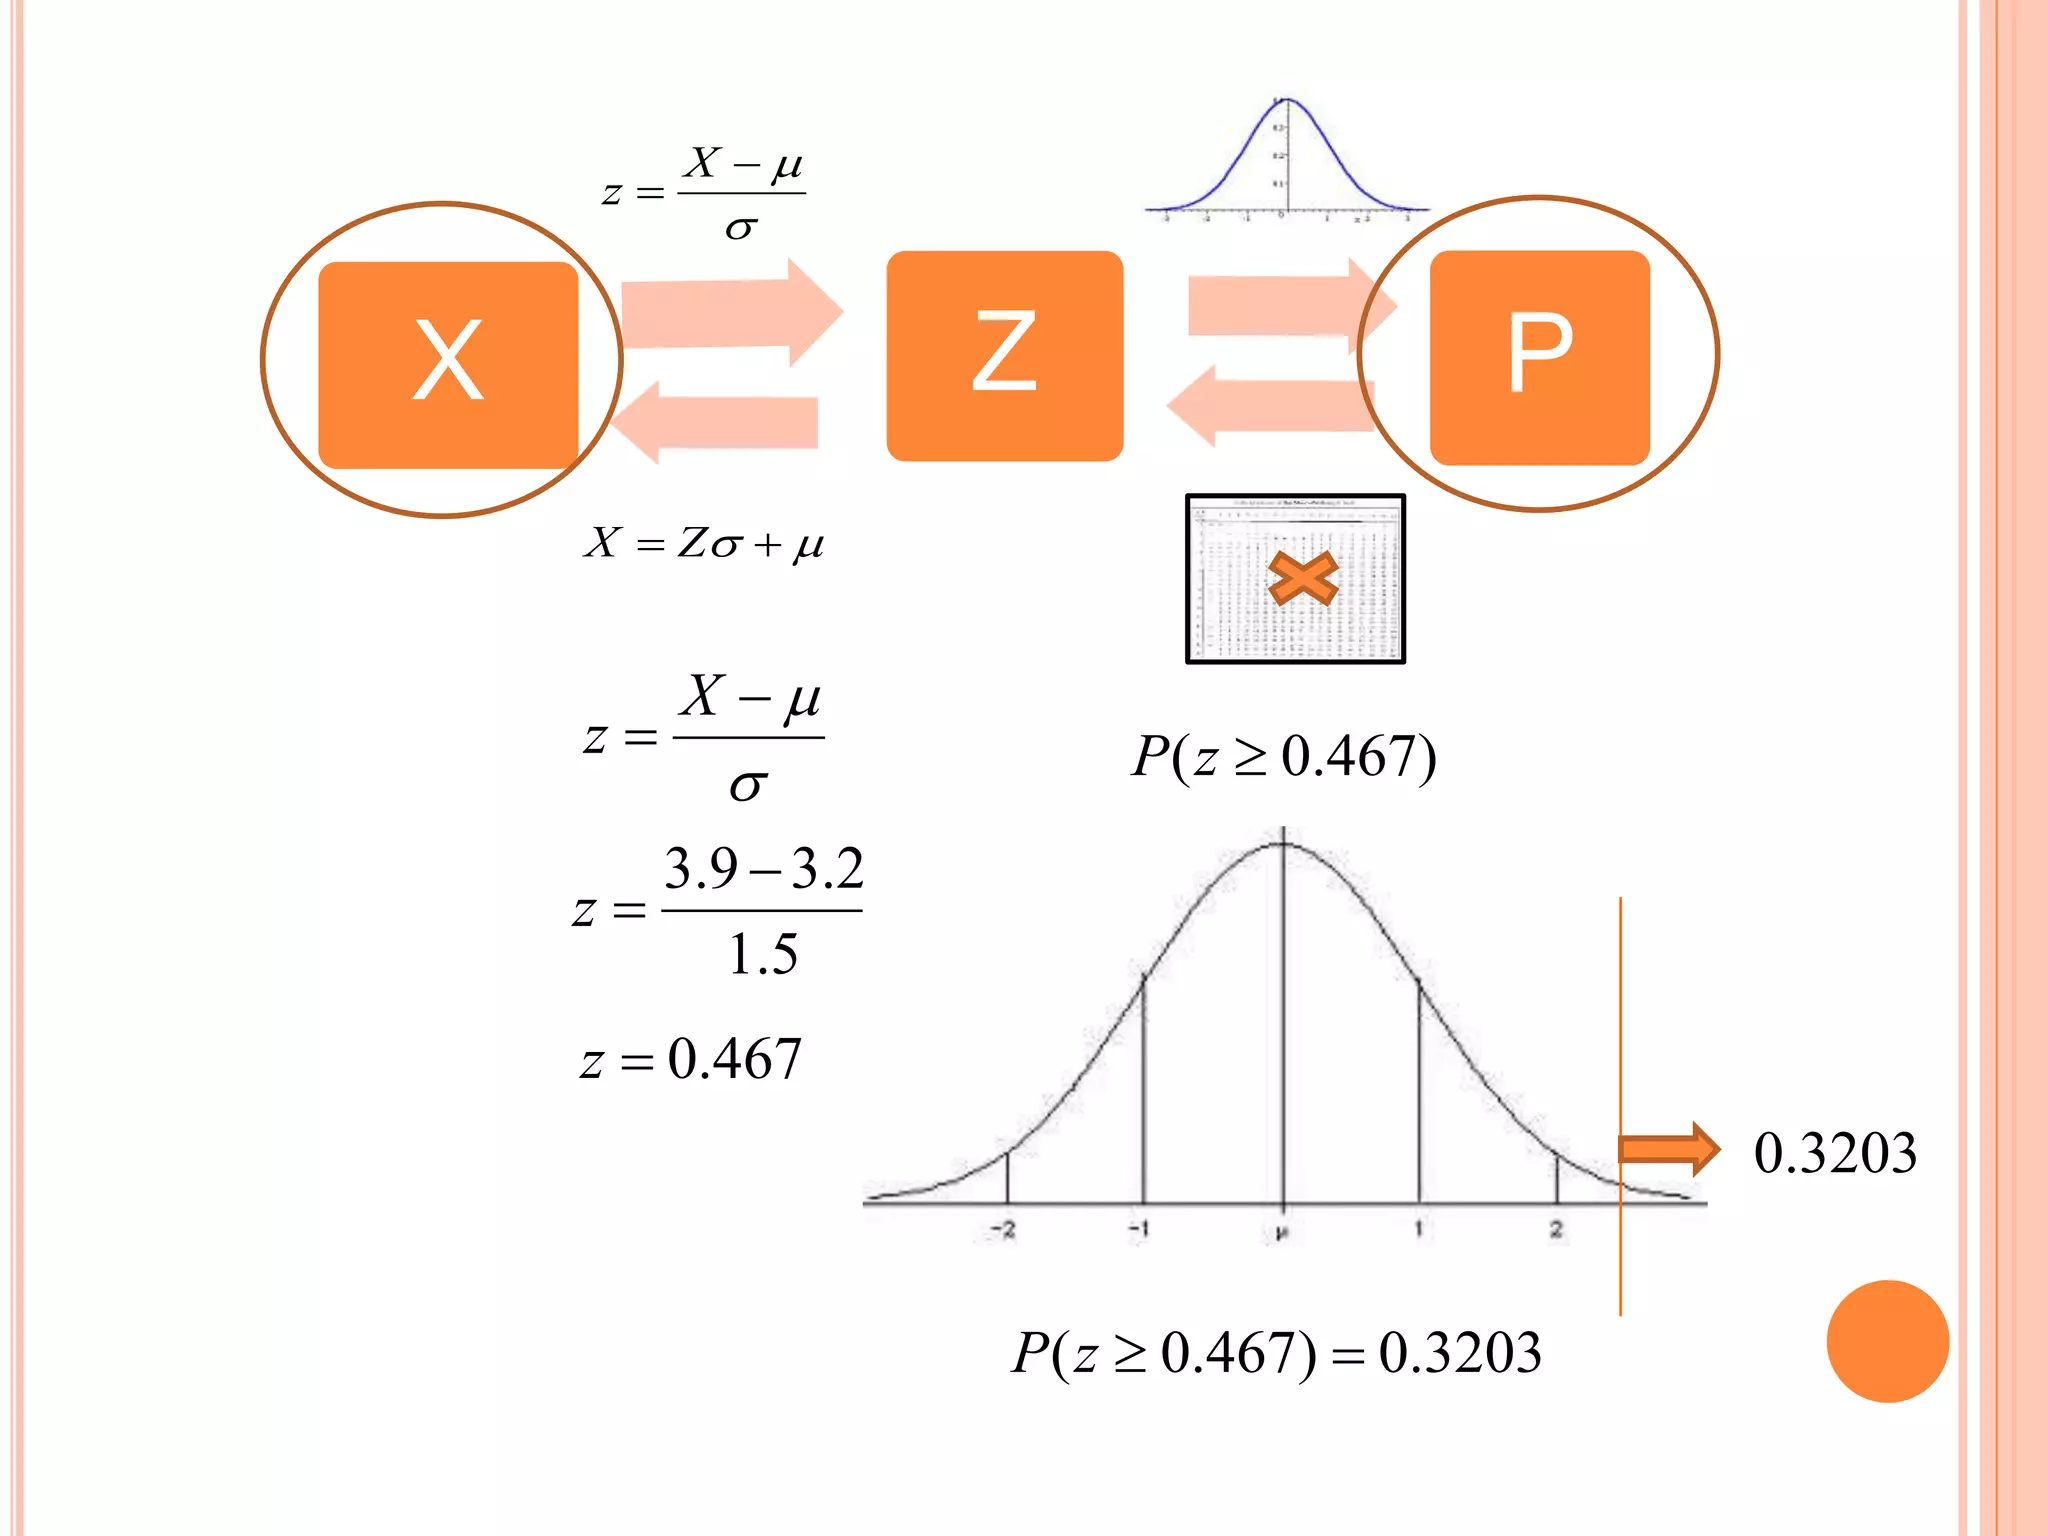
Statistics problems related to distribution, application of normal distribution concepts on data.
Application of probability in educational settings, calculating chances based on successes and failures.
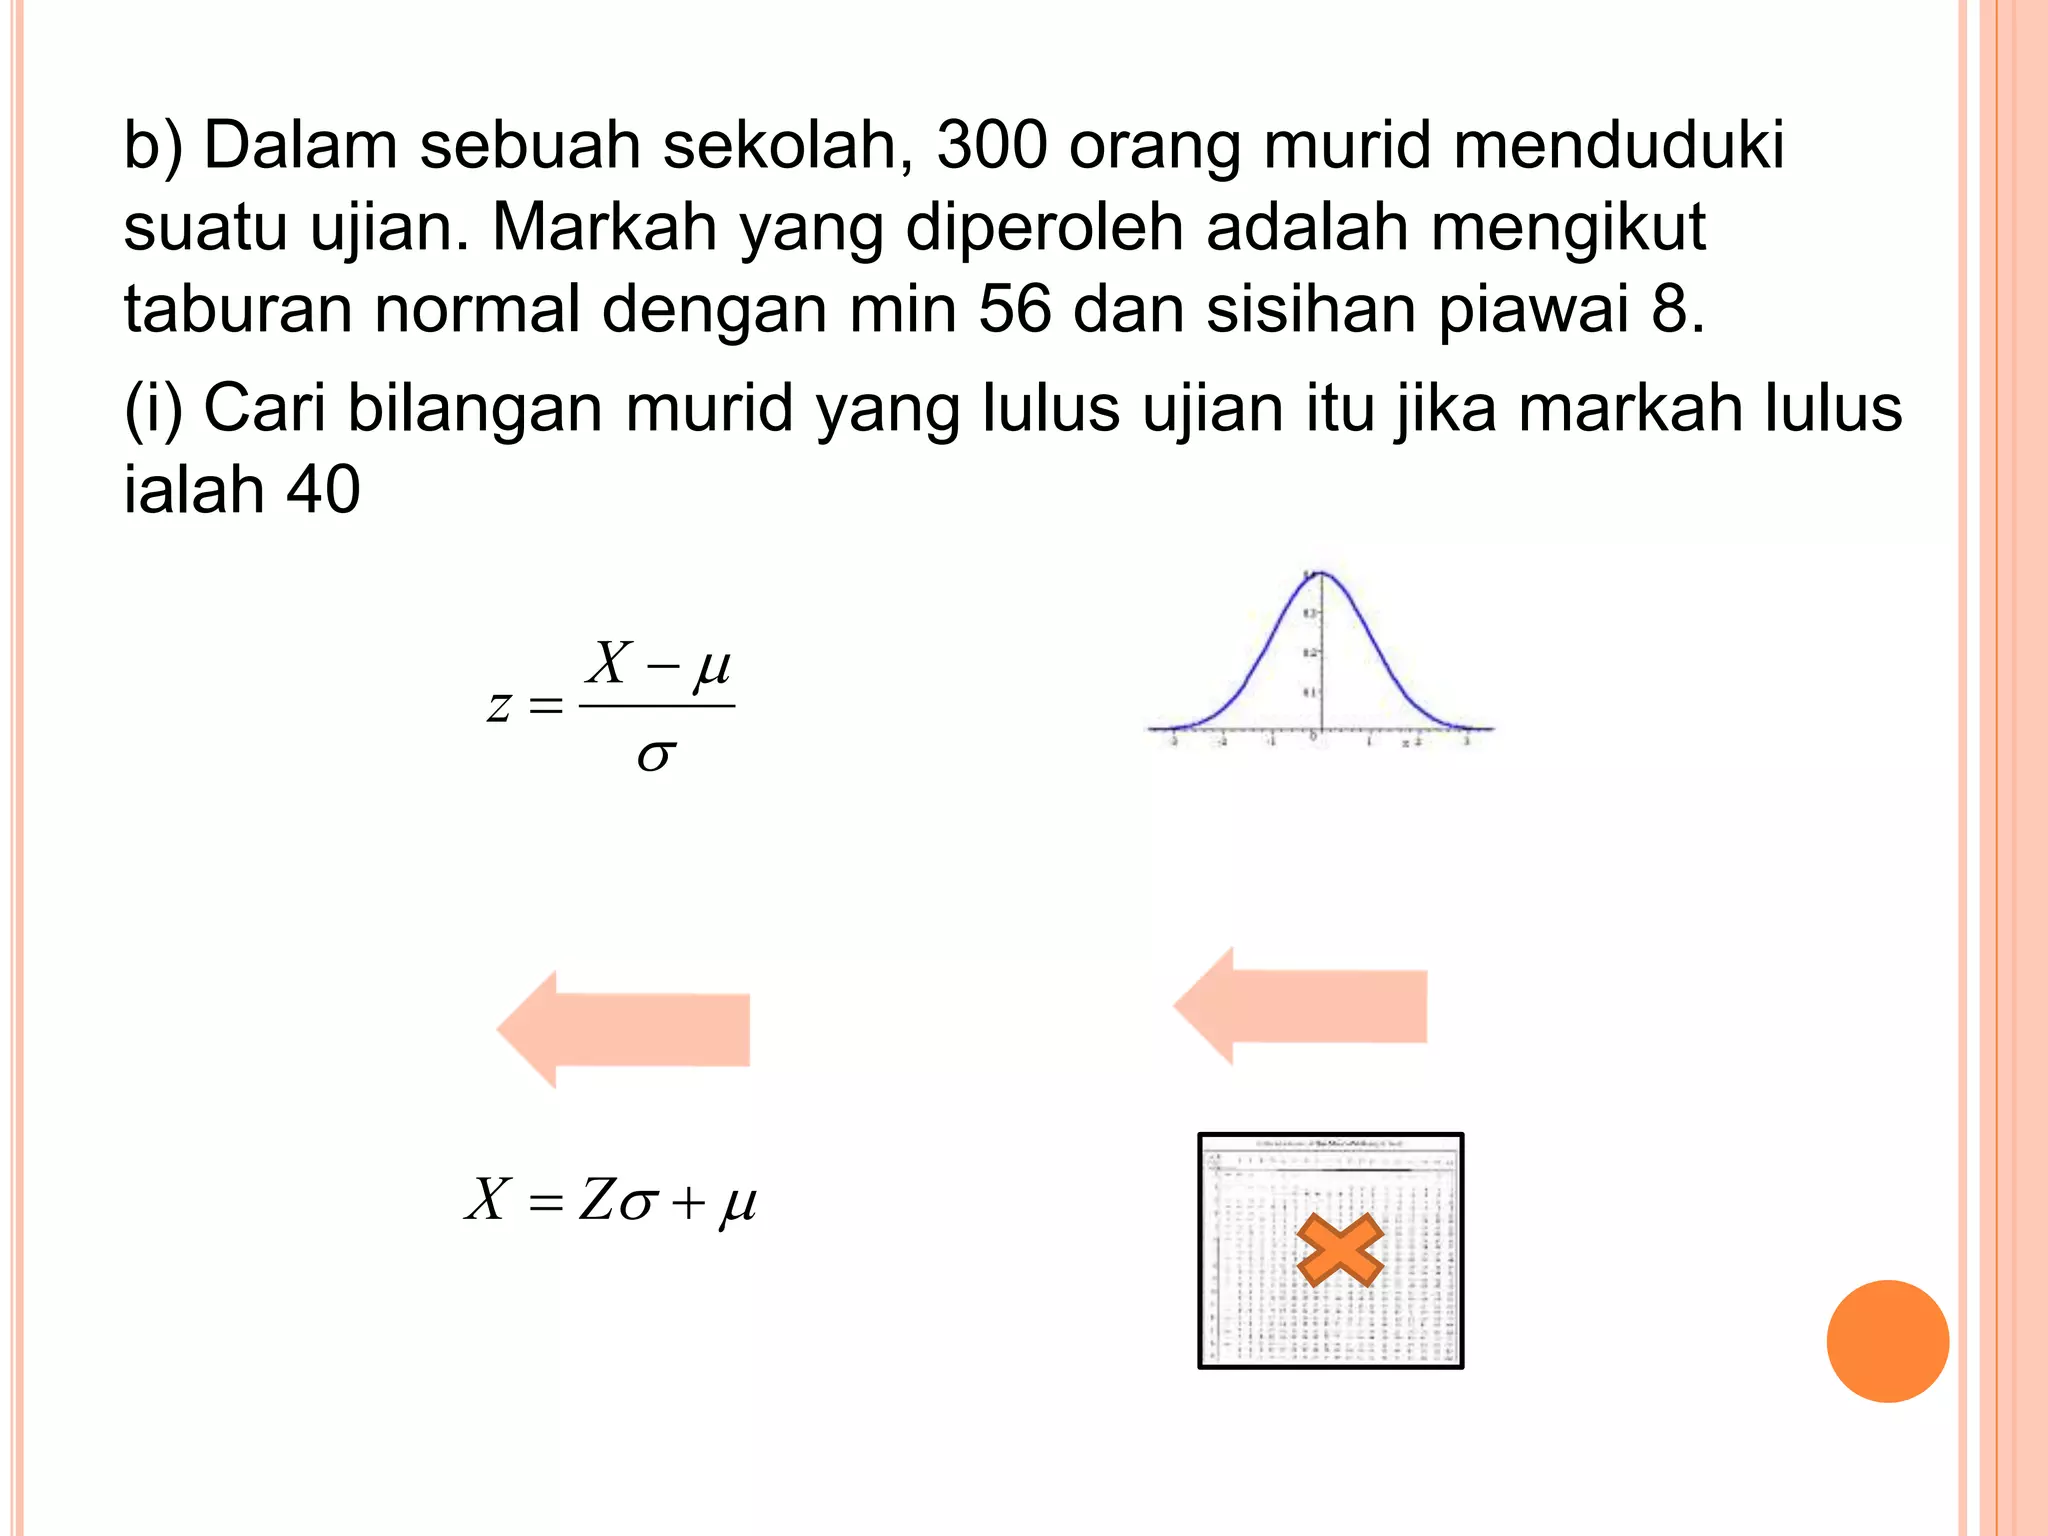
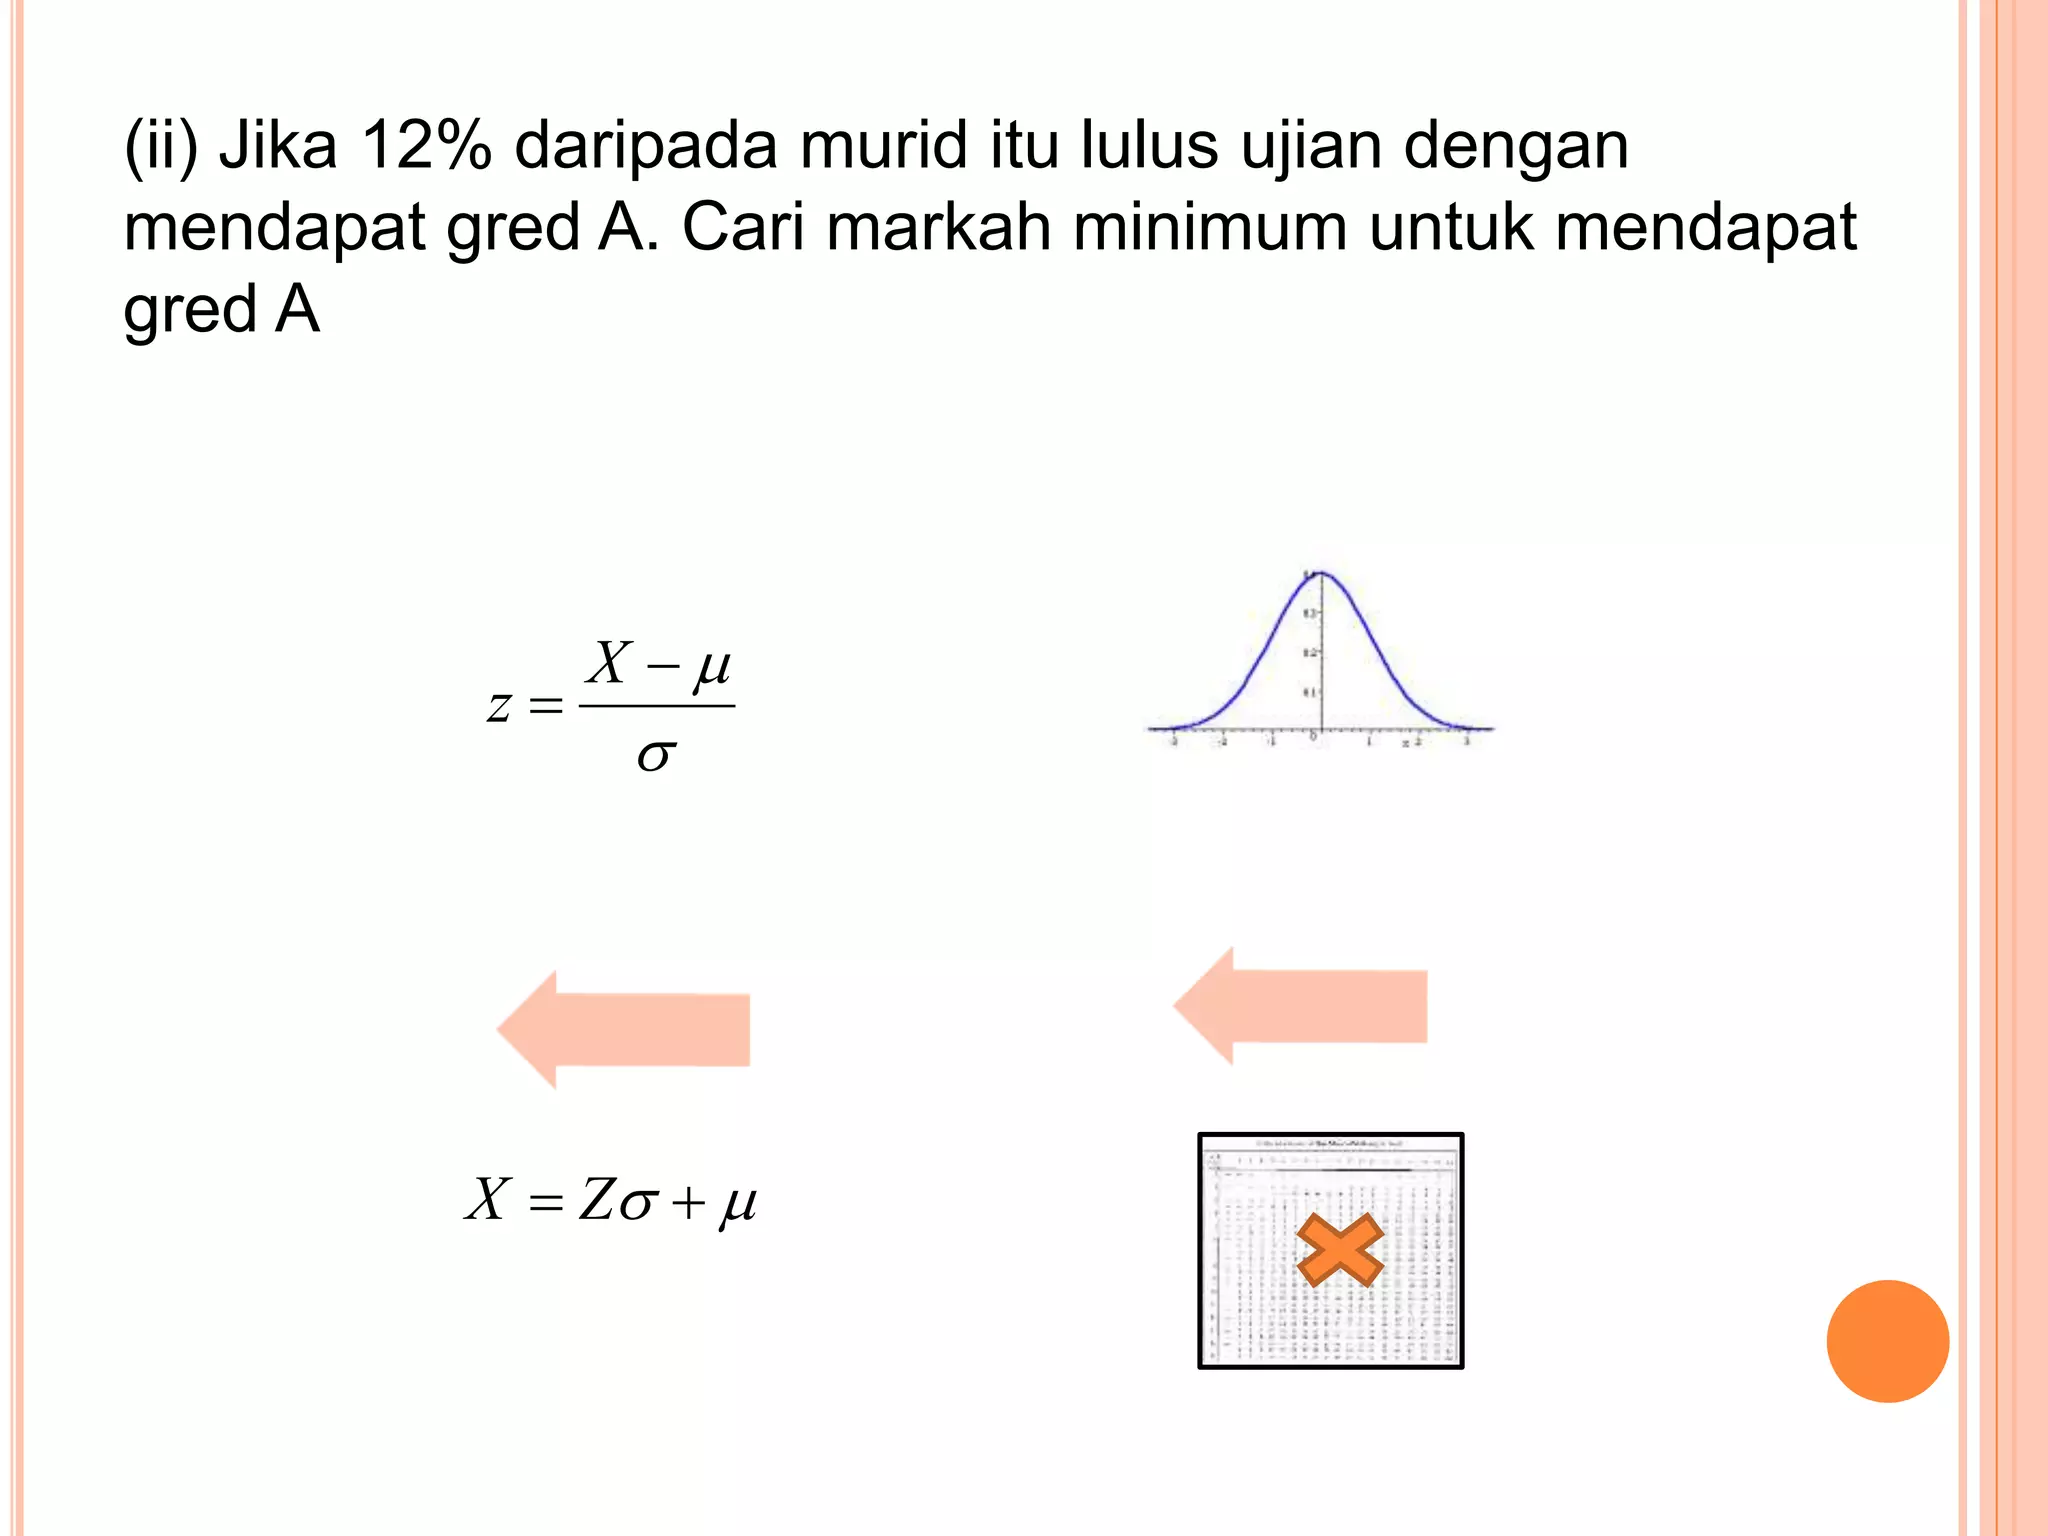
Assessment of normal distributions related to exam performances and percentile calculations.
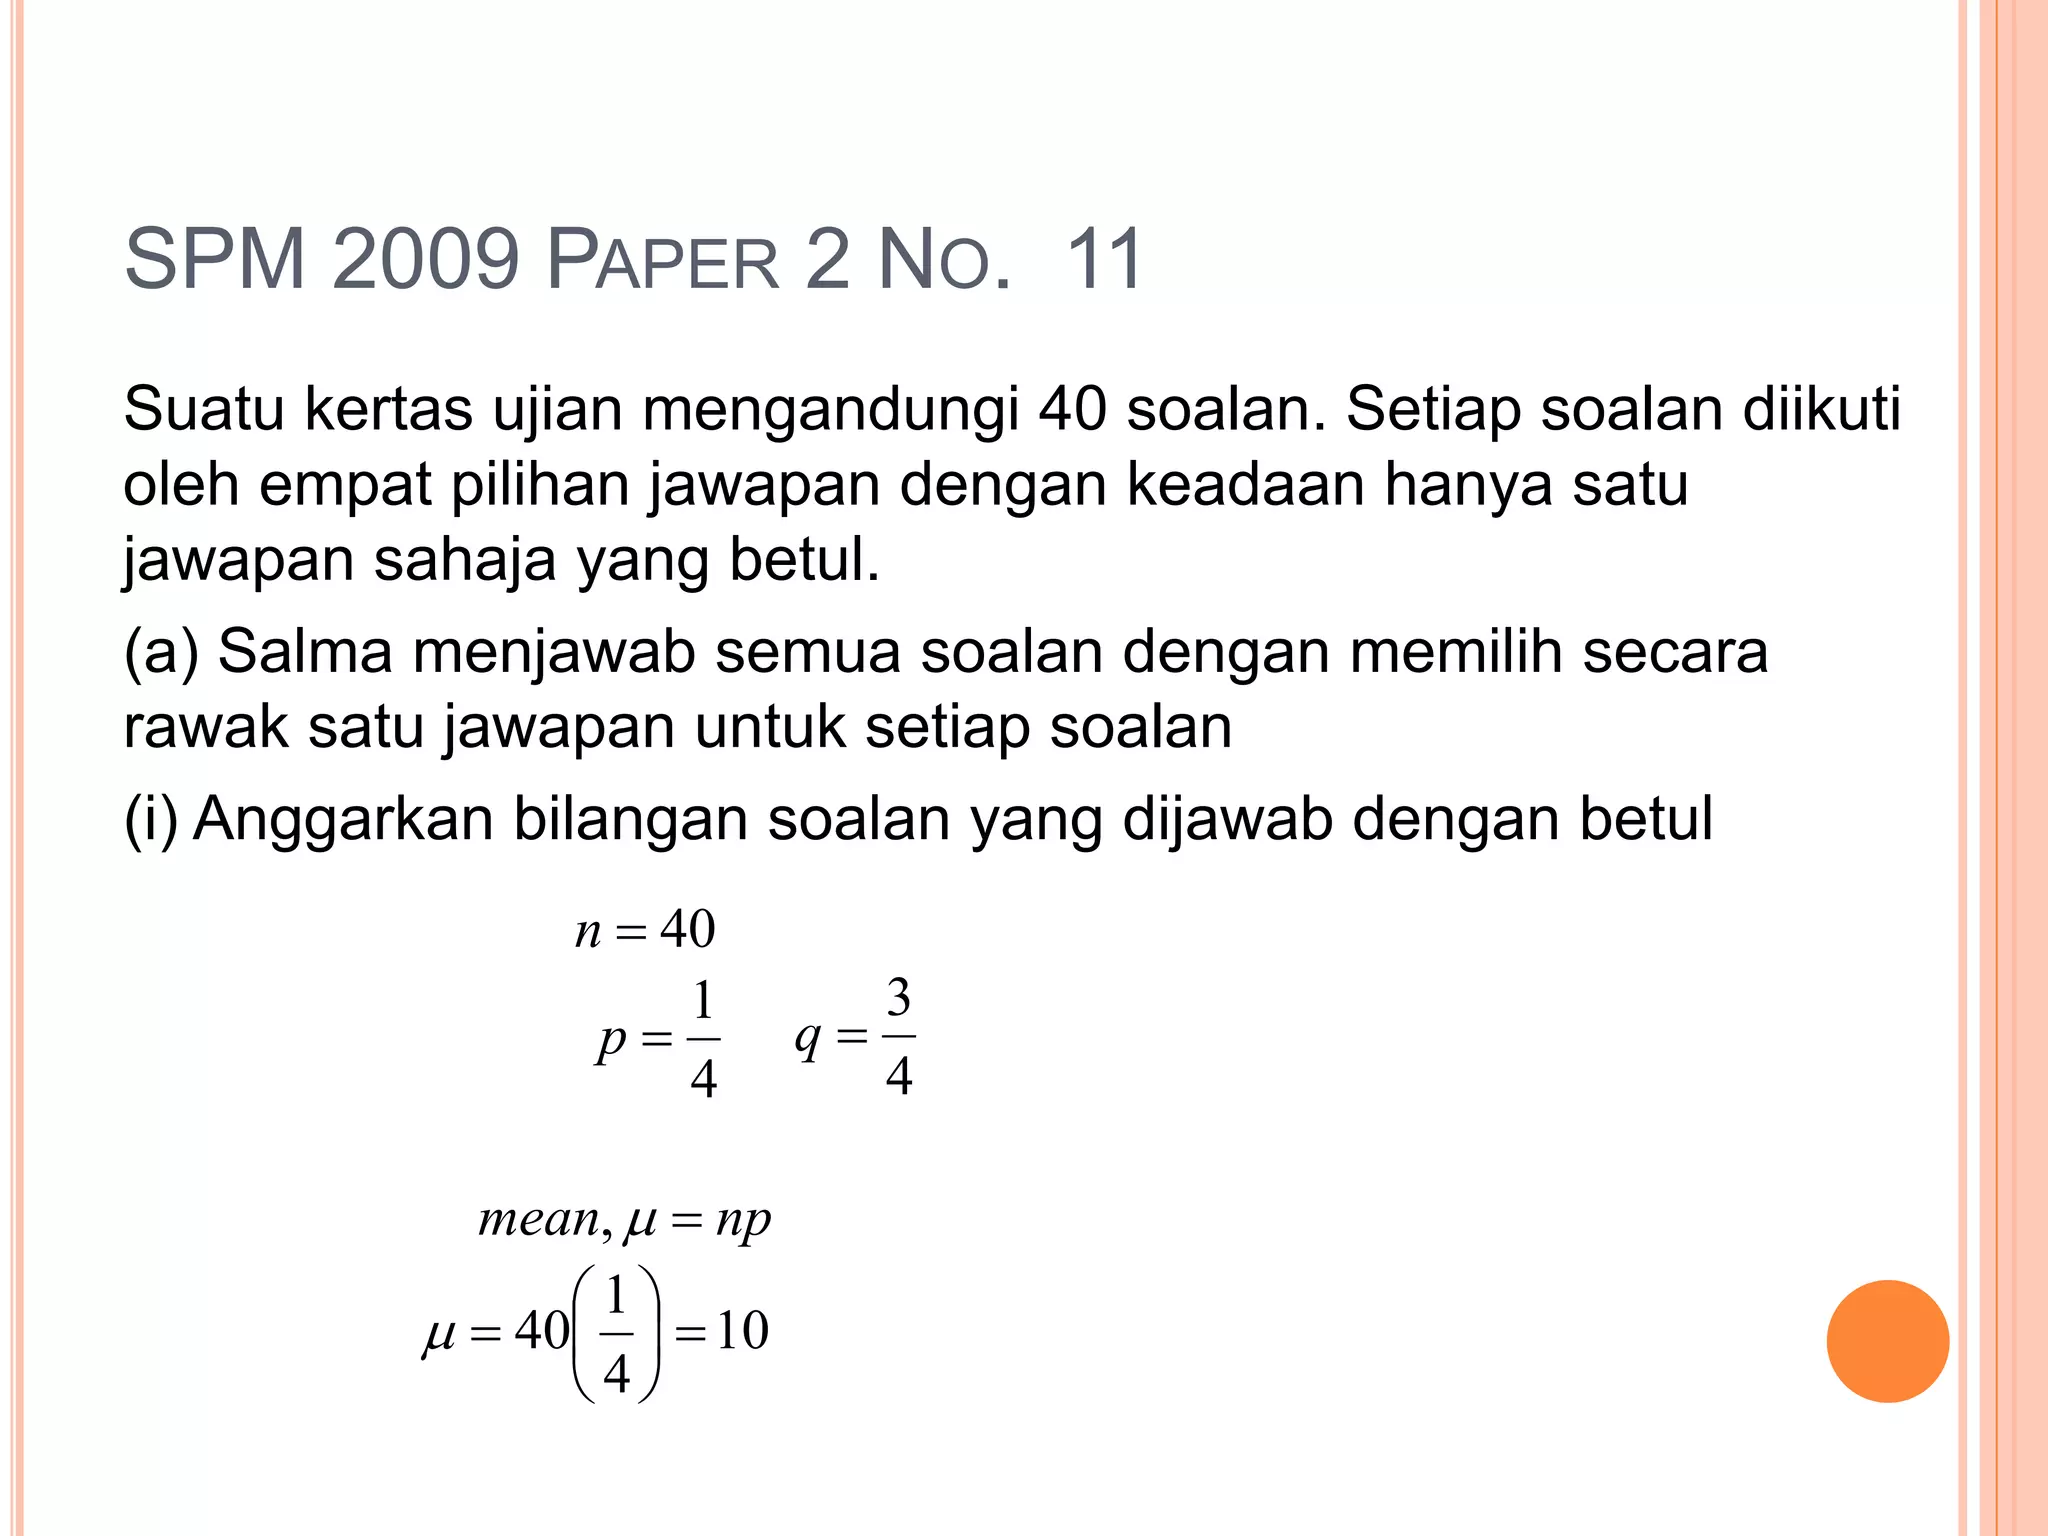
Examining binomial distributions related to students' responses in a test scenario.
Probabilities explored through distributions involving fruit sizes, focusing on statistical cutoffs.
Further studies on distributions with a focus on the diameter of fruit and its implications.
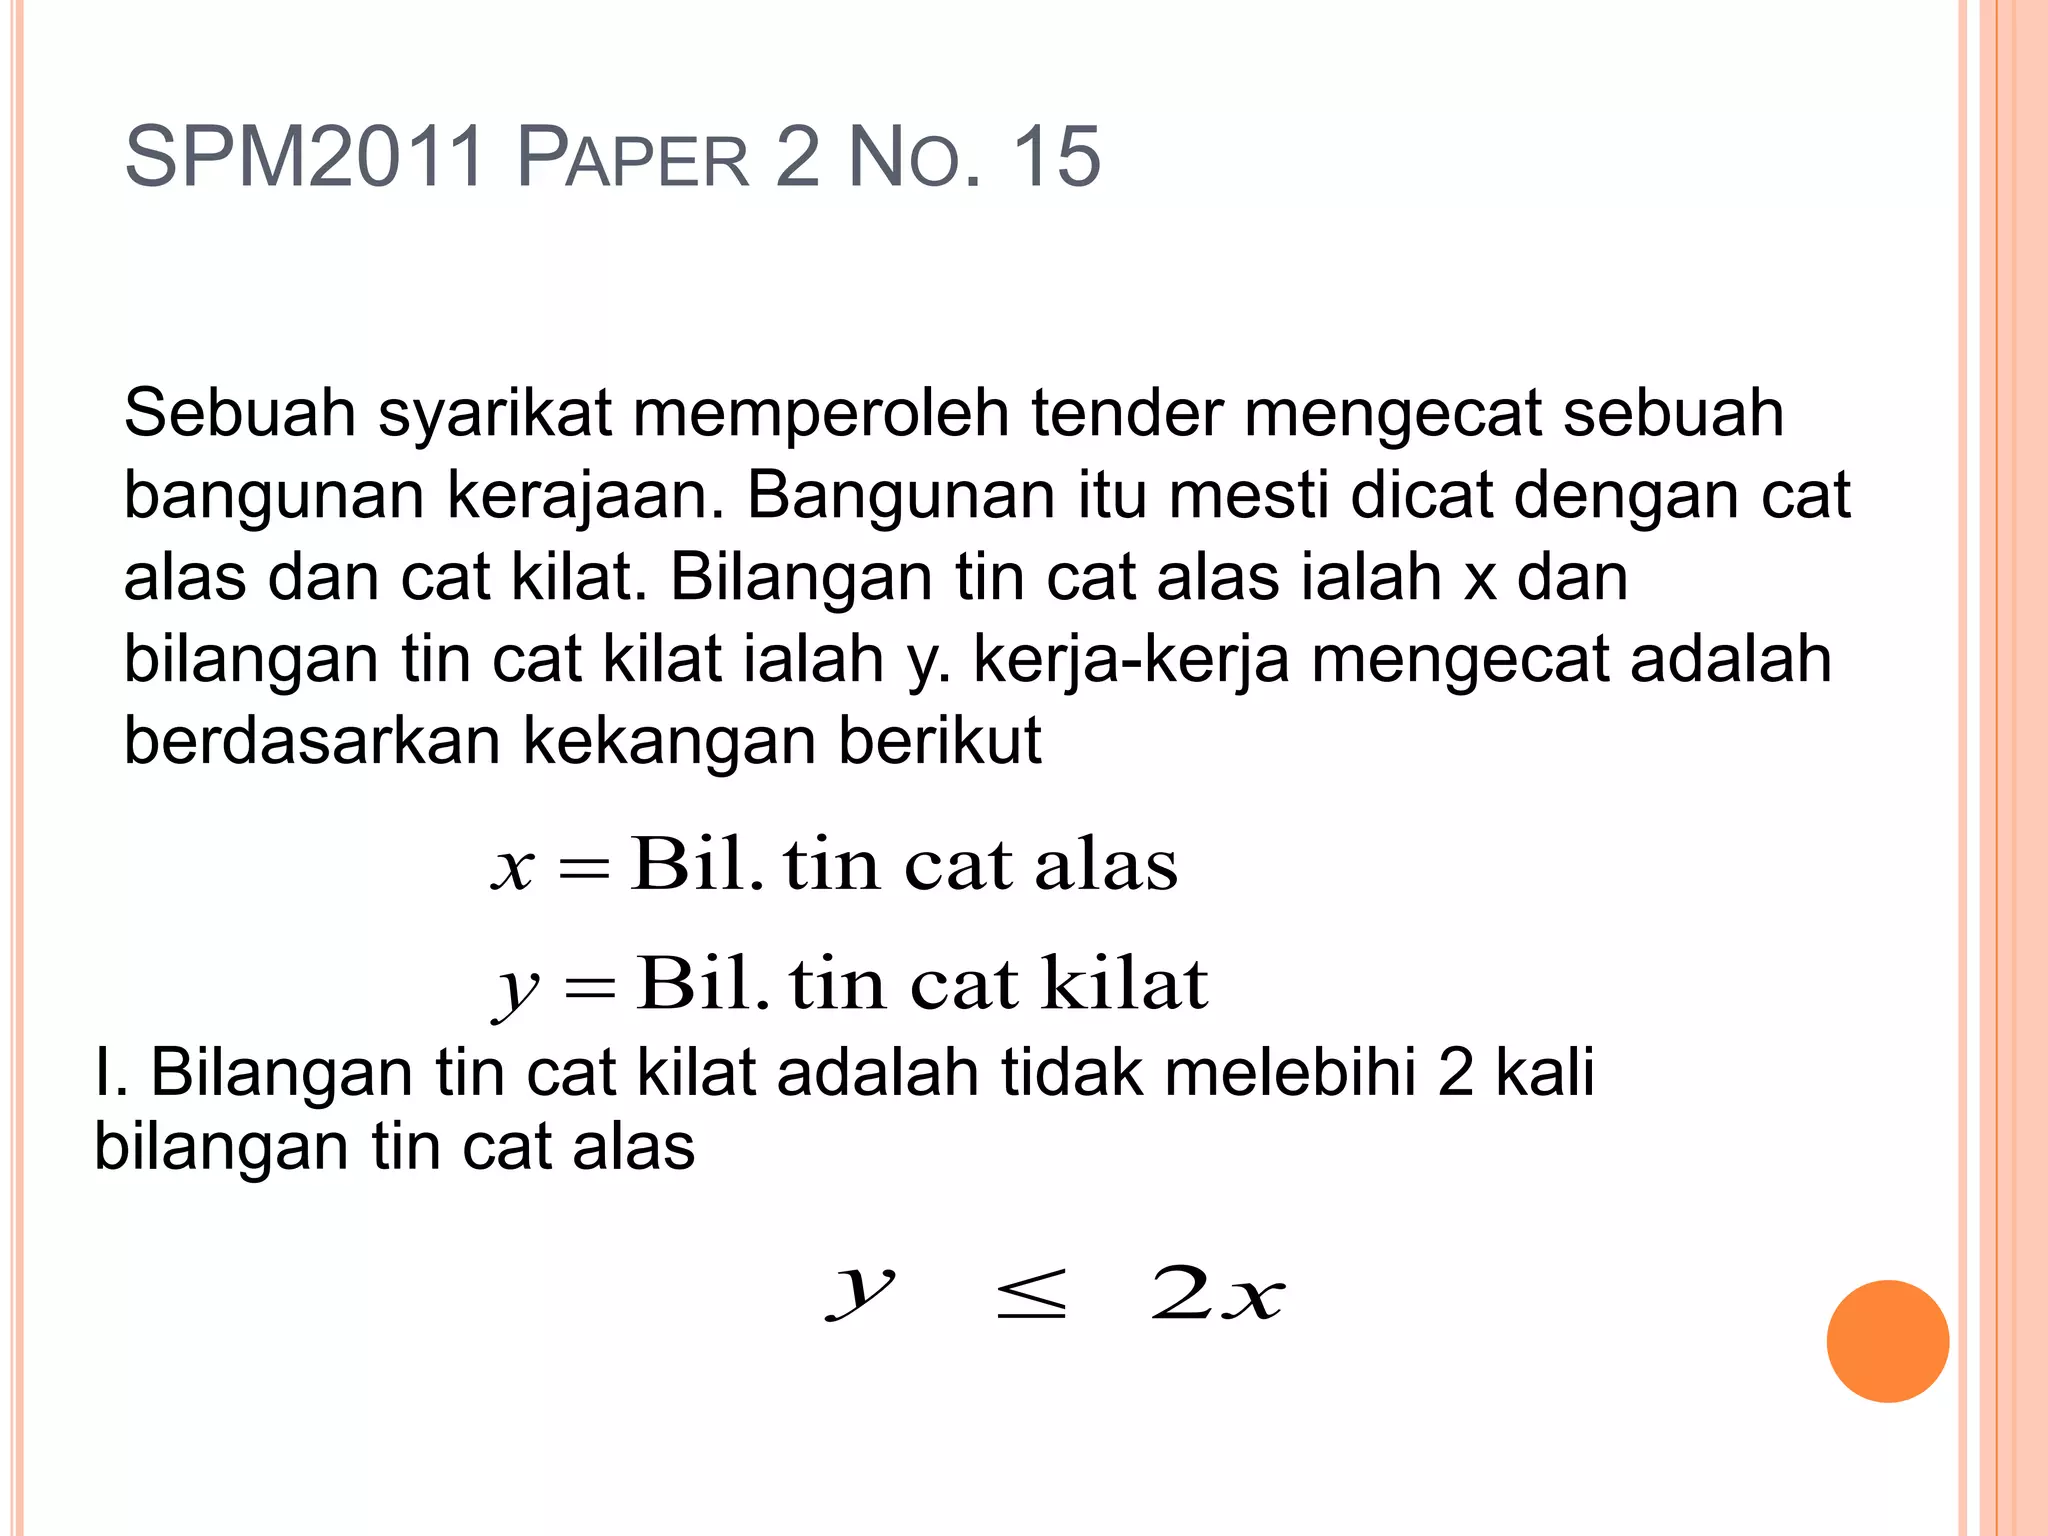
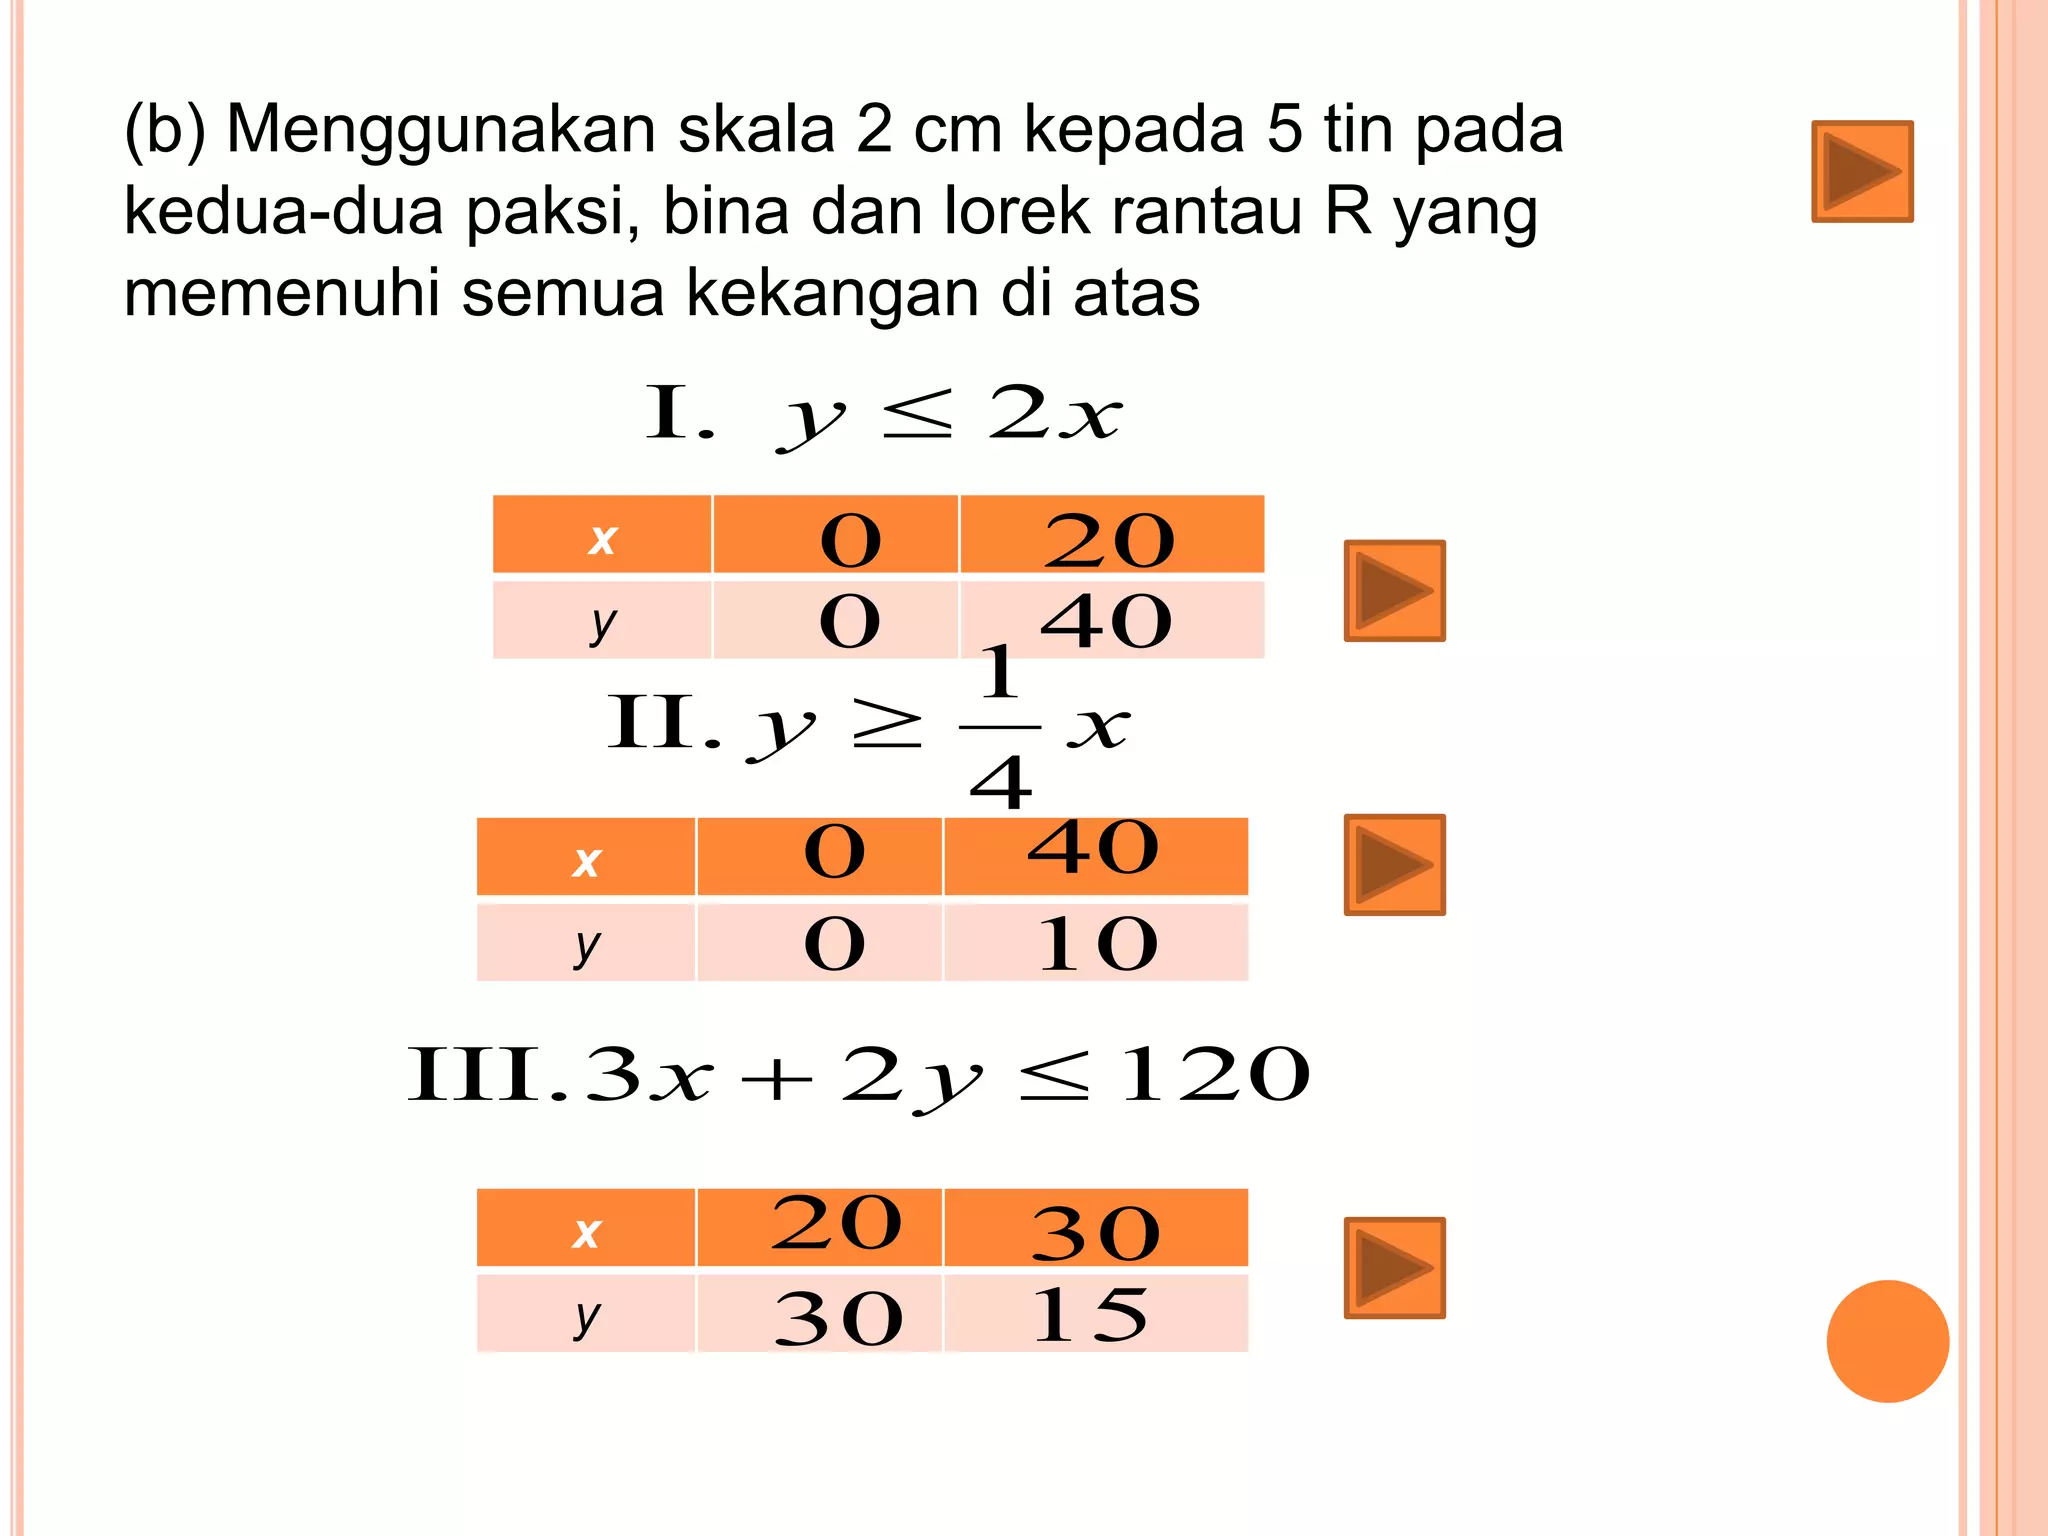
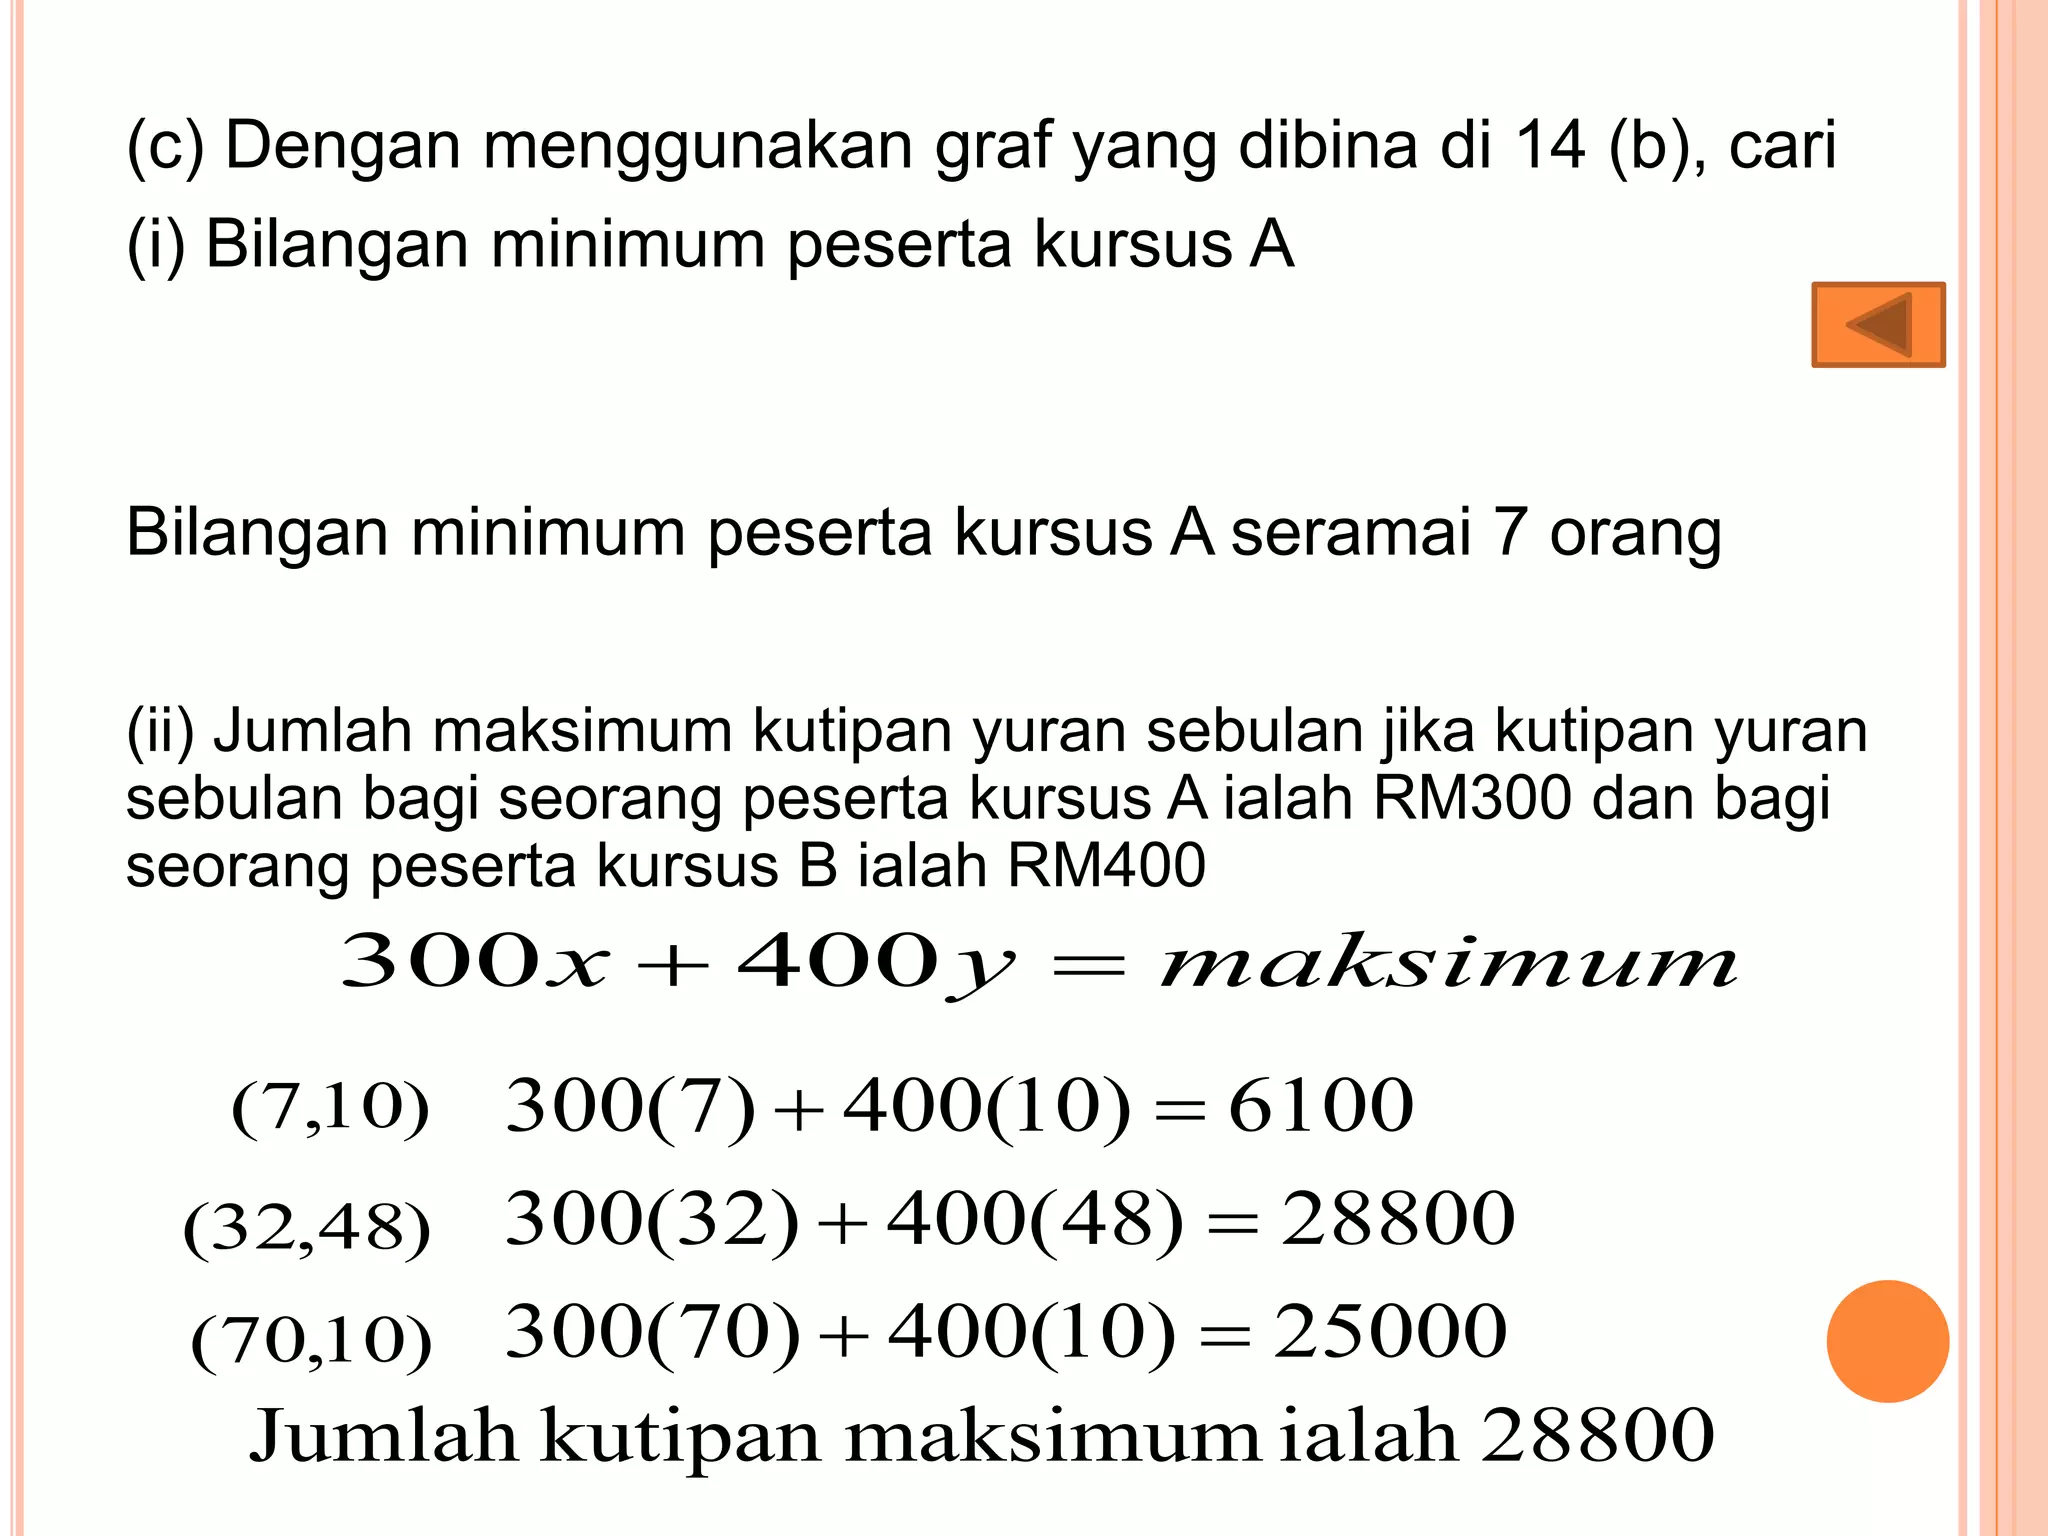
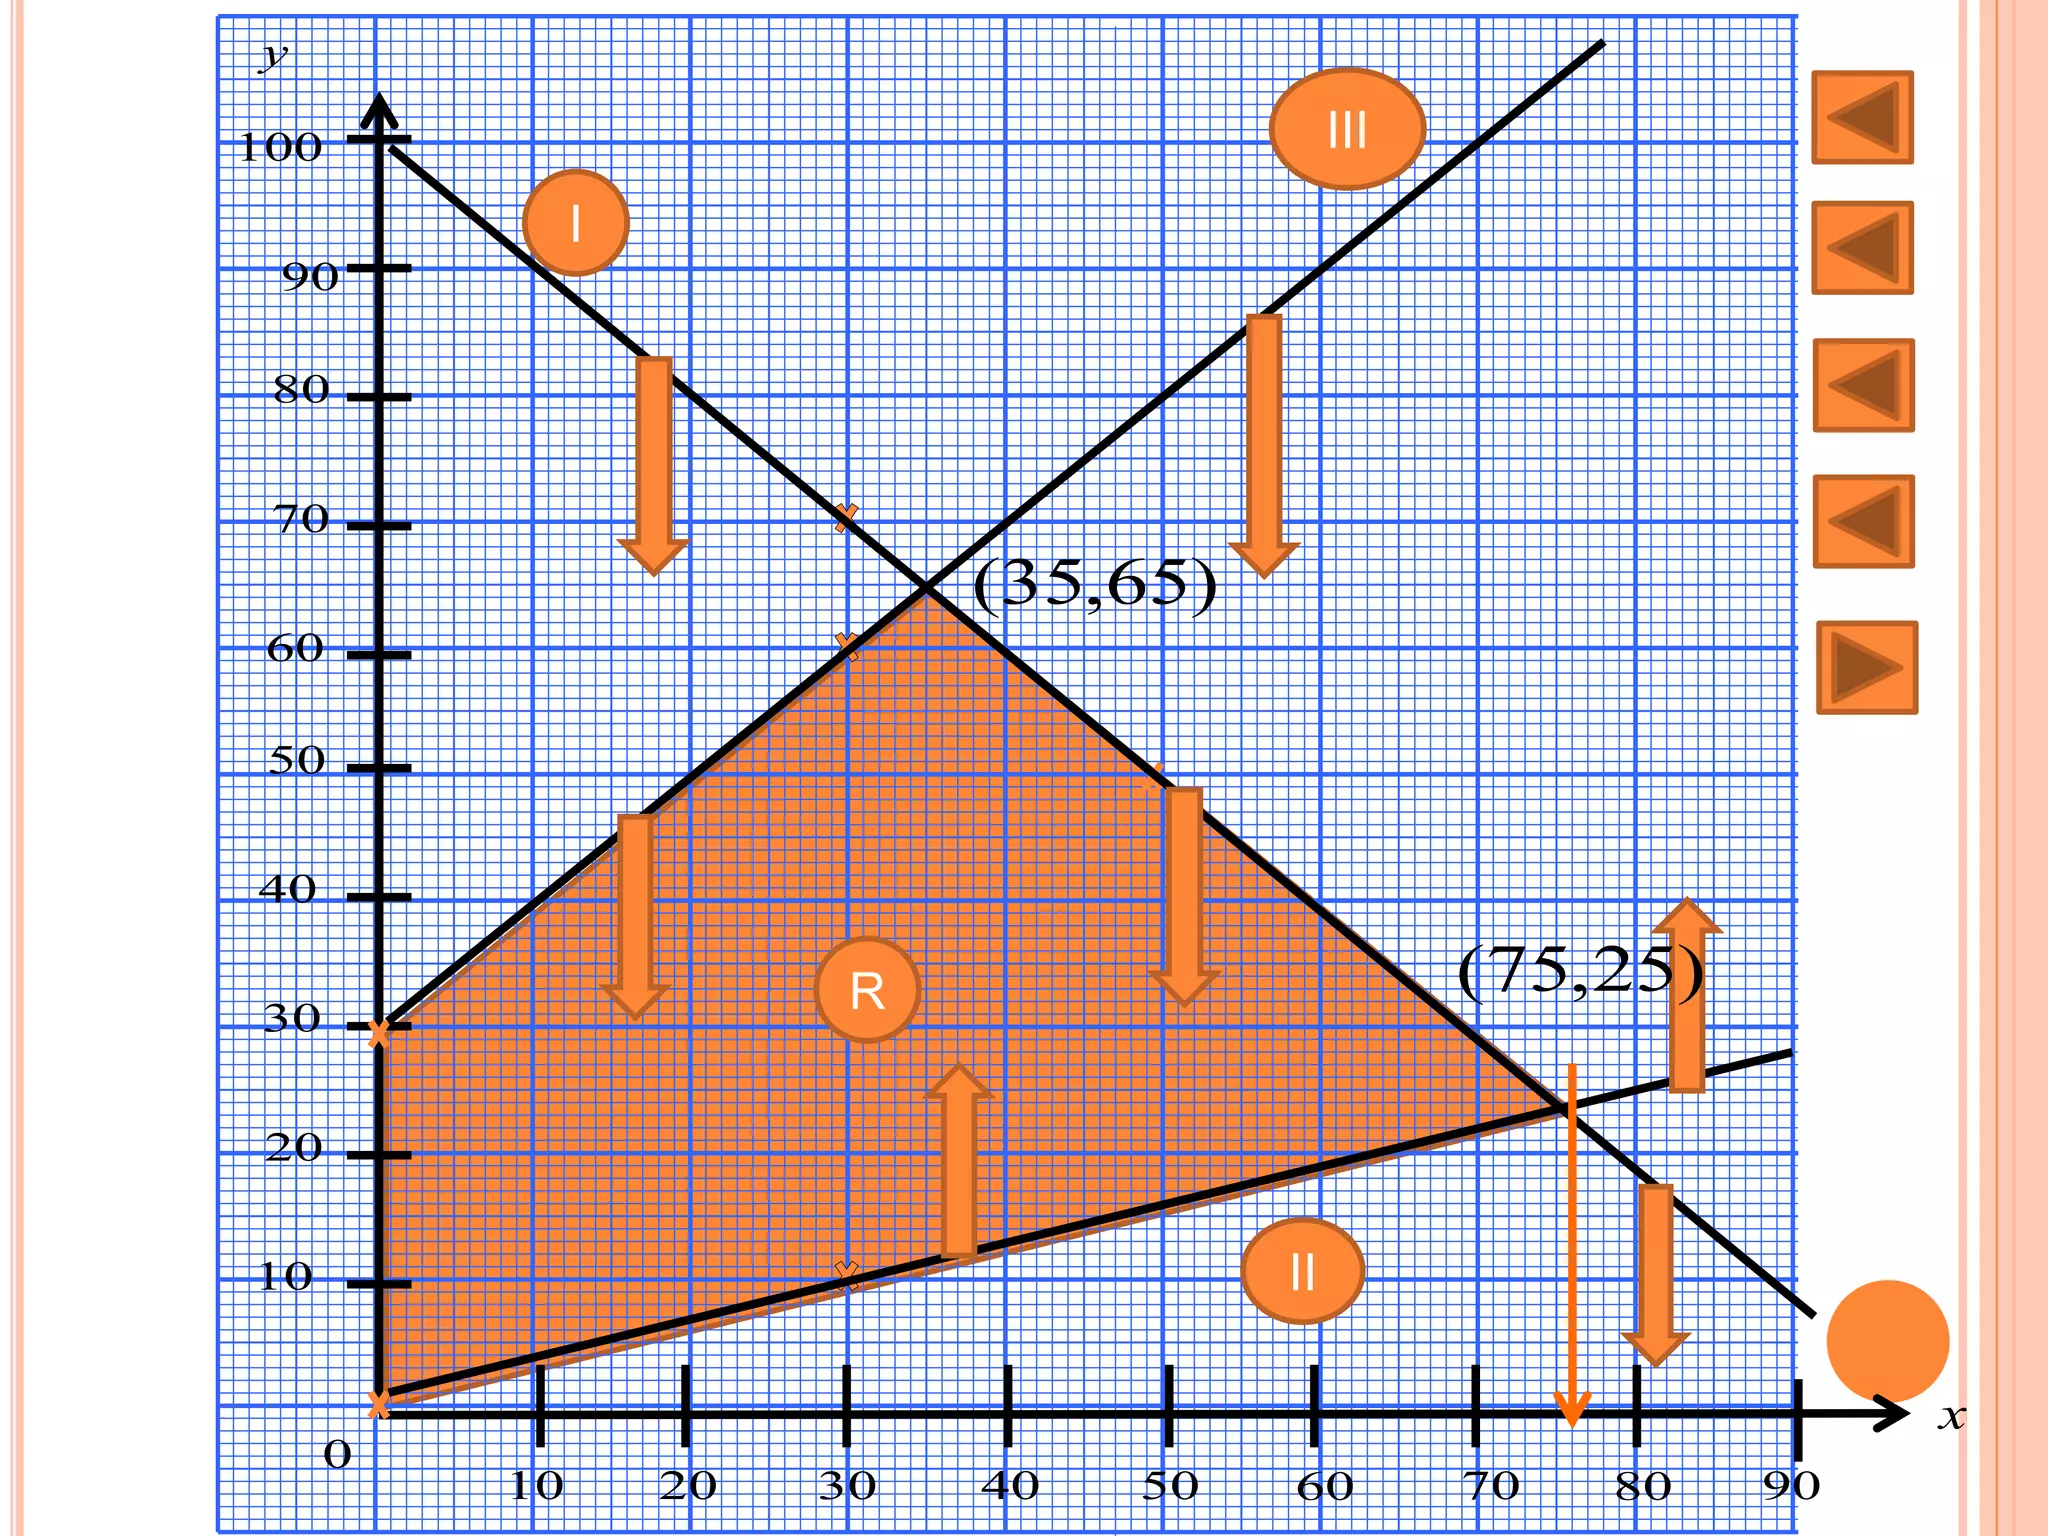
Linear programming challenges, emphasizing production constraints and graphical representations.
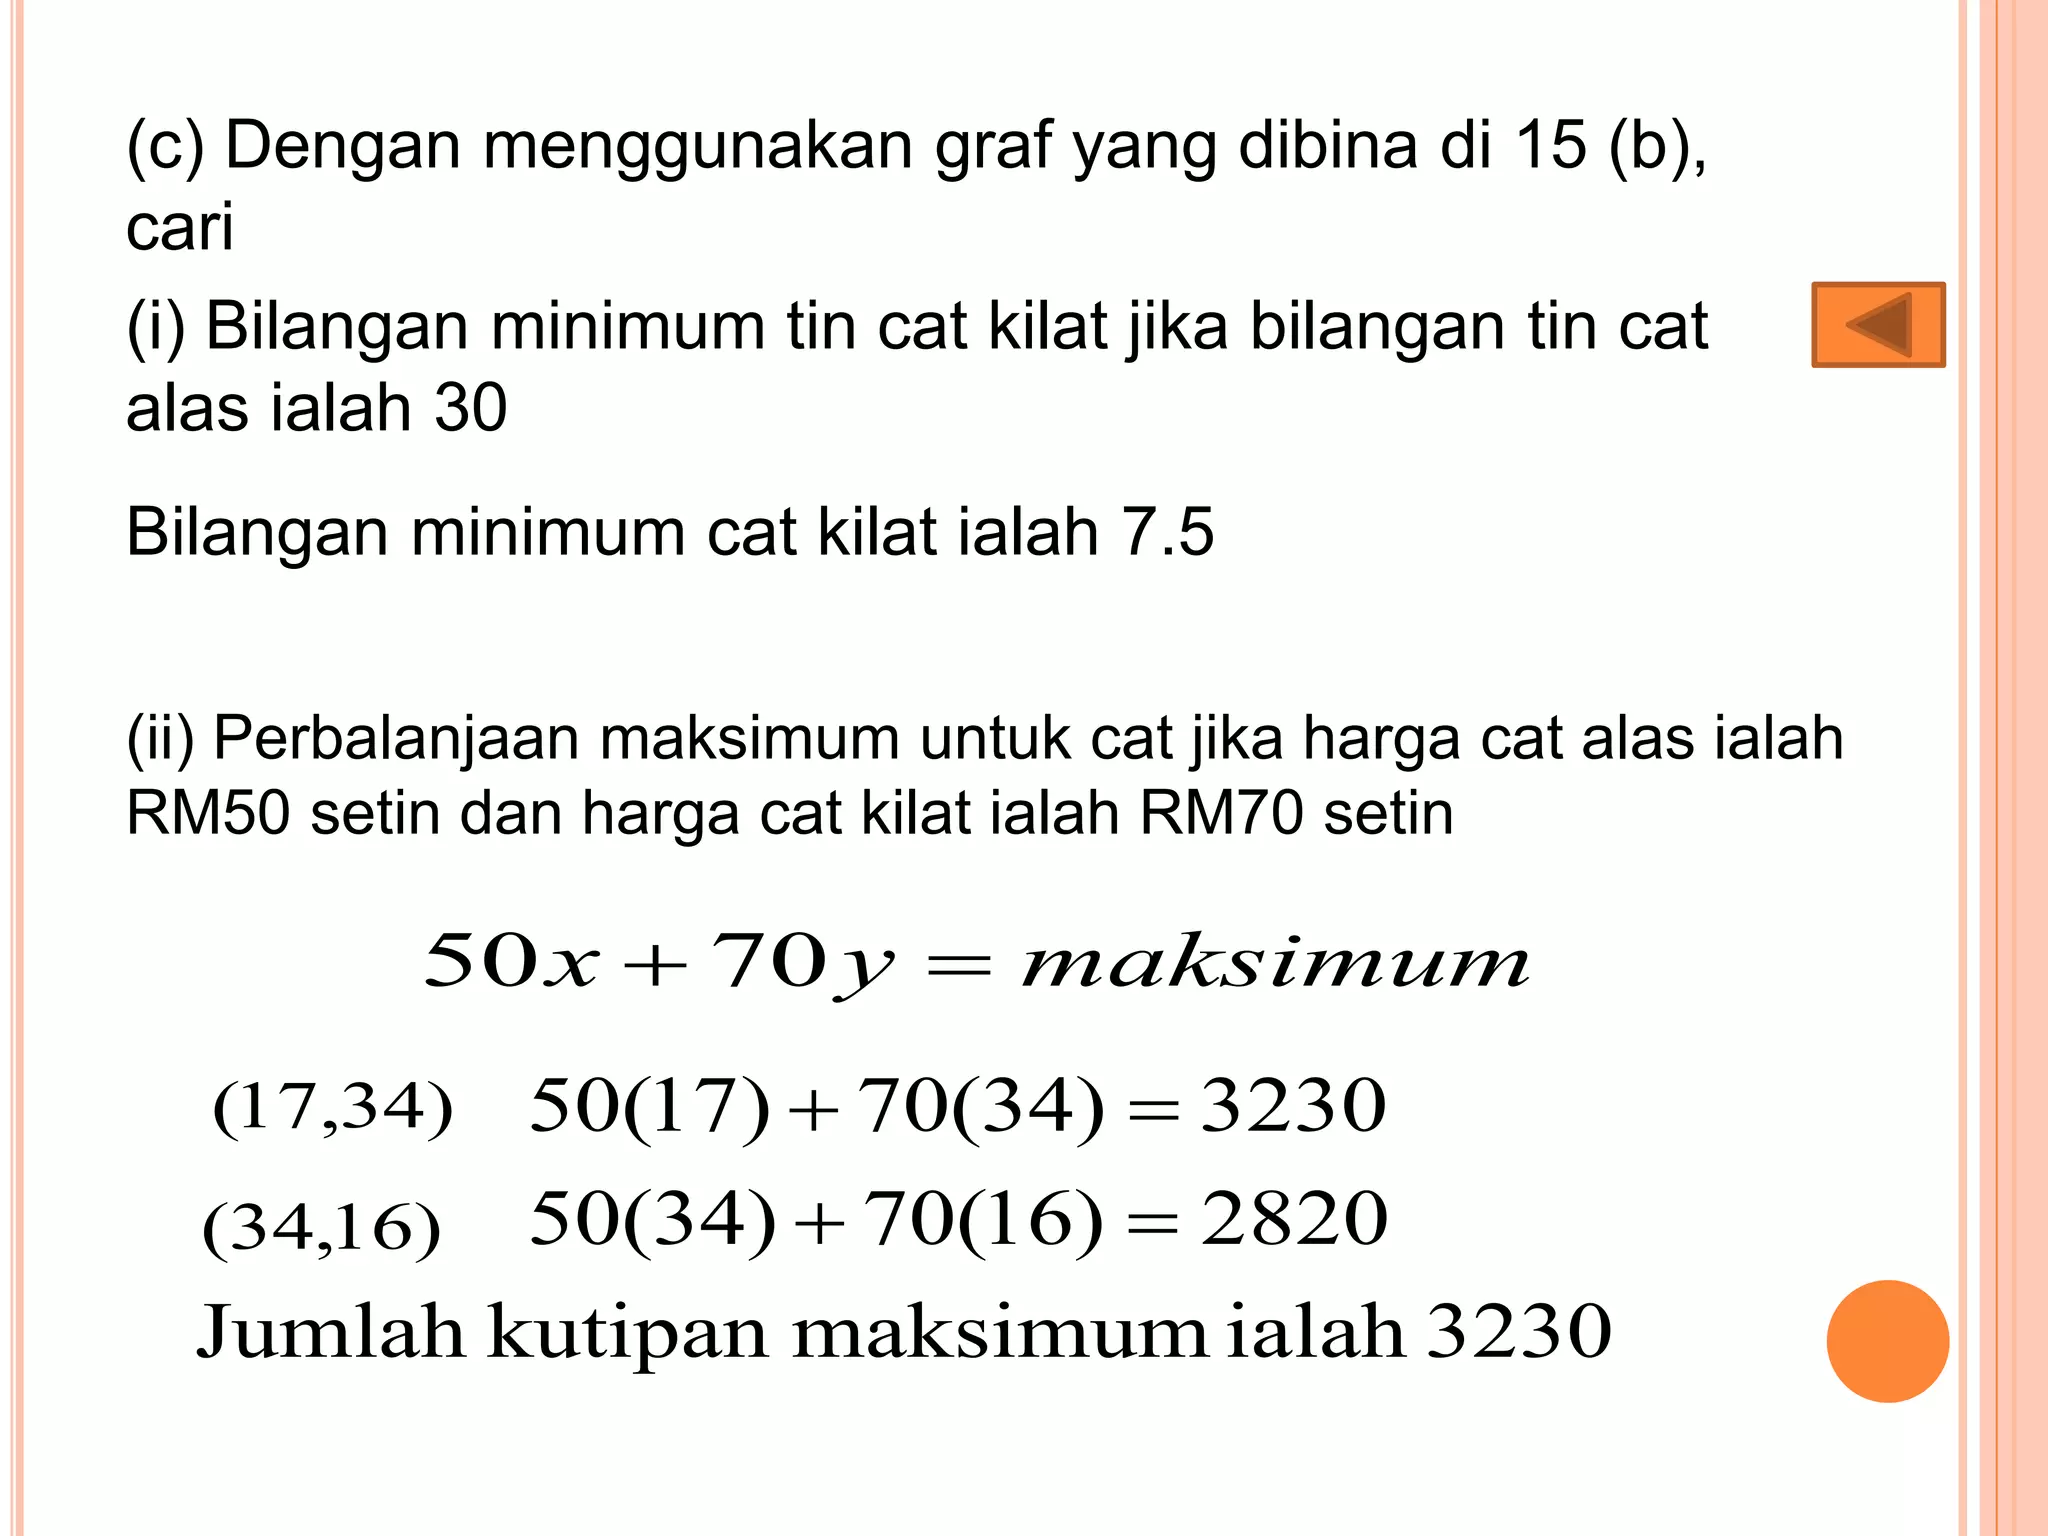
Challenges in production optimization, focusing on constraints and profitability maximization.
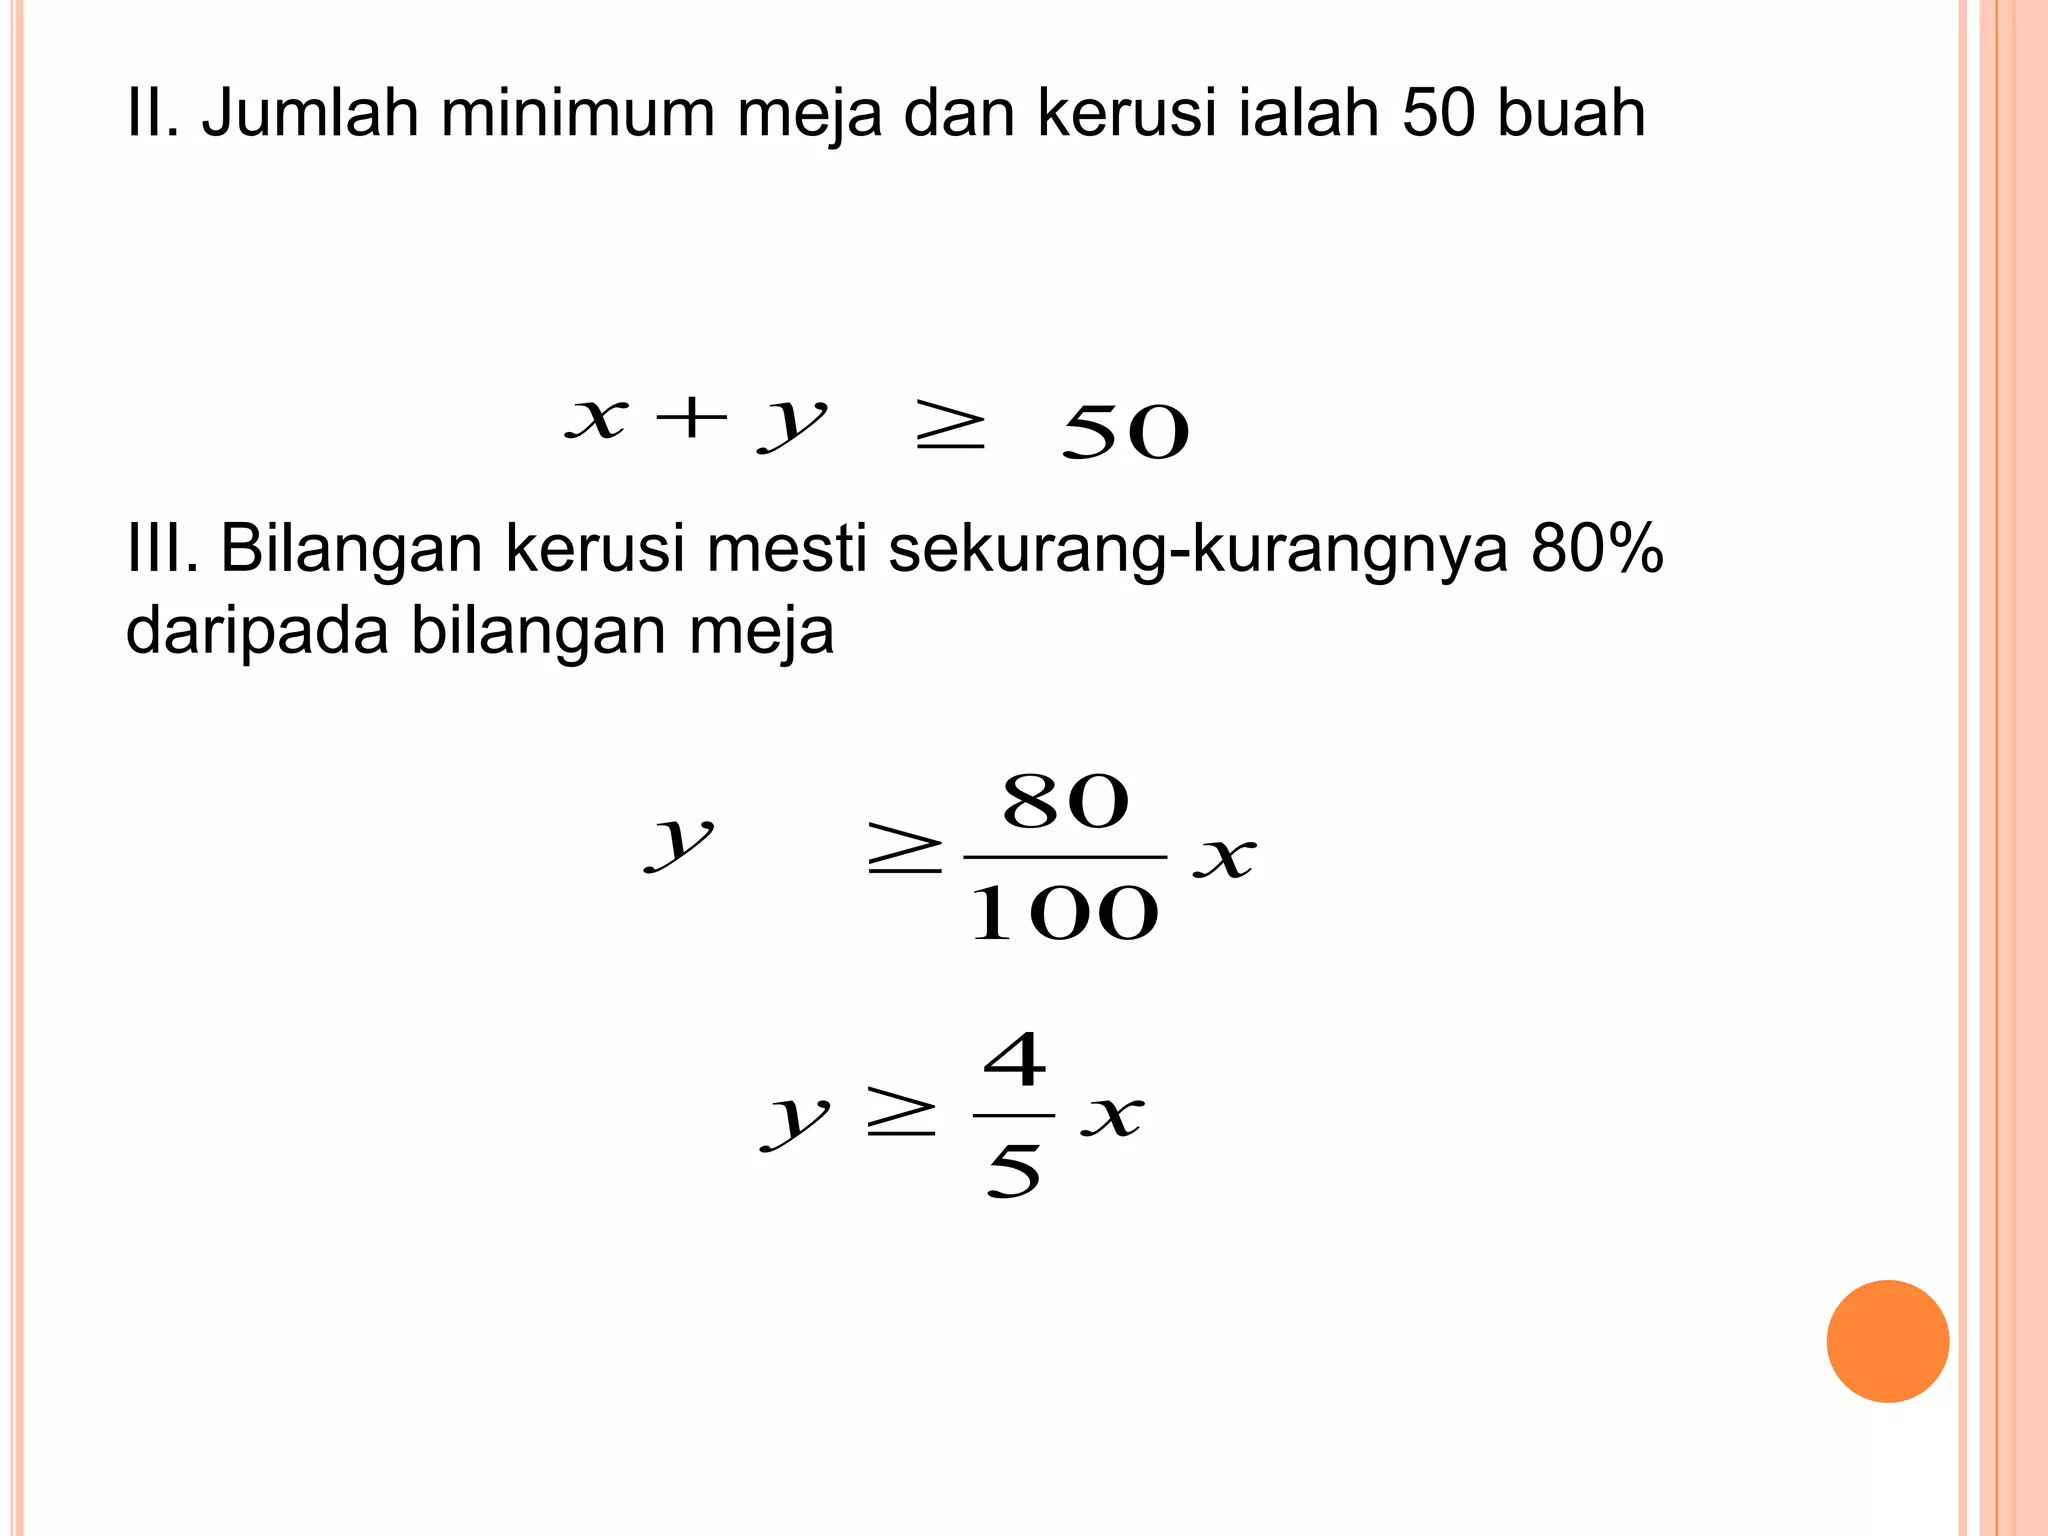
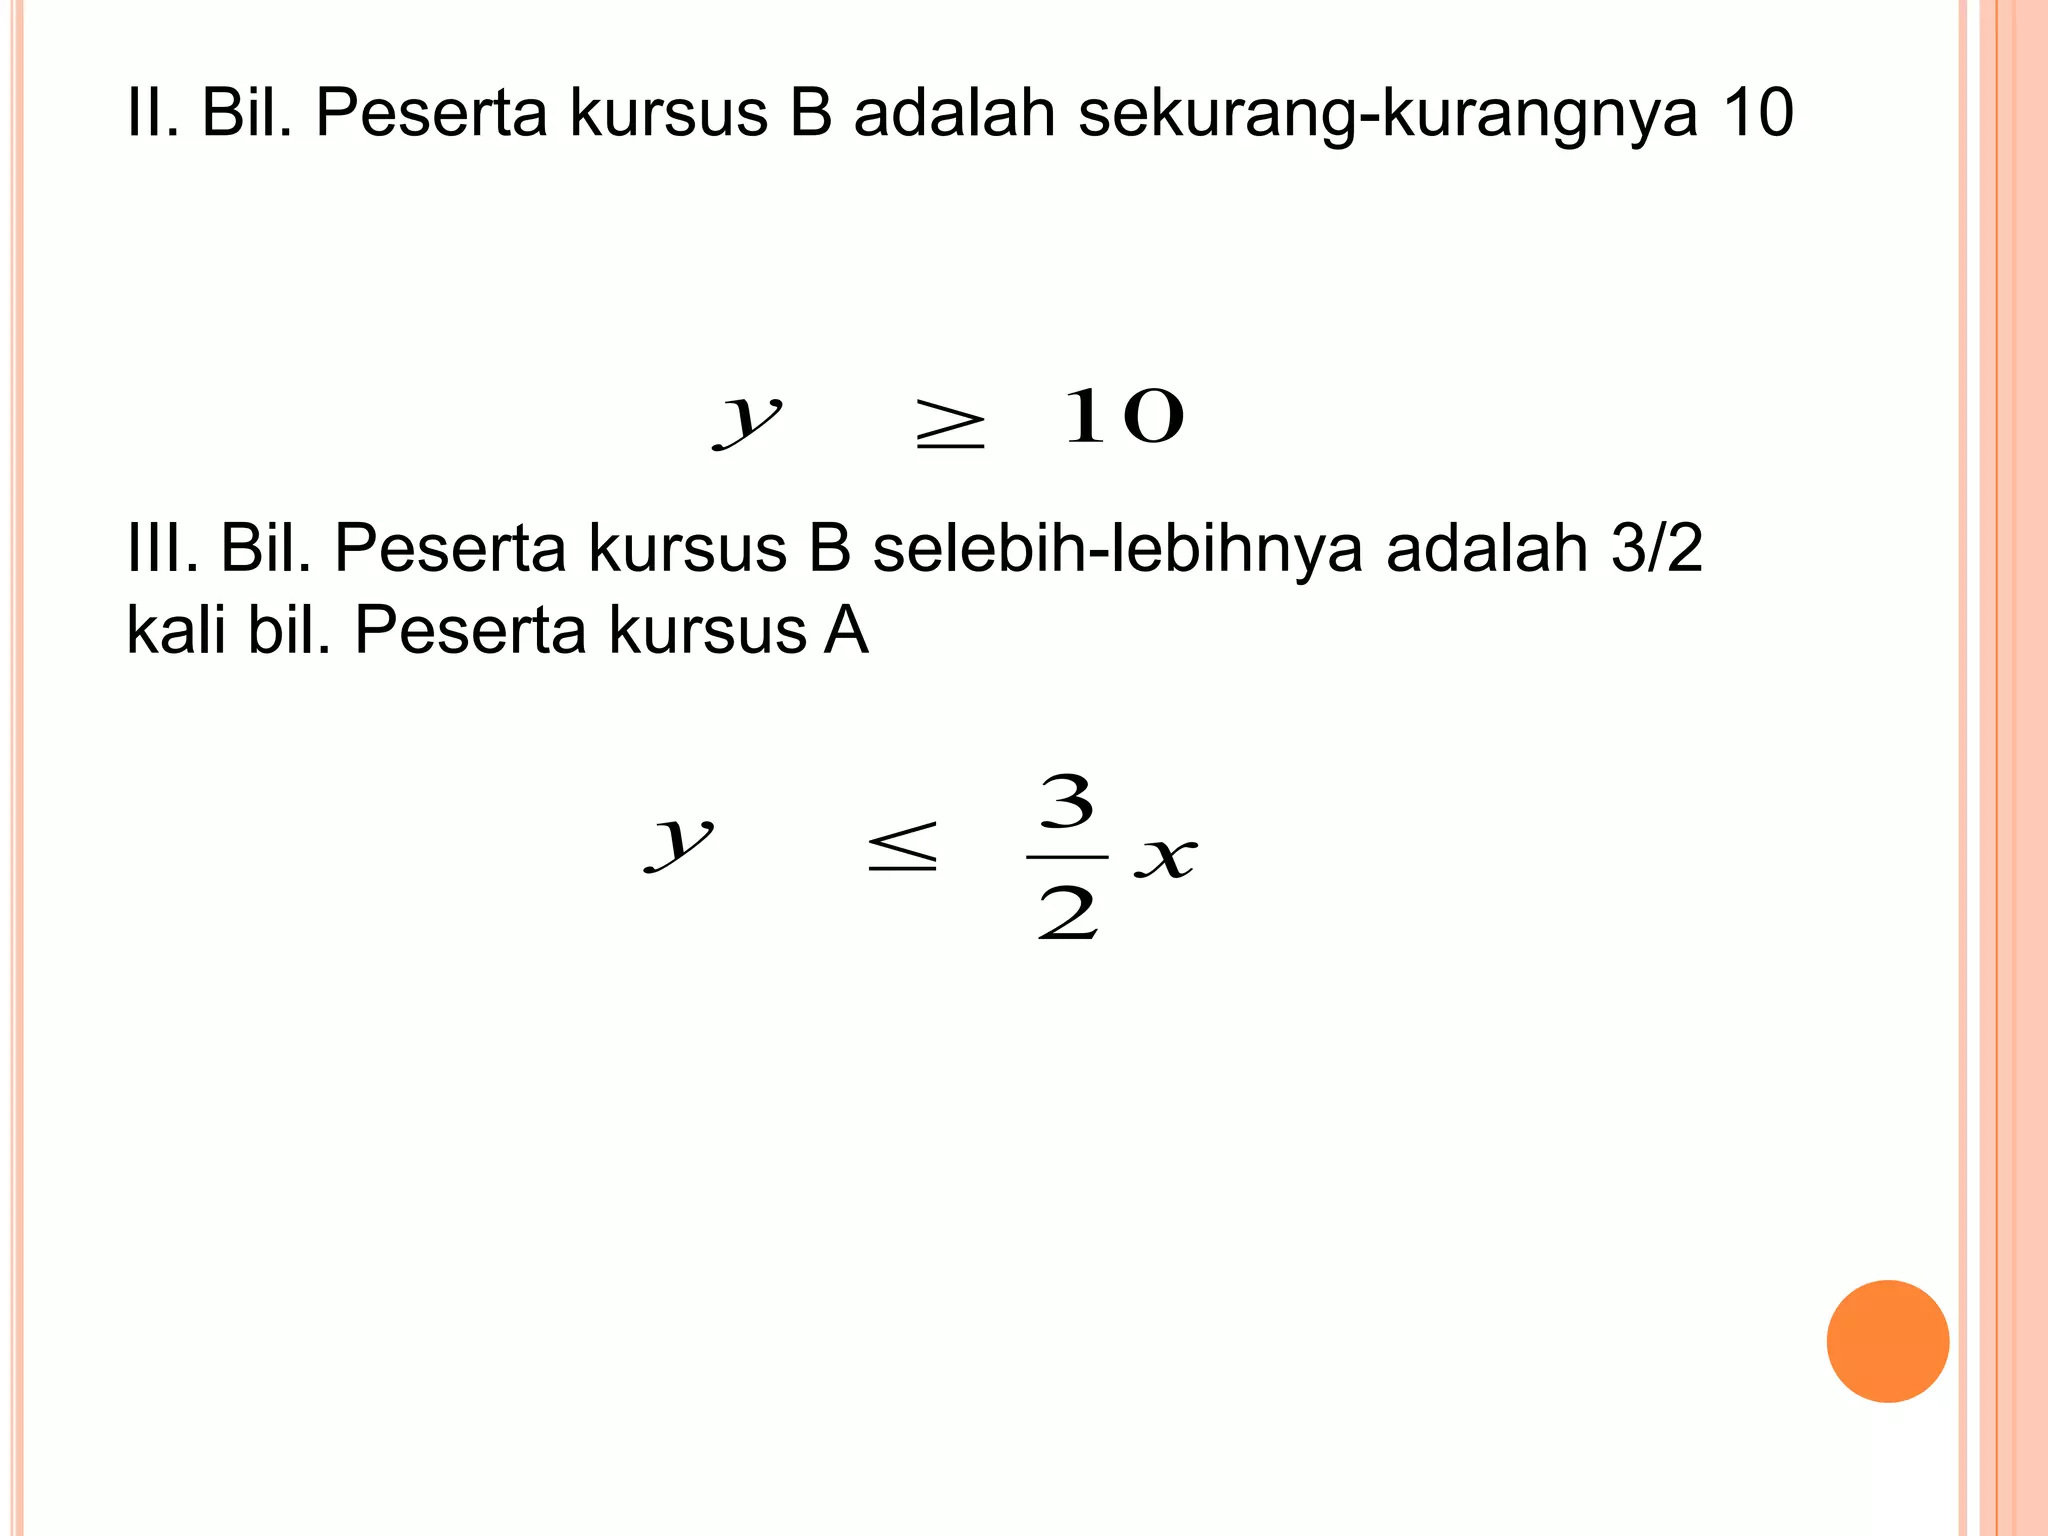
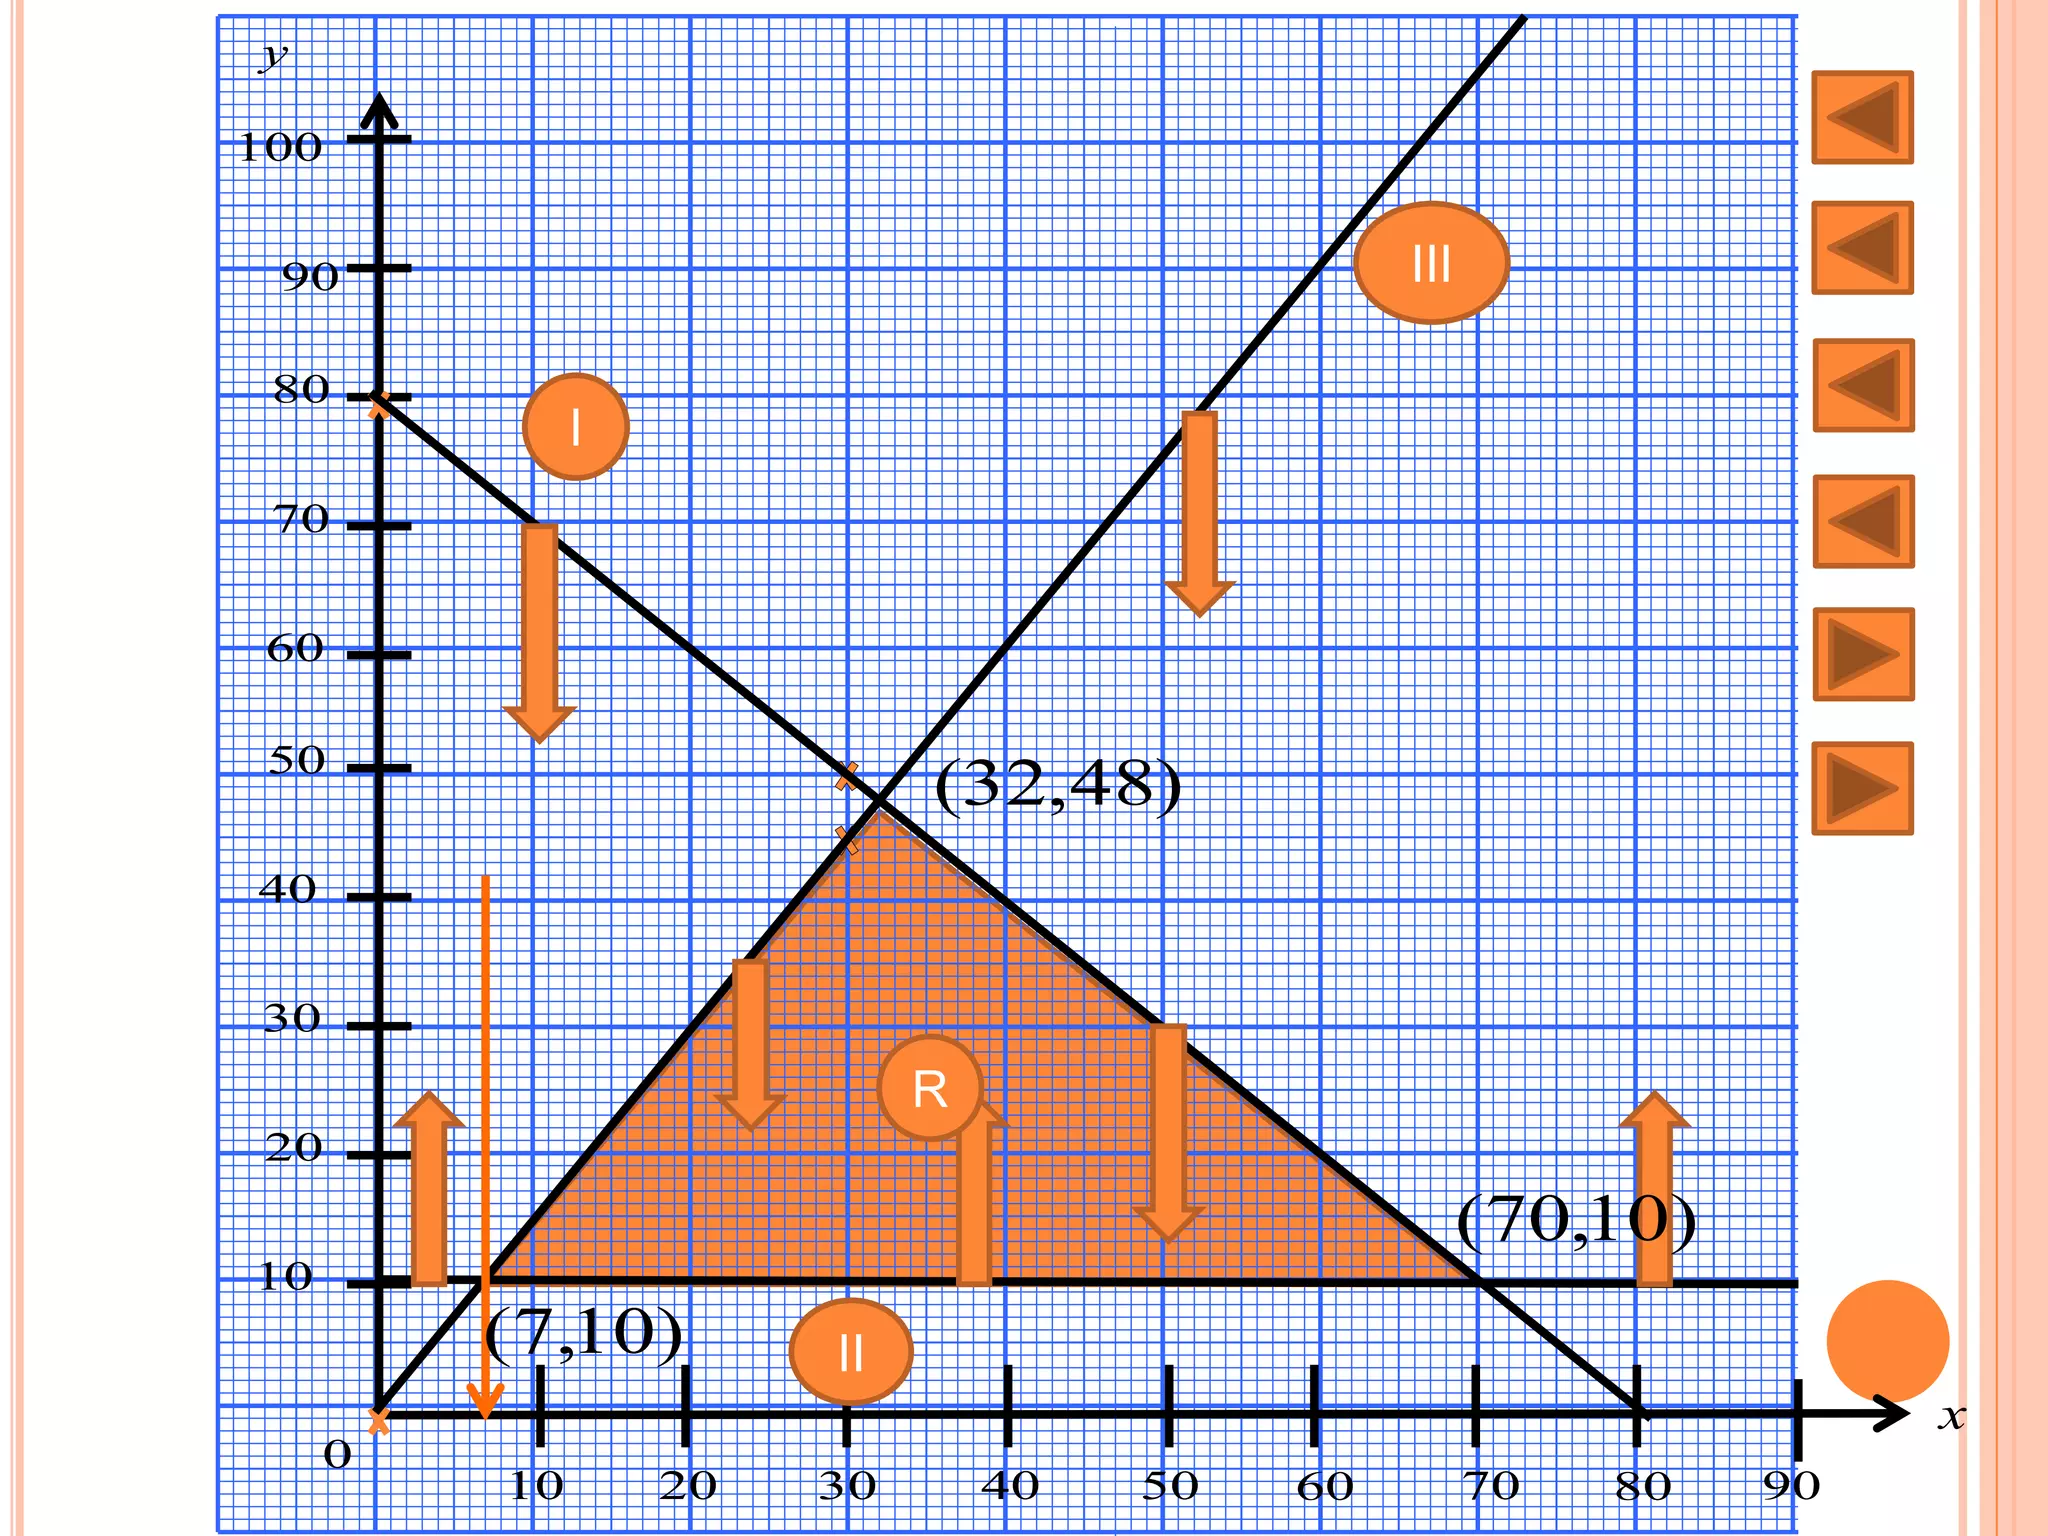
Resource allocation problems, emphasizing constraints in usage and cost optimizations.
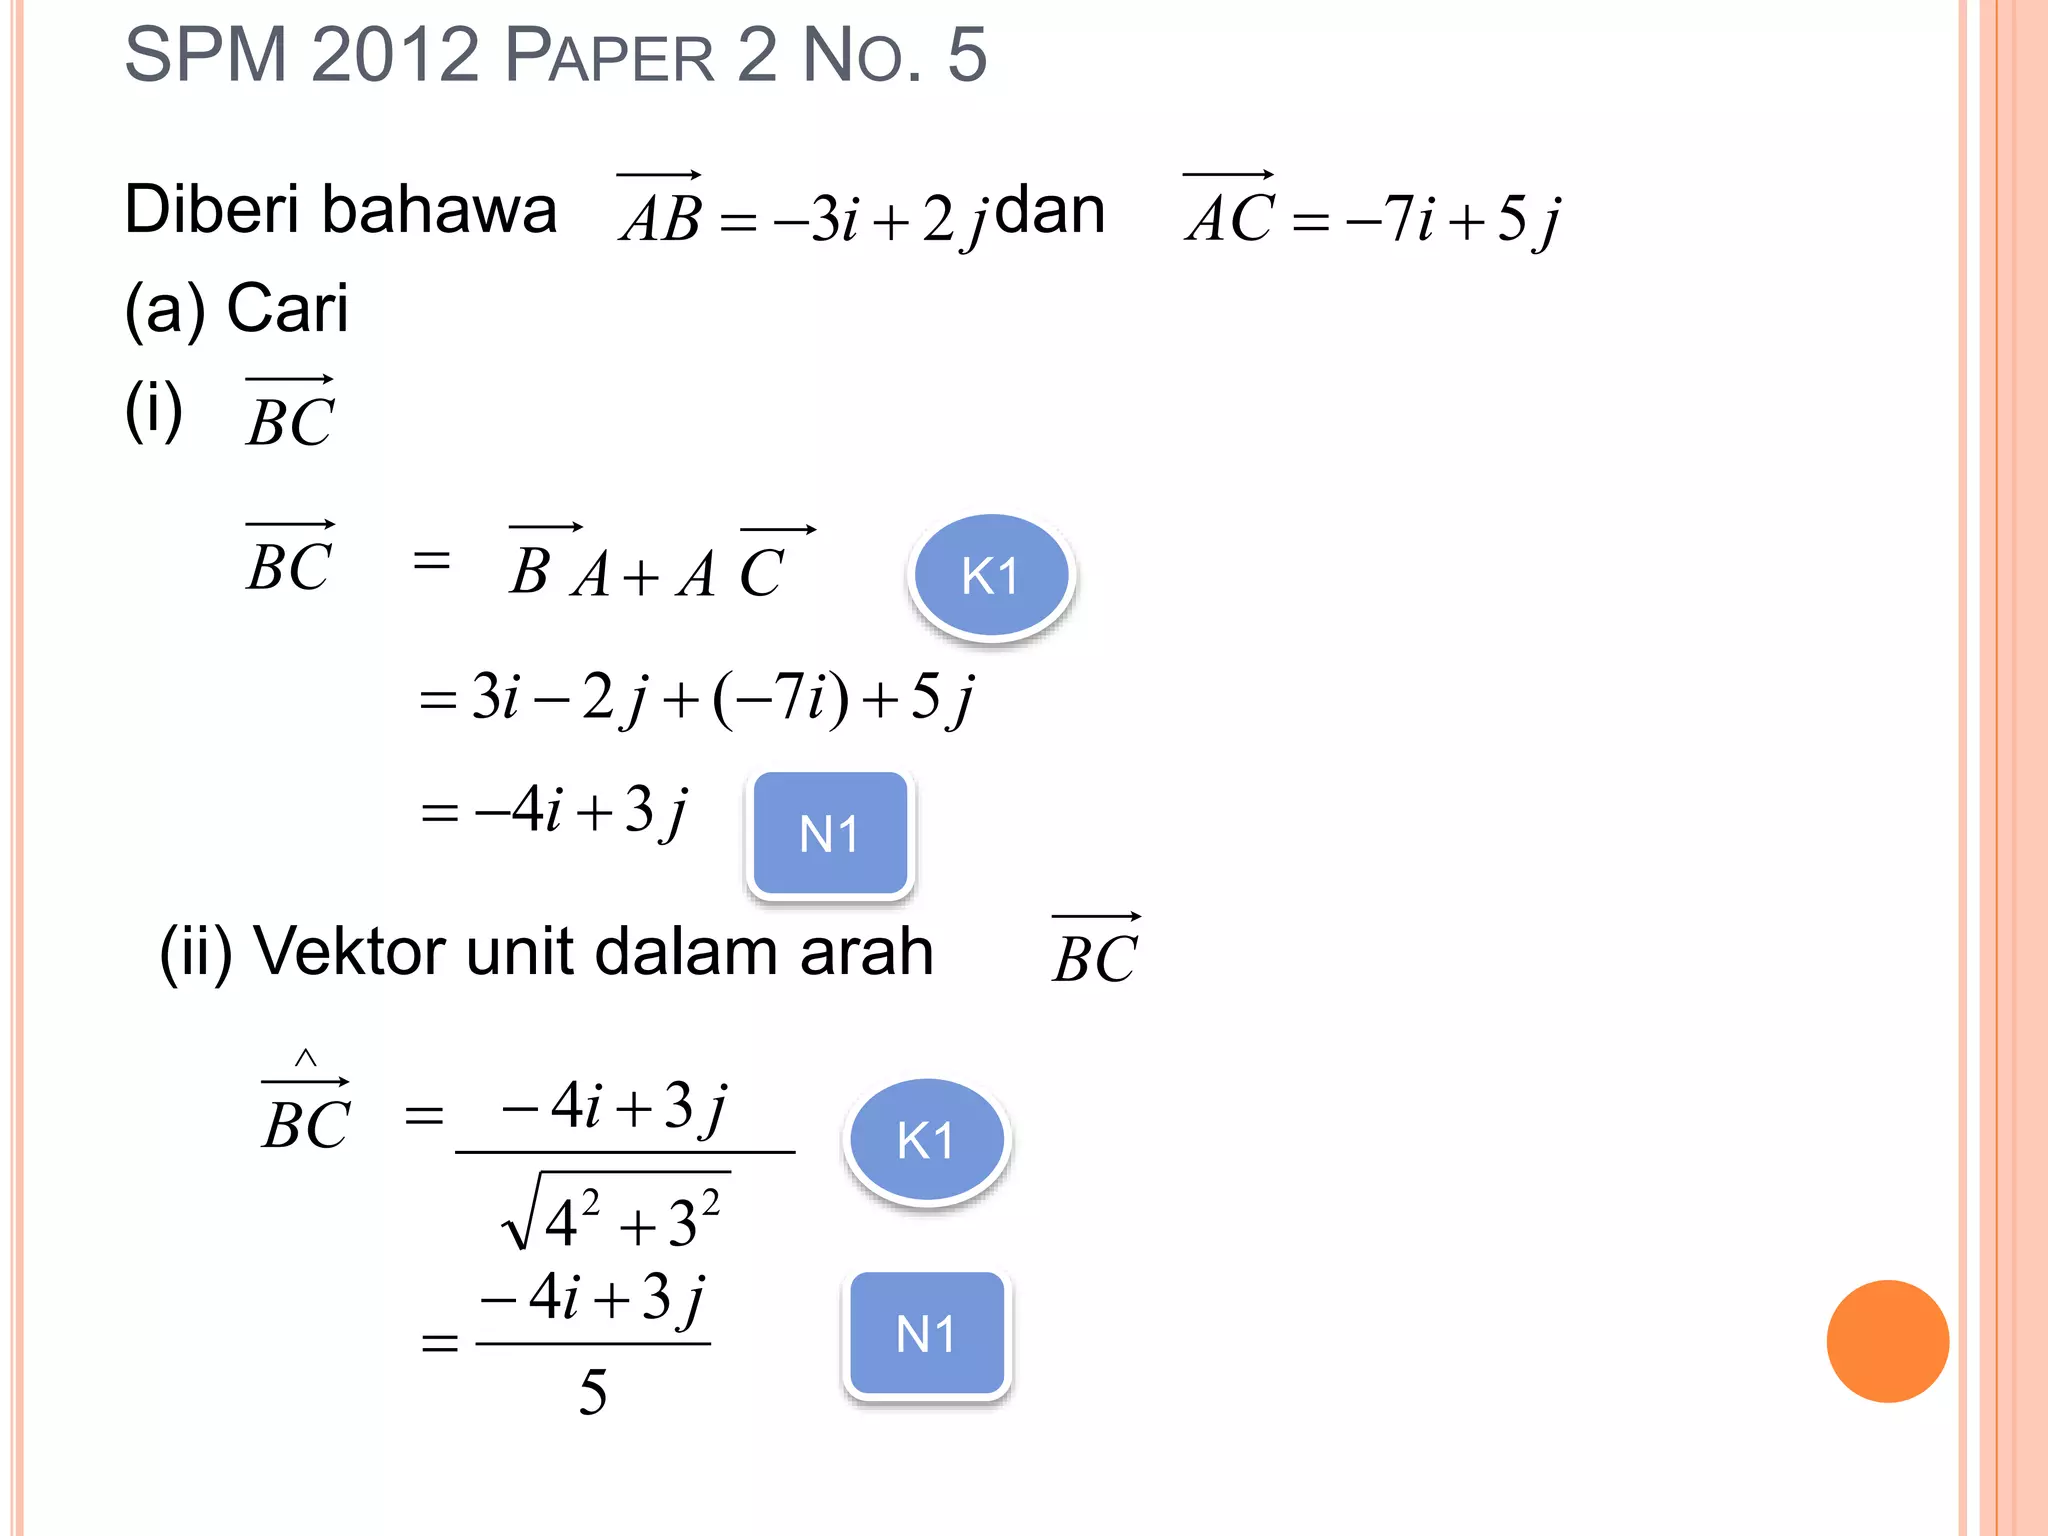
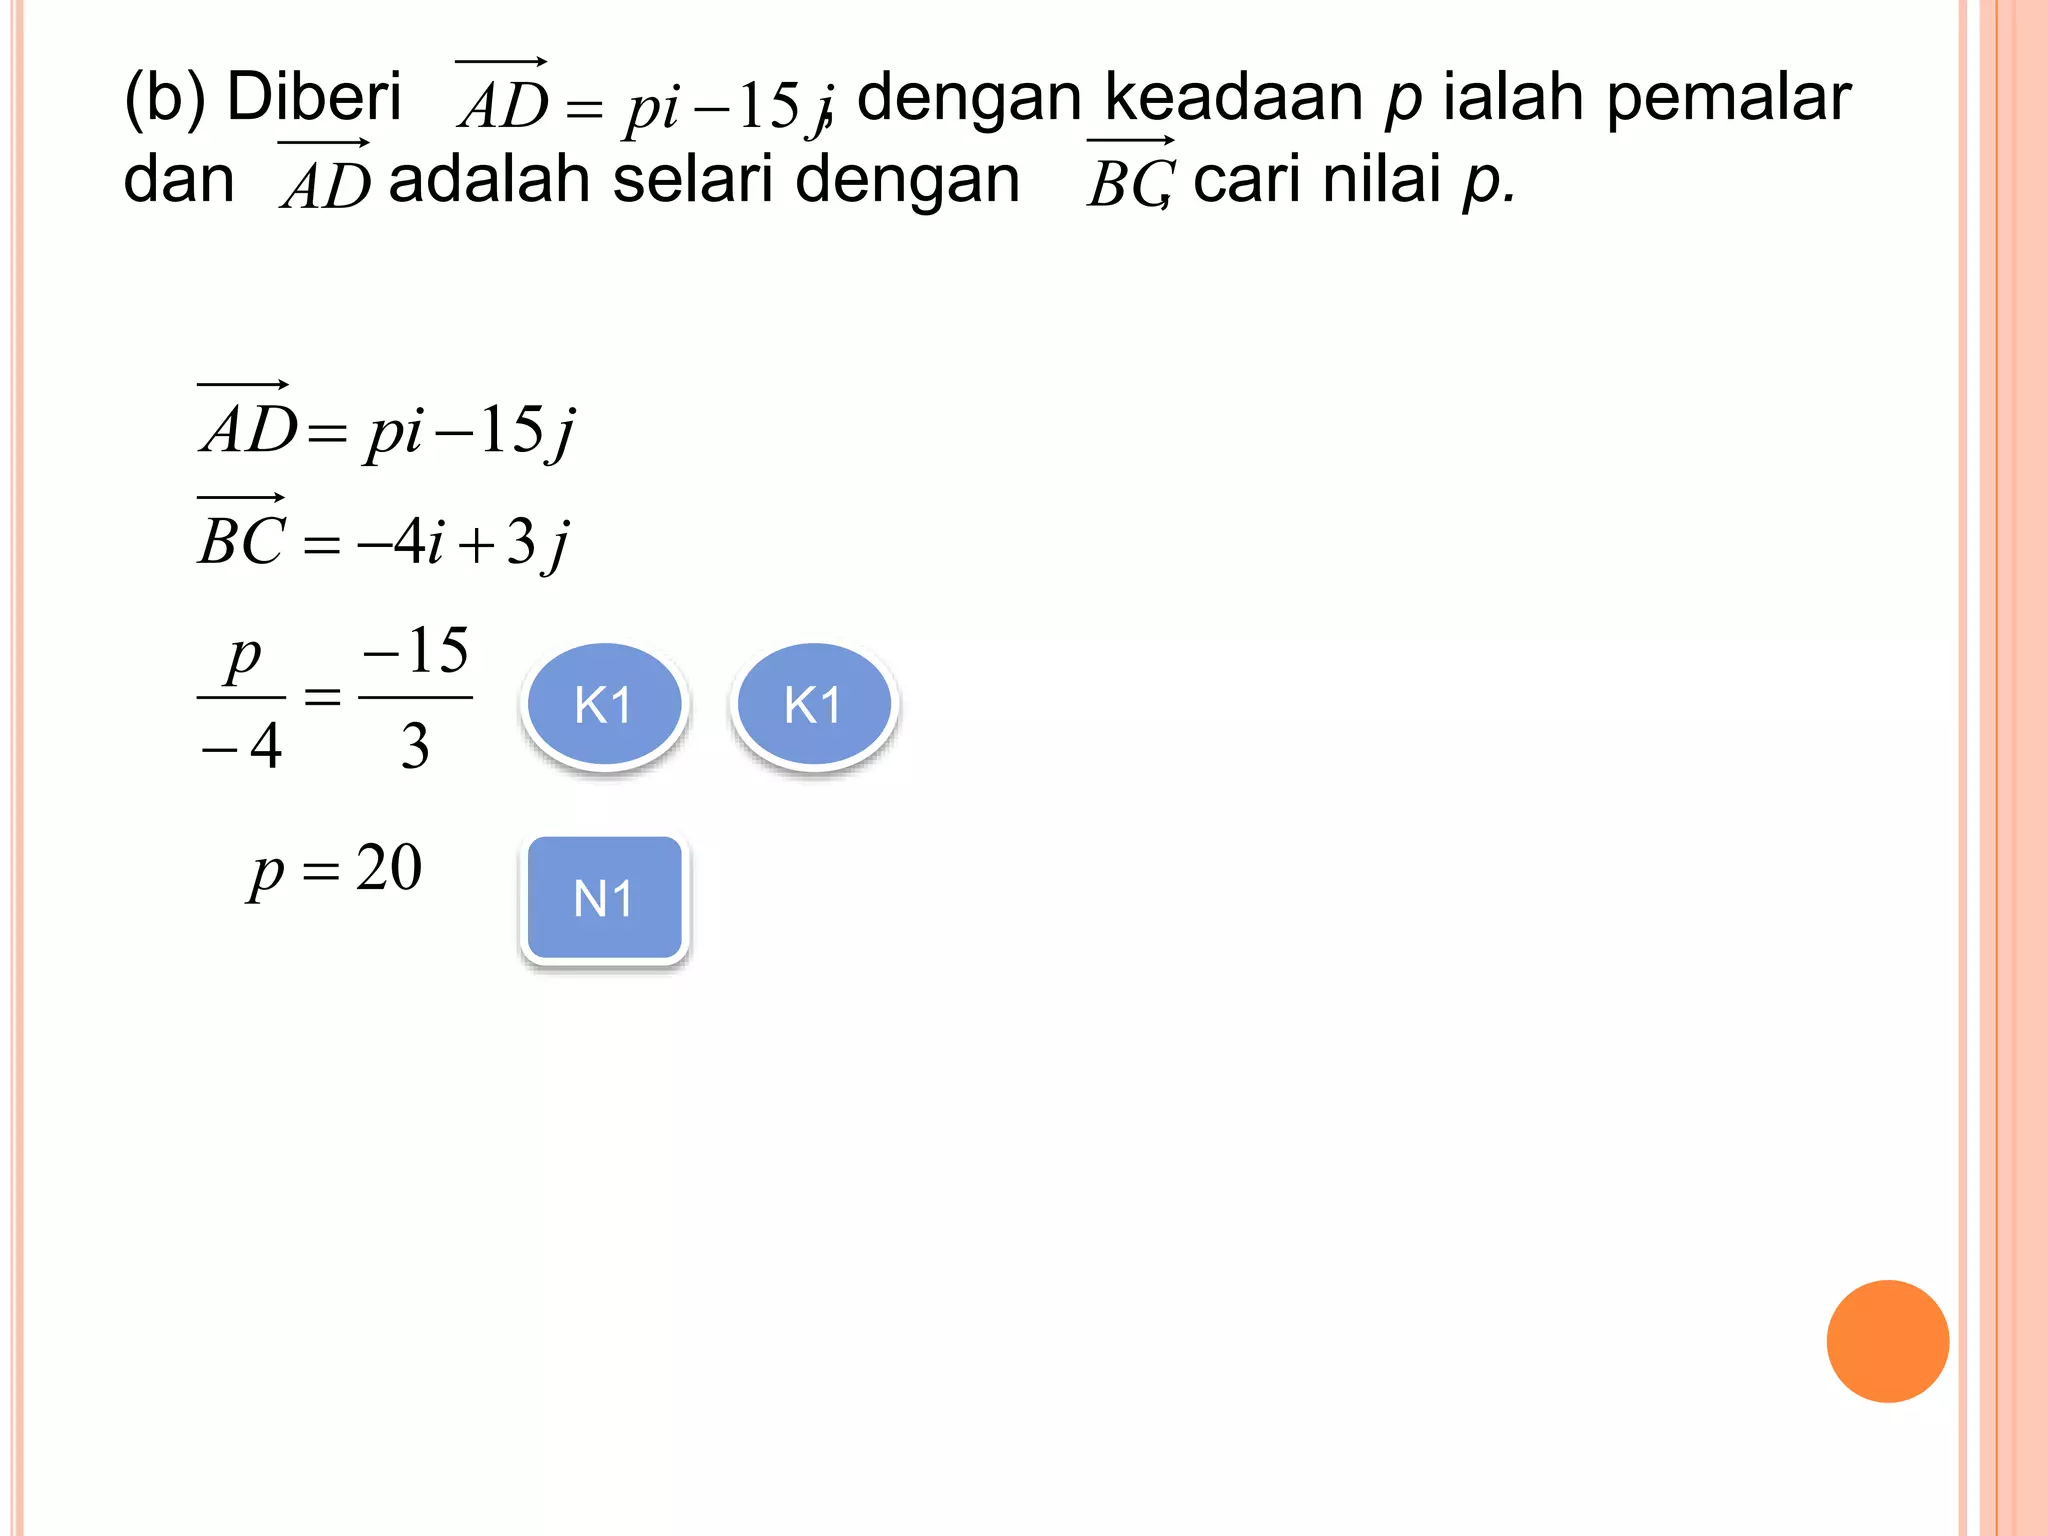
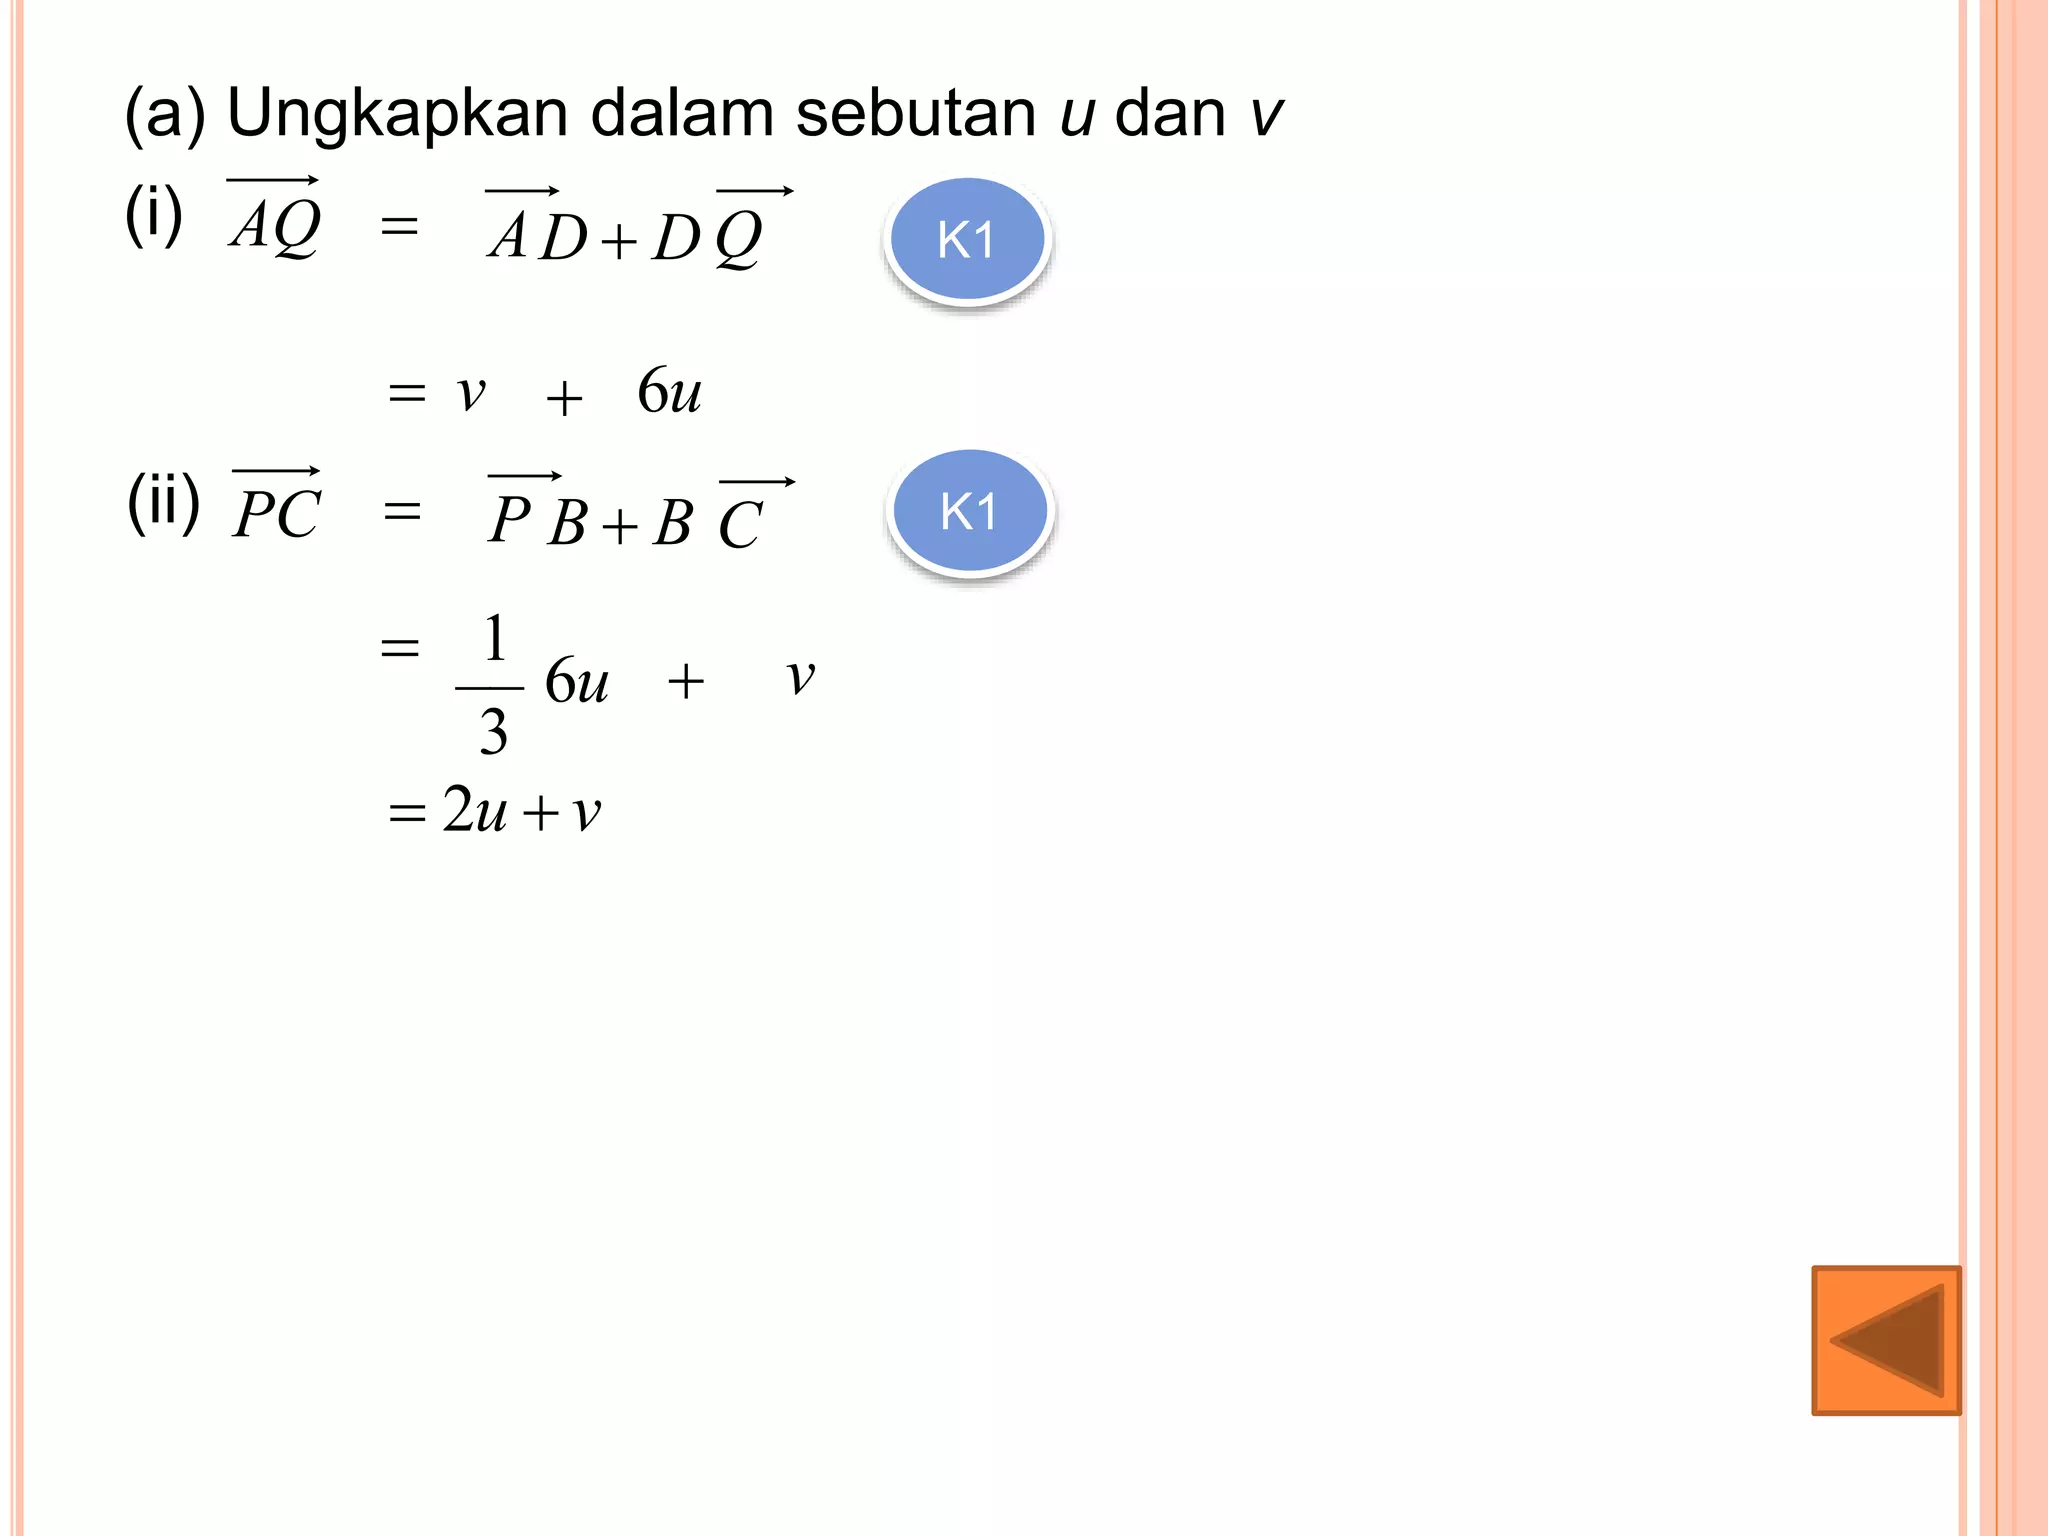
Vector analysis and applications to find directional components in geometrical configurations.
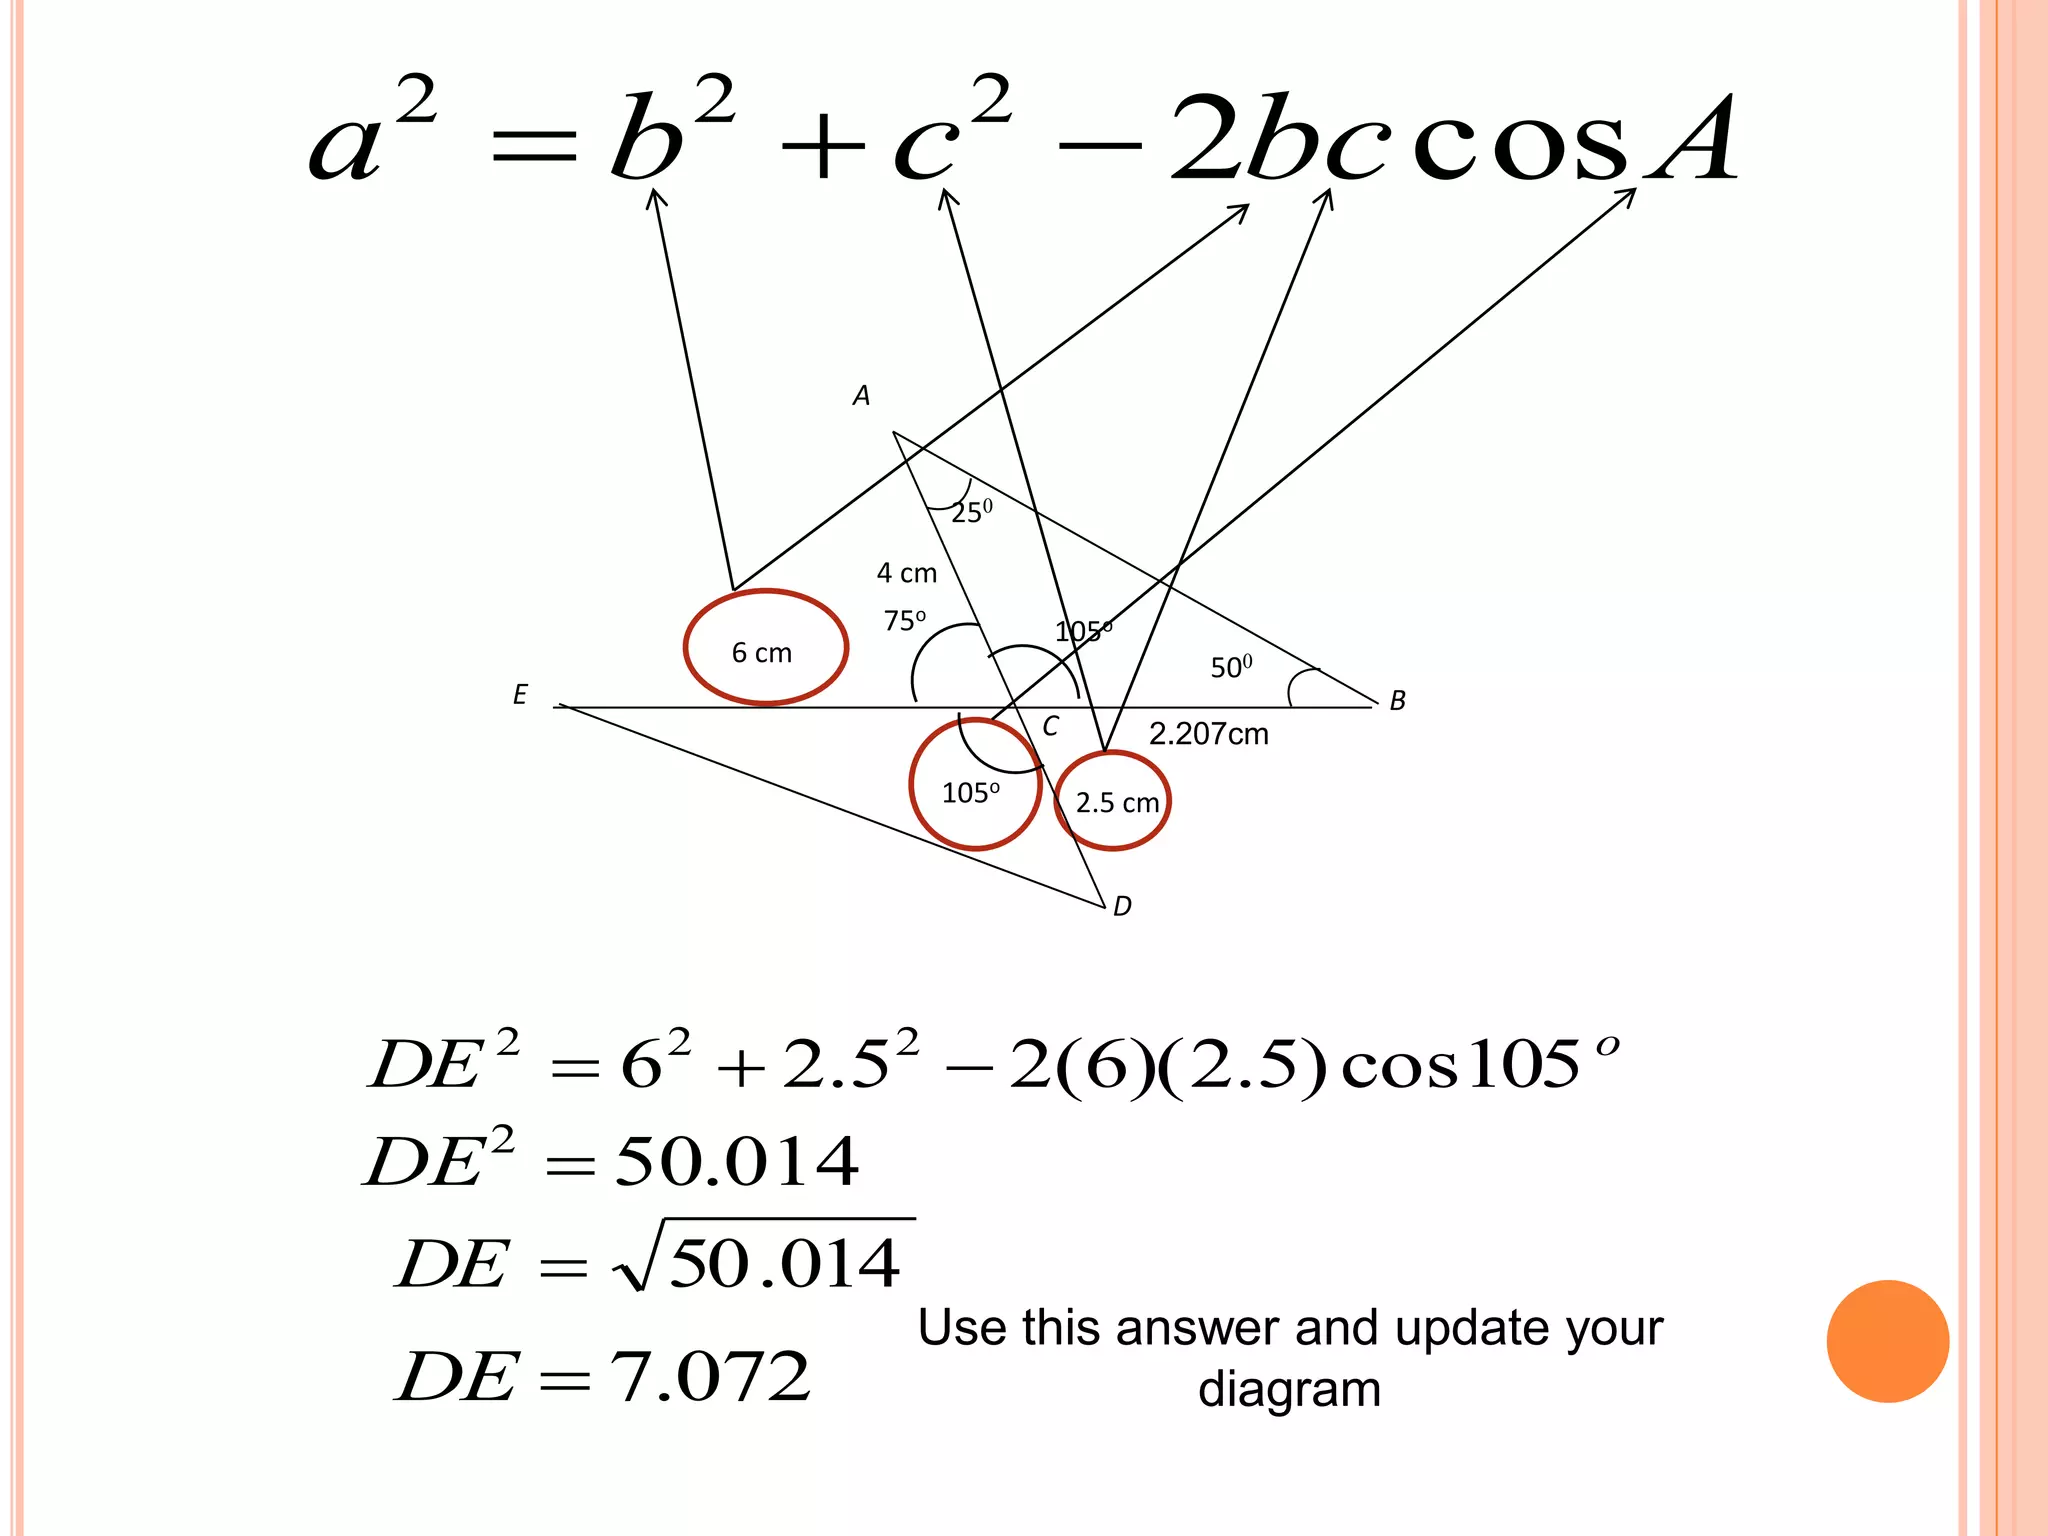
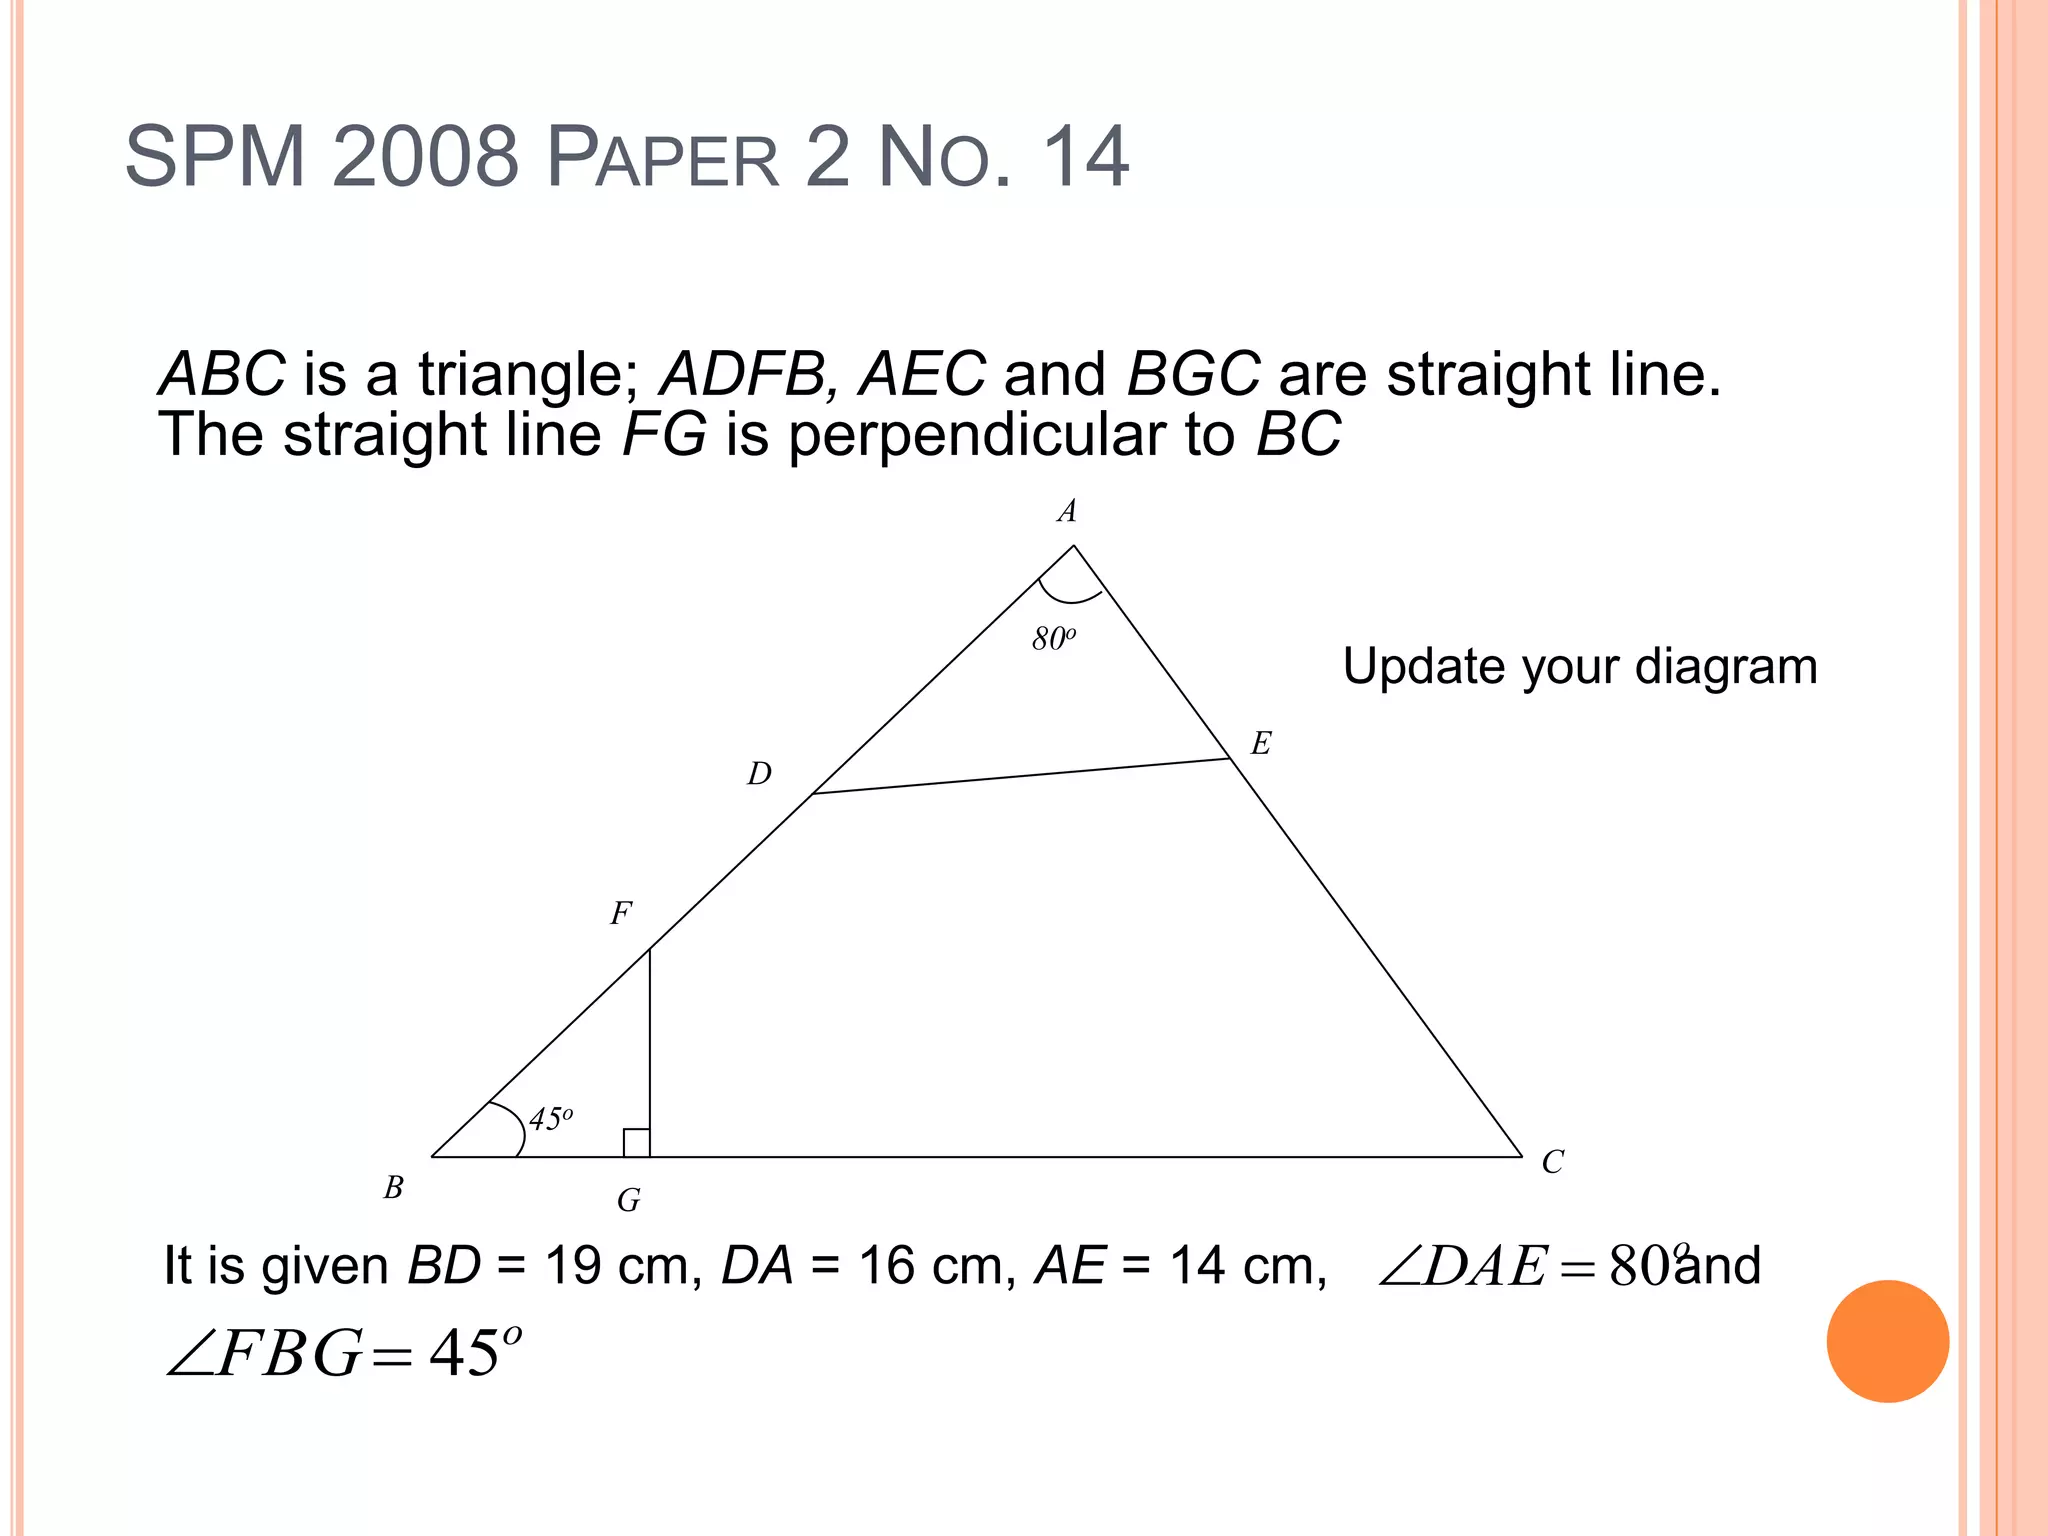
Triangles and angles problems utilizing sine and cosine rules in a systematic approach.
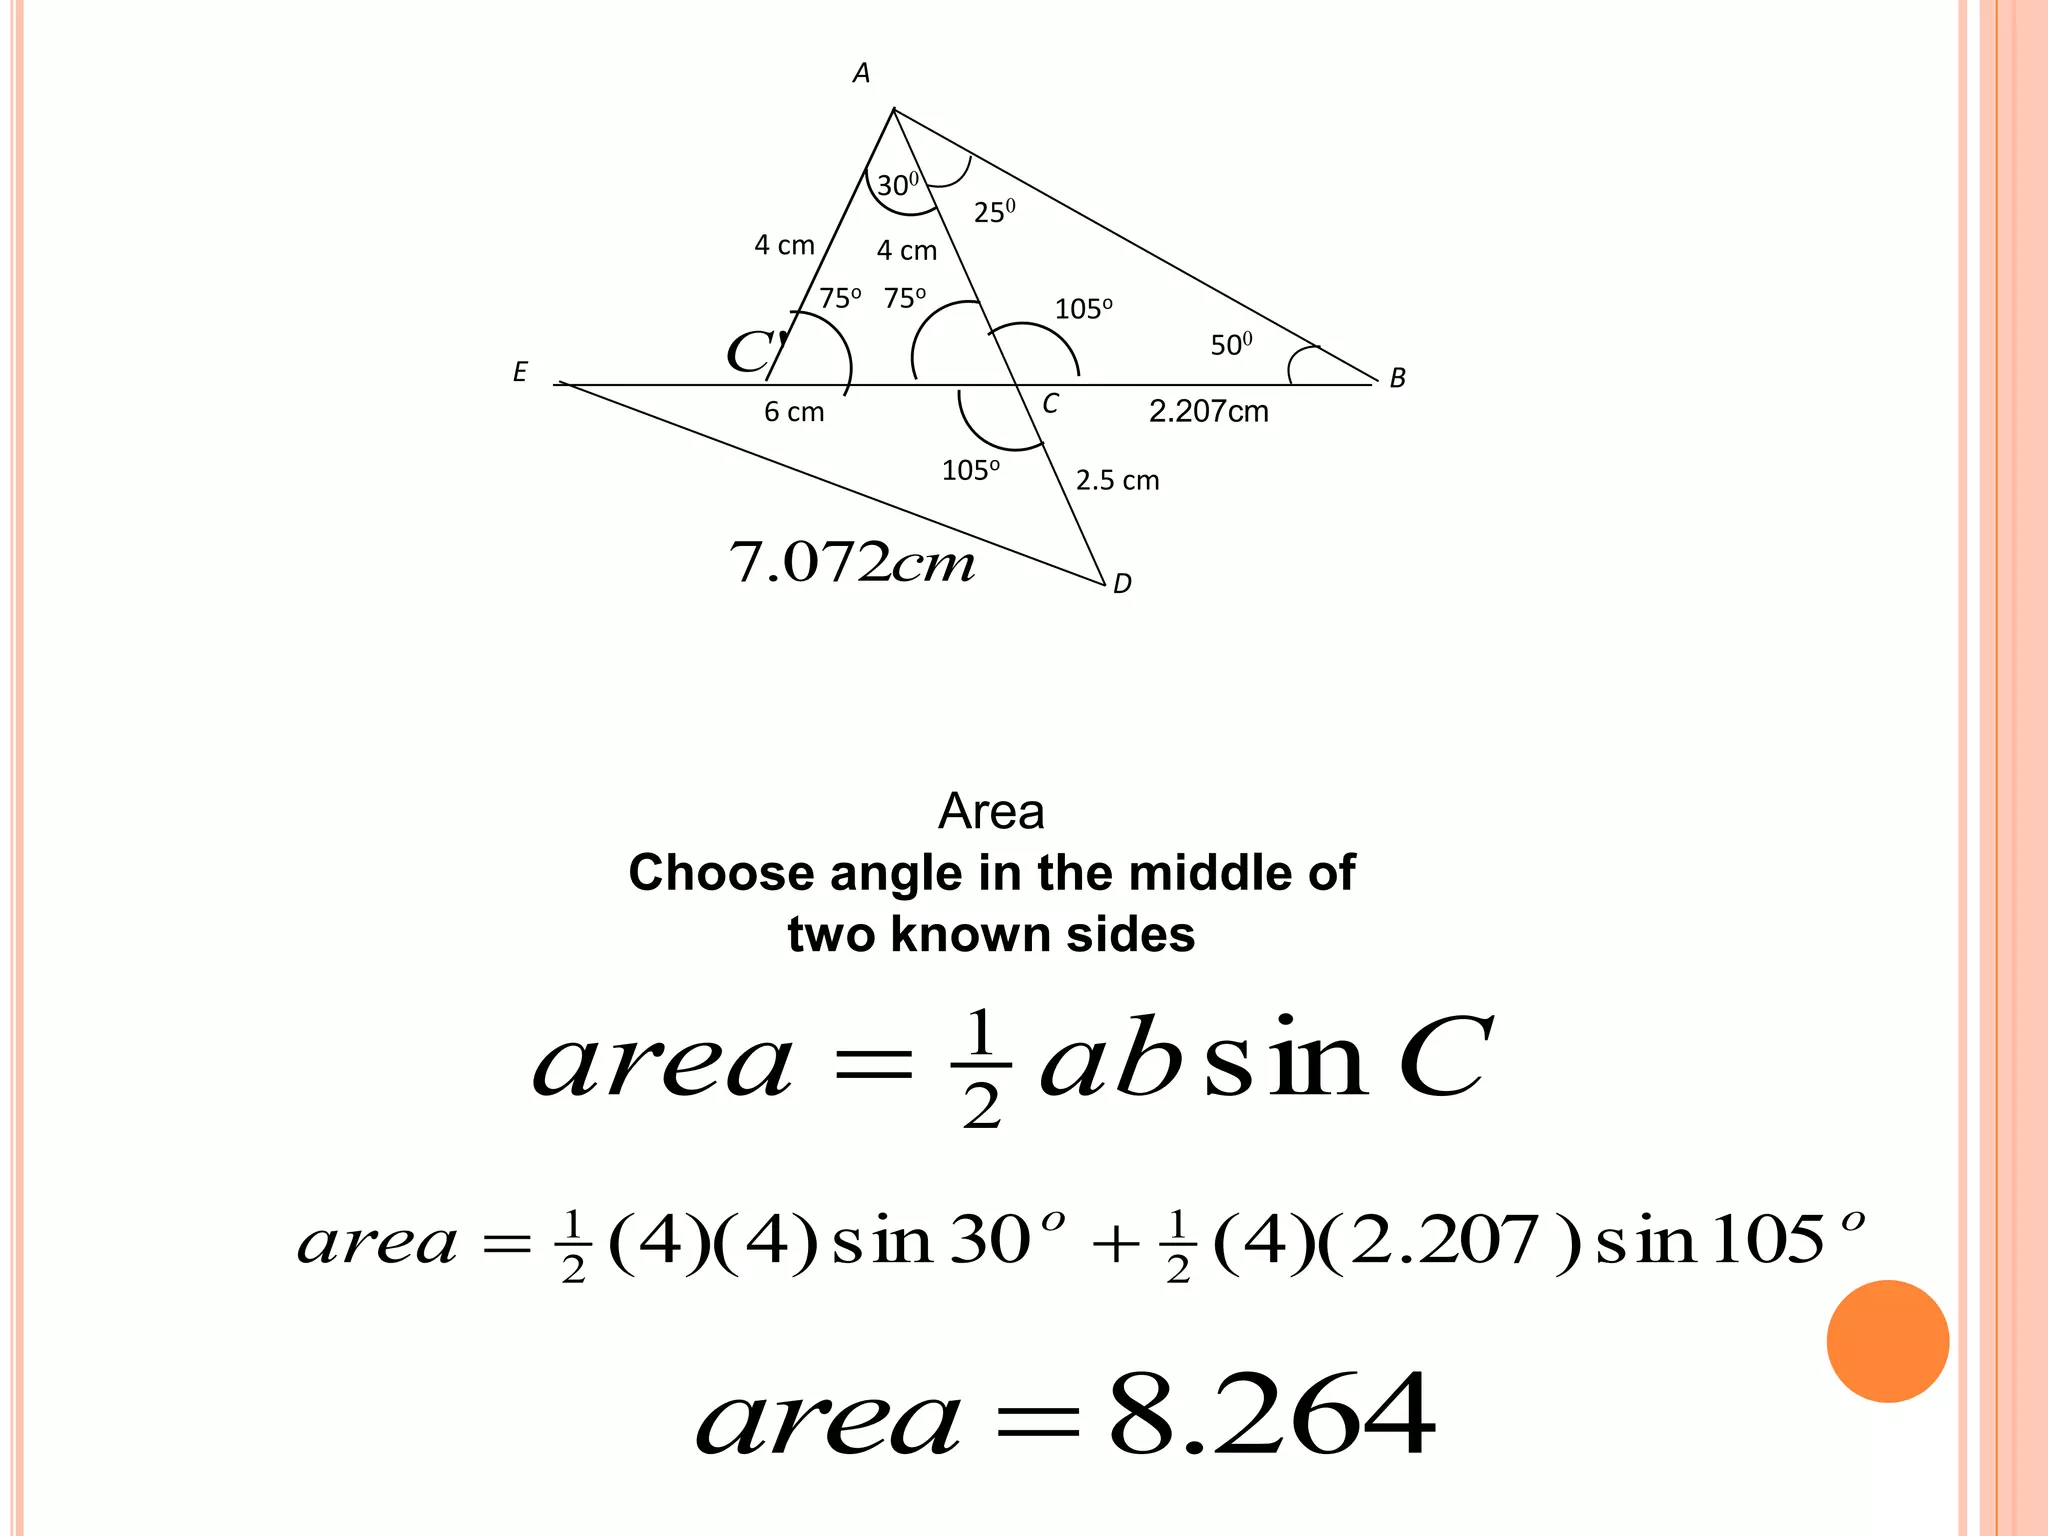
Applications of triangle area formulas using known angles and sides for various geometric shapes.
Exploration of price indices and changes in expenditure using formulas and historical comparisons.
Analysis of expenditures and indices using formulas for weighted averages and price adjustments.


