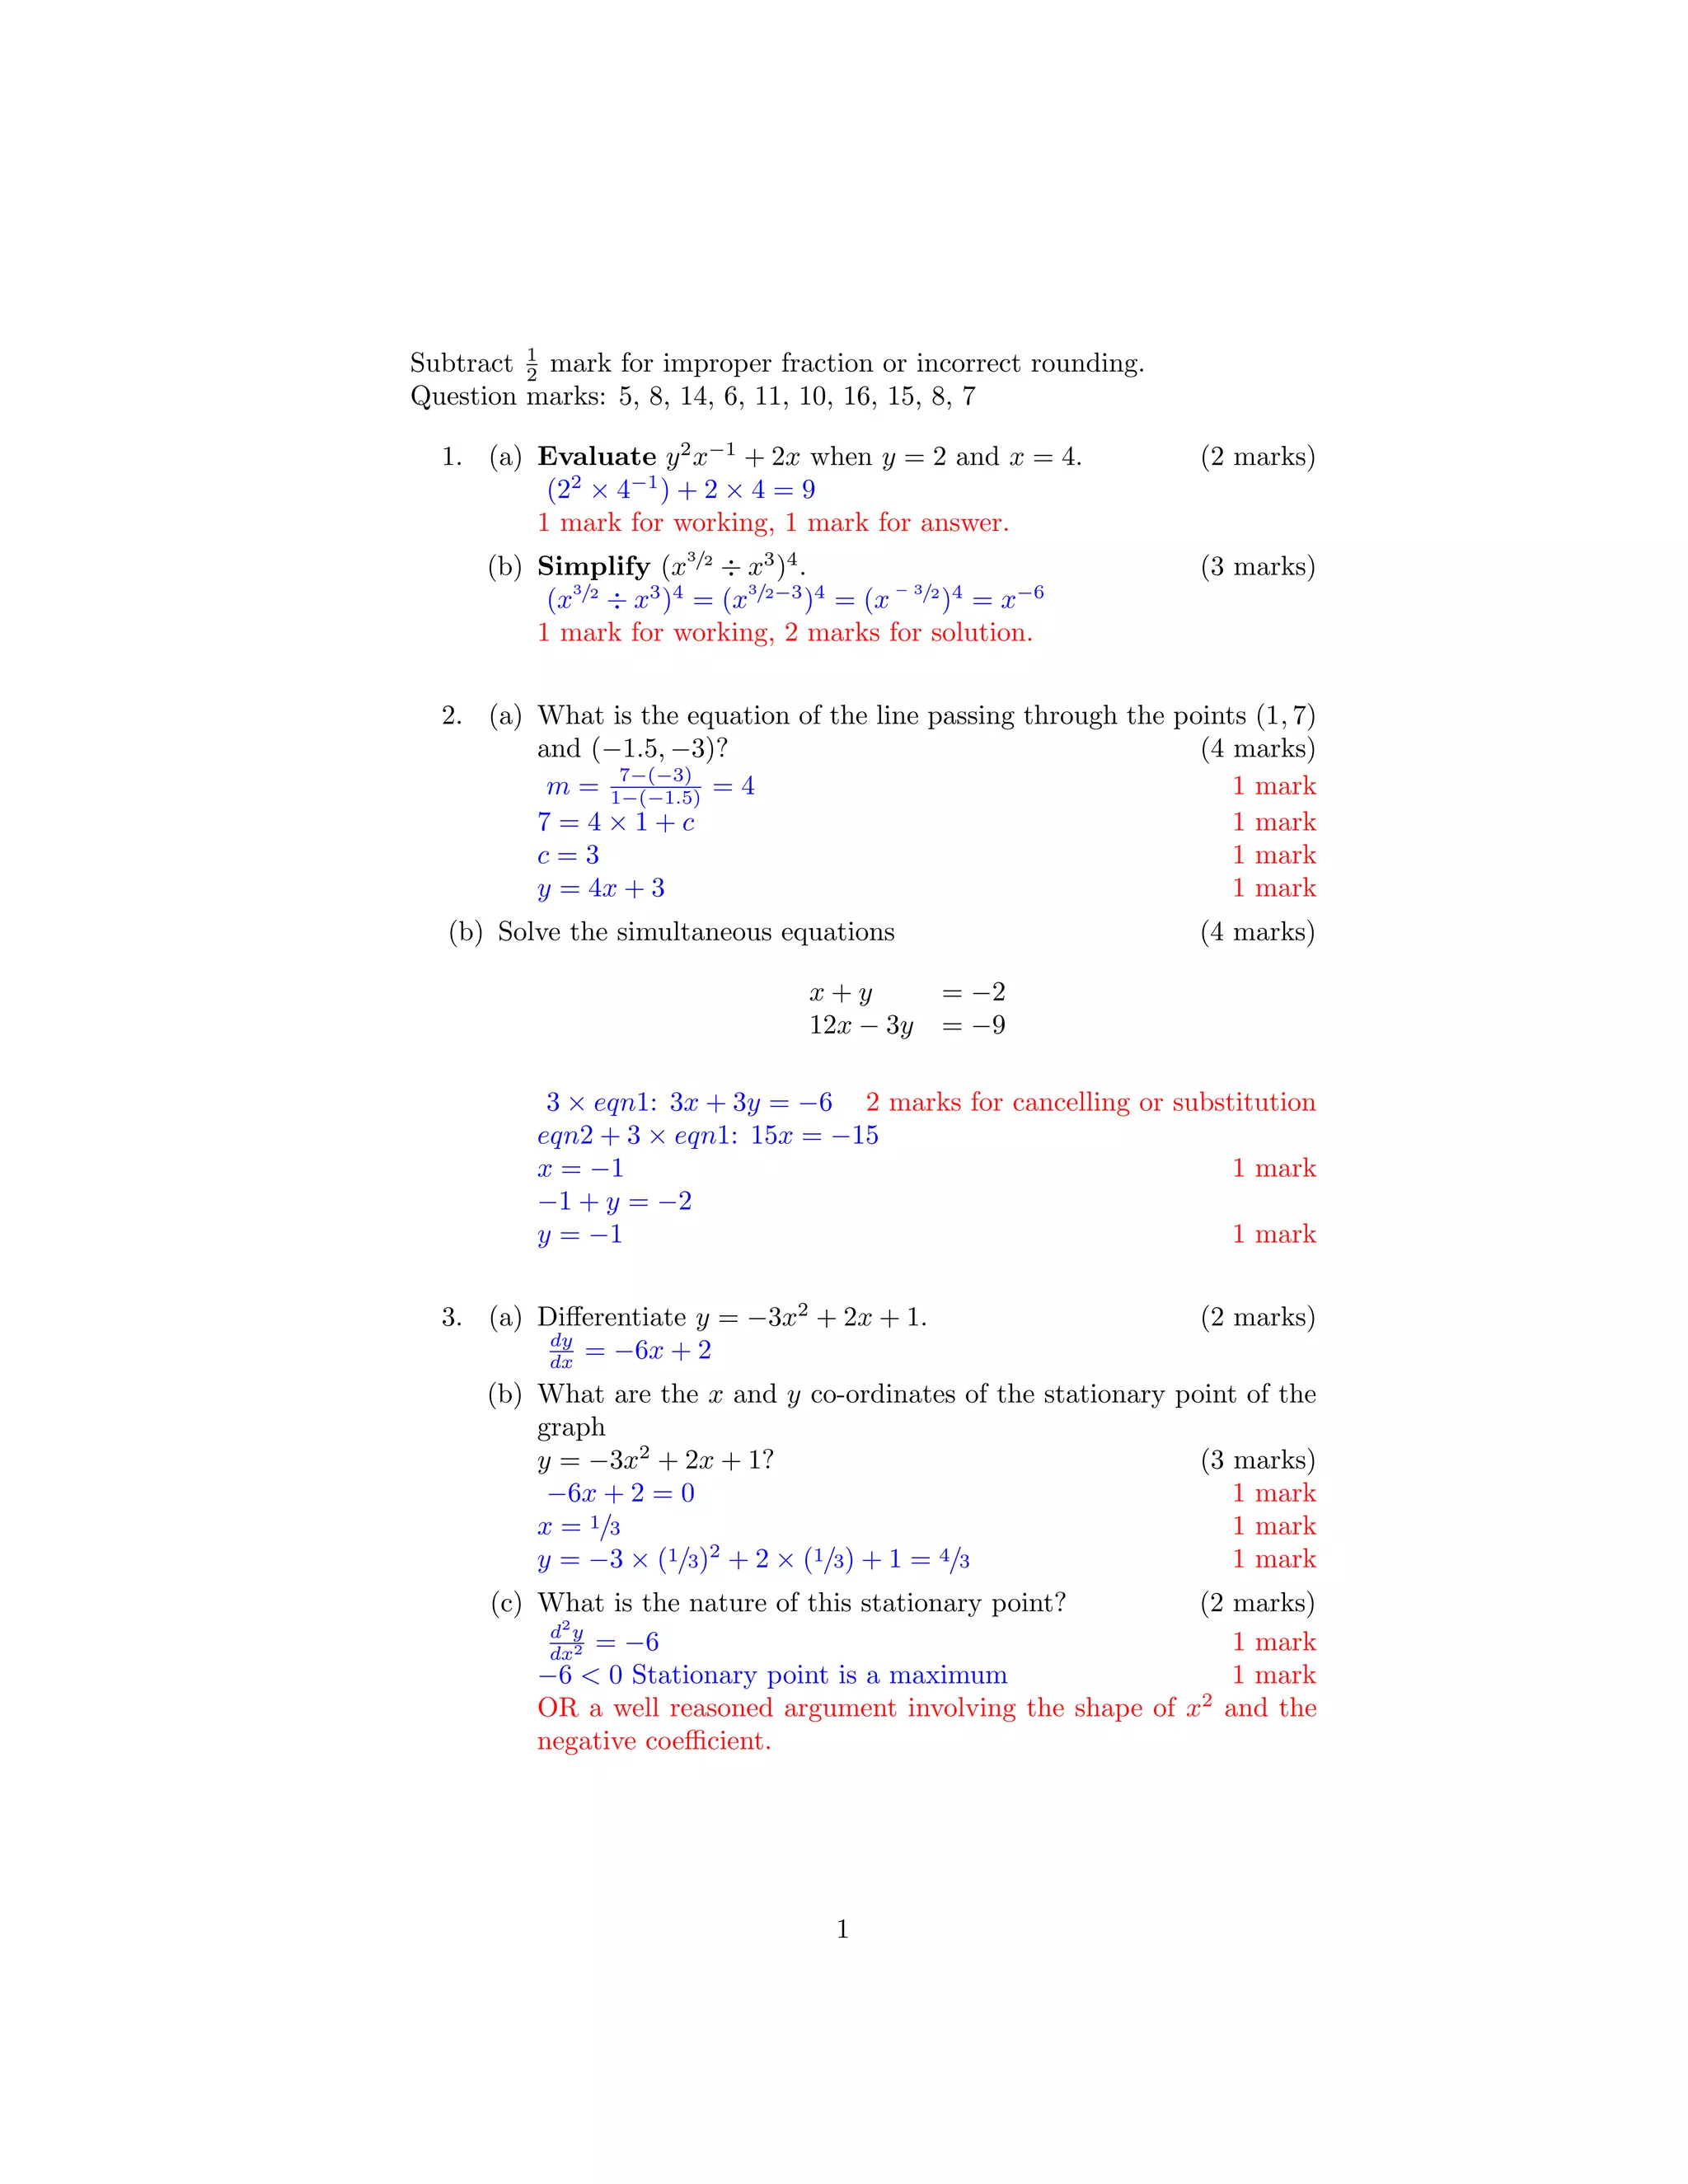
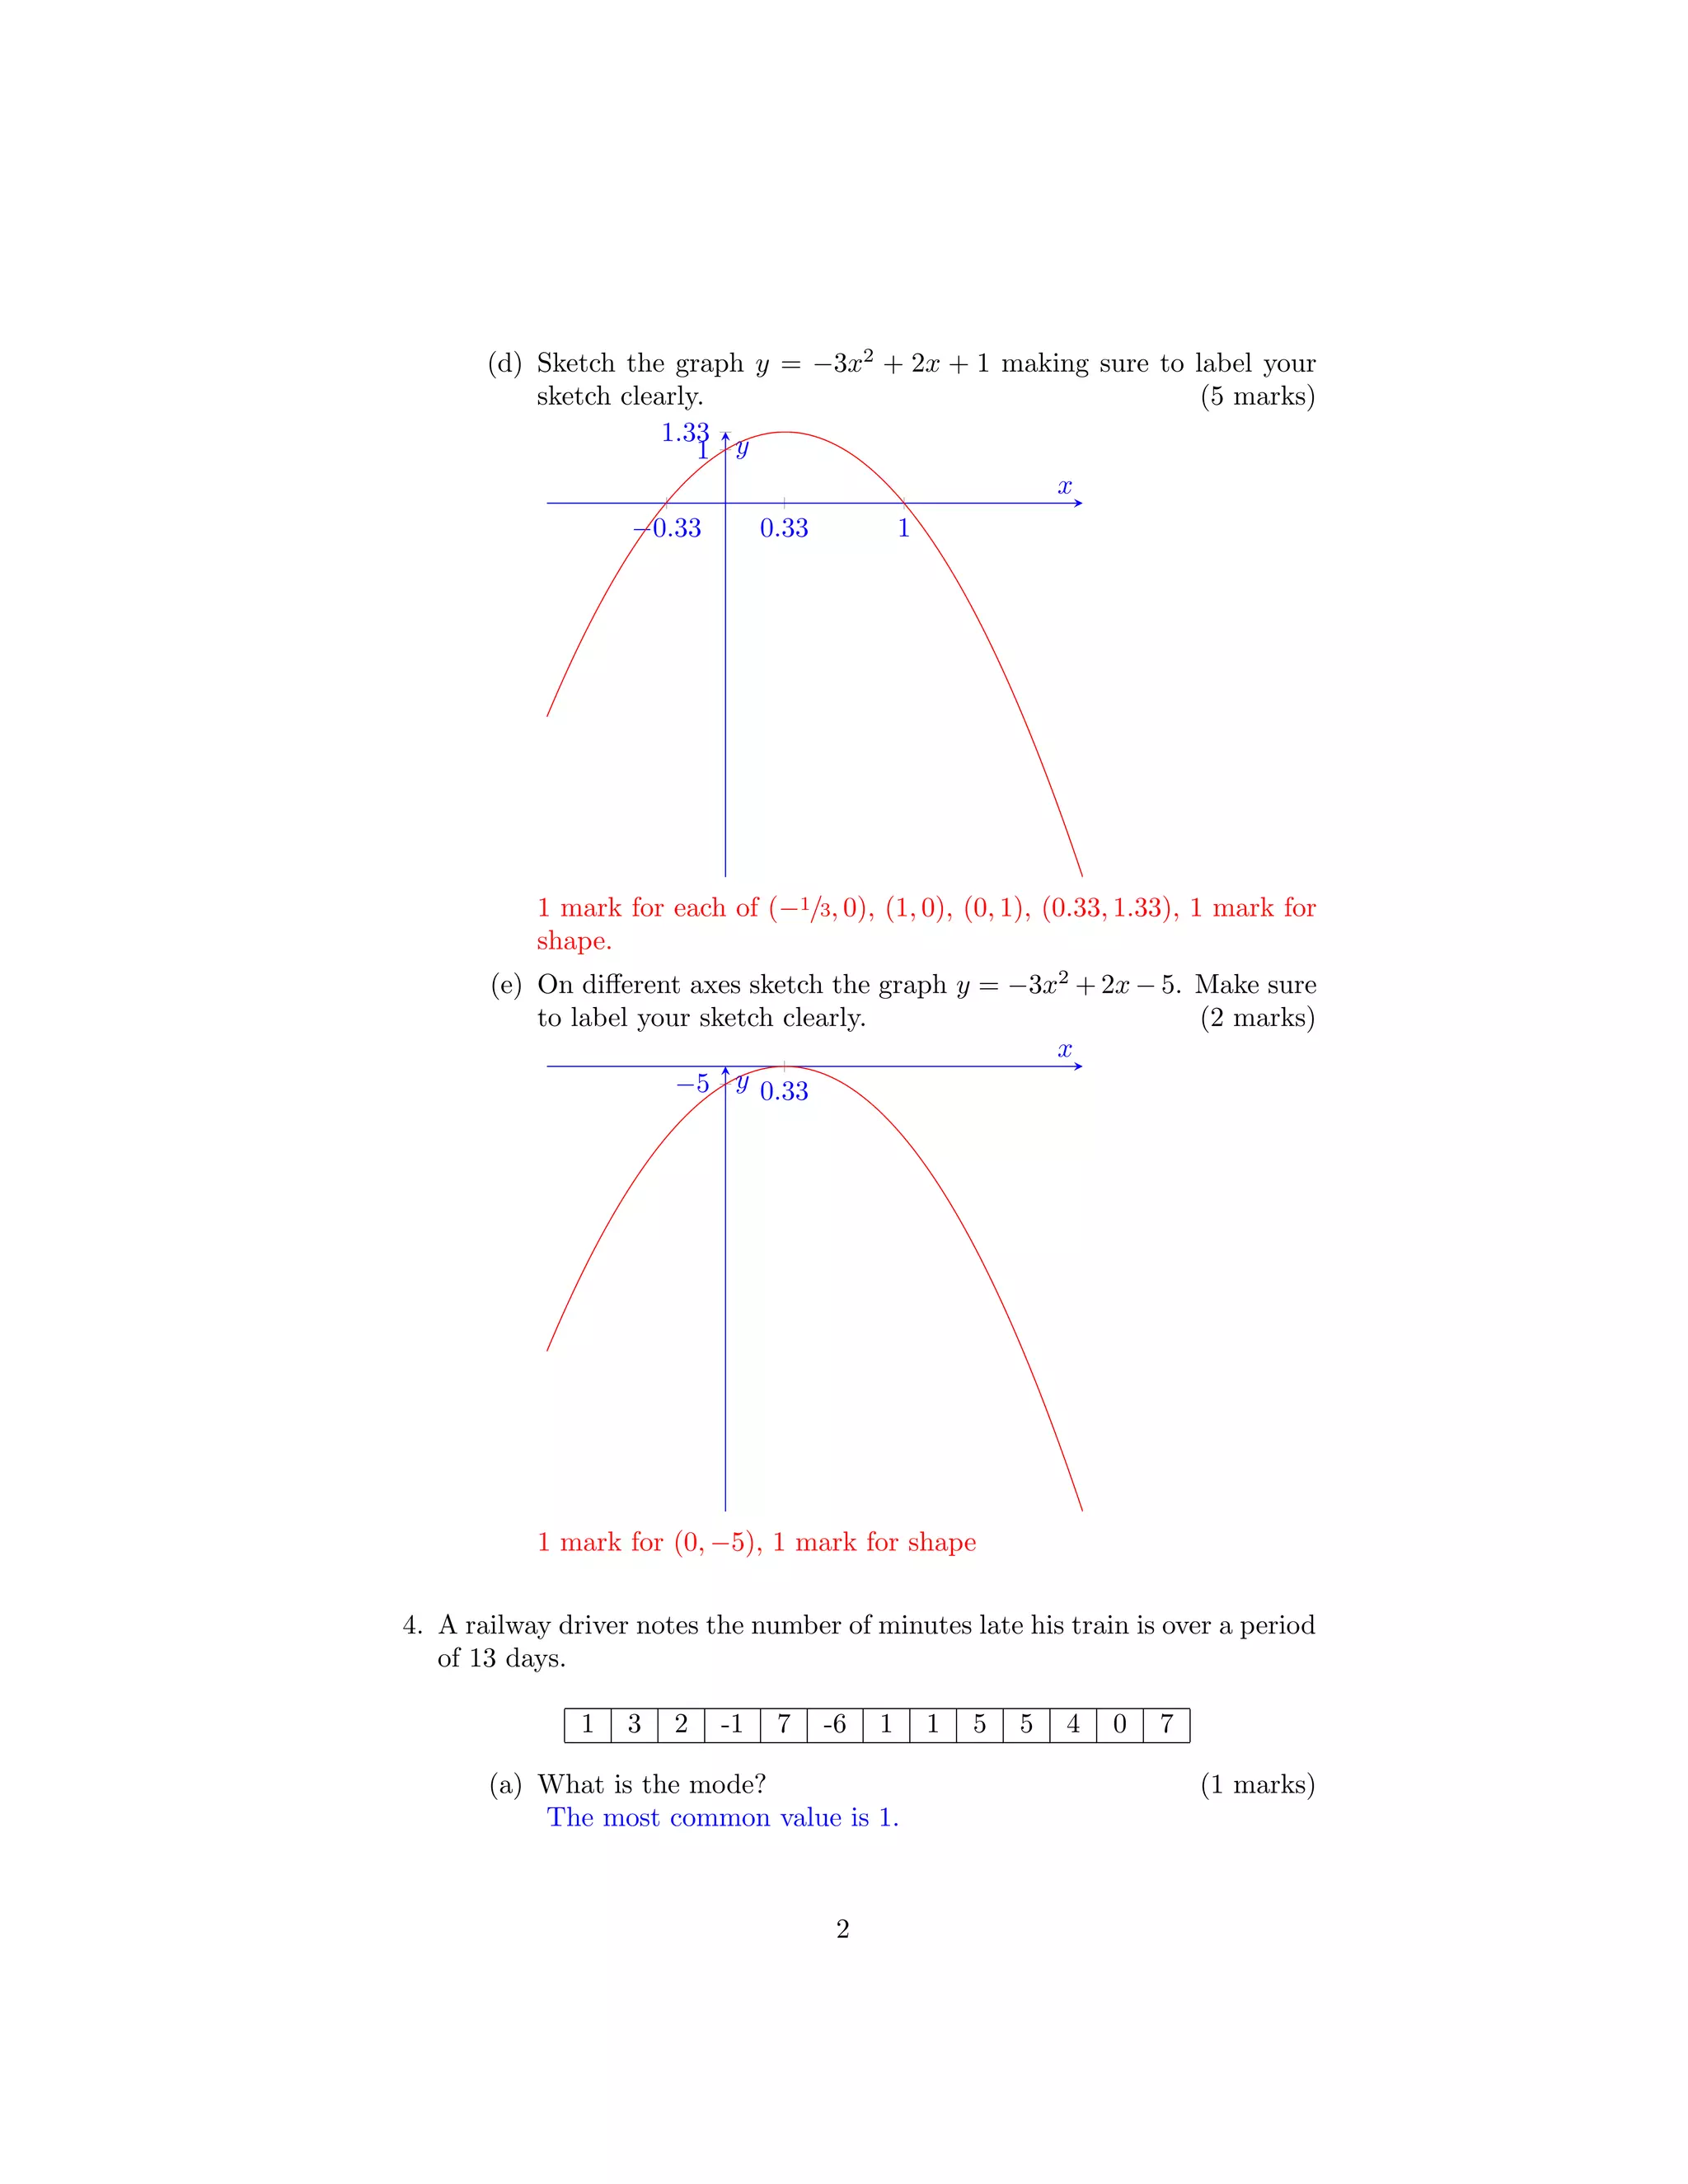
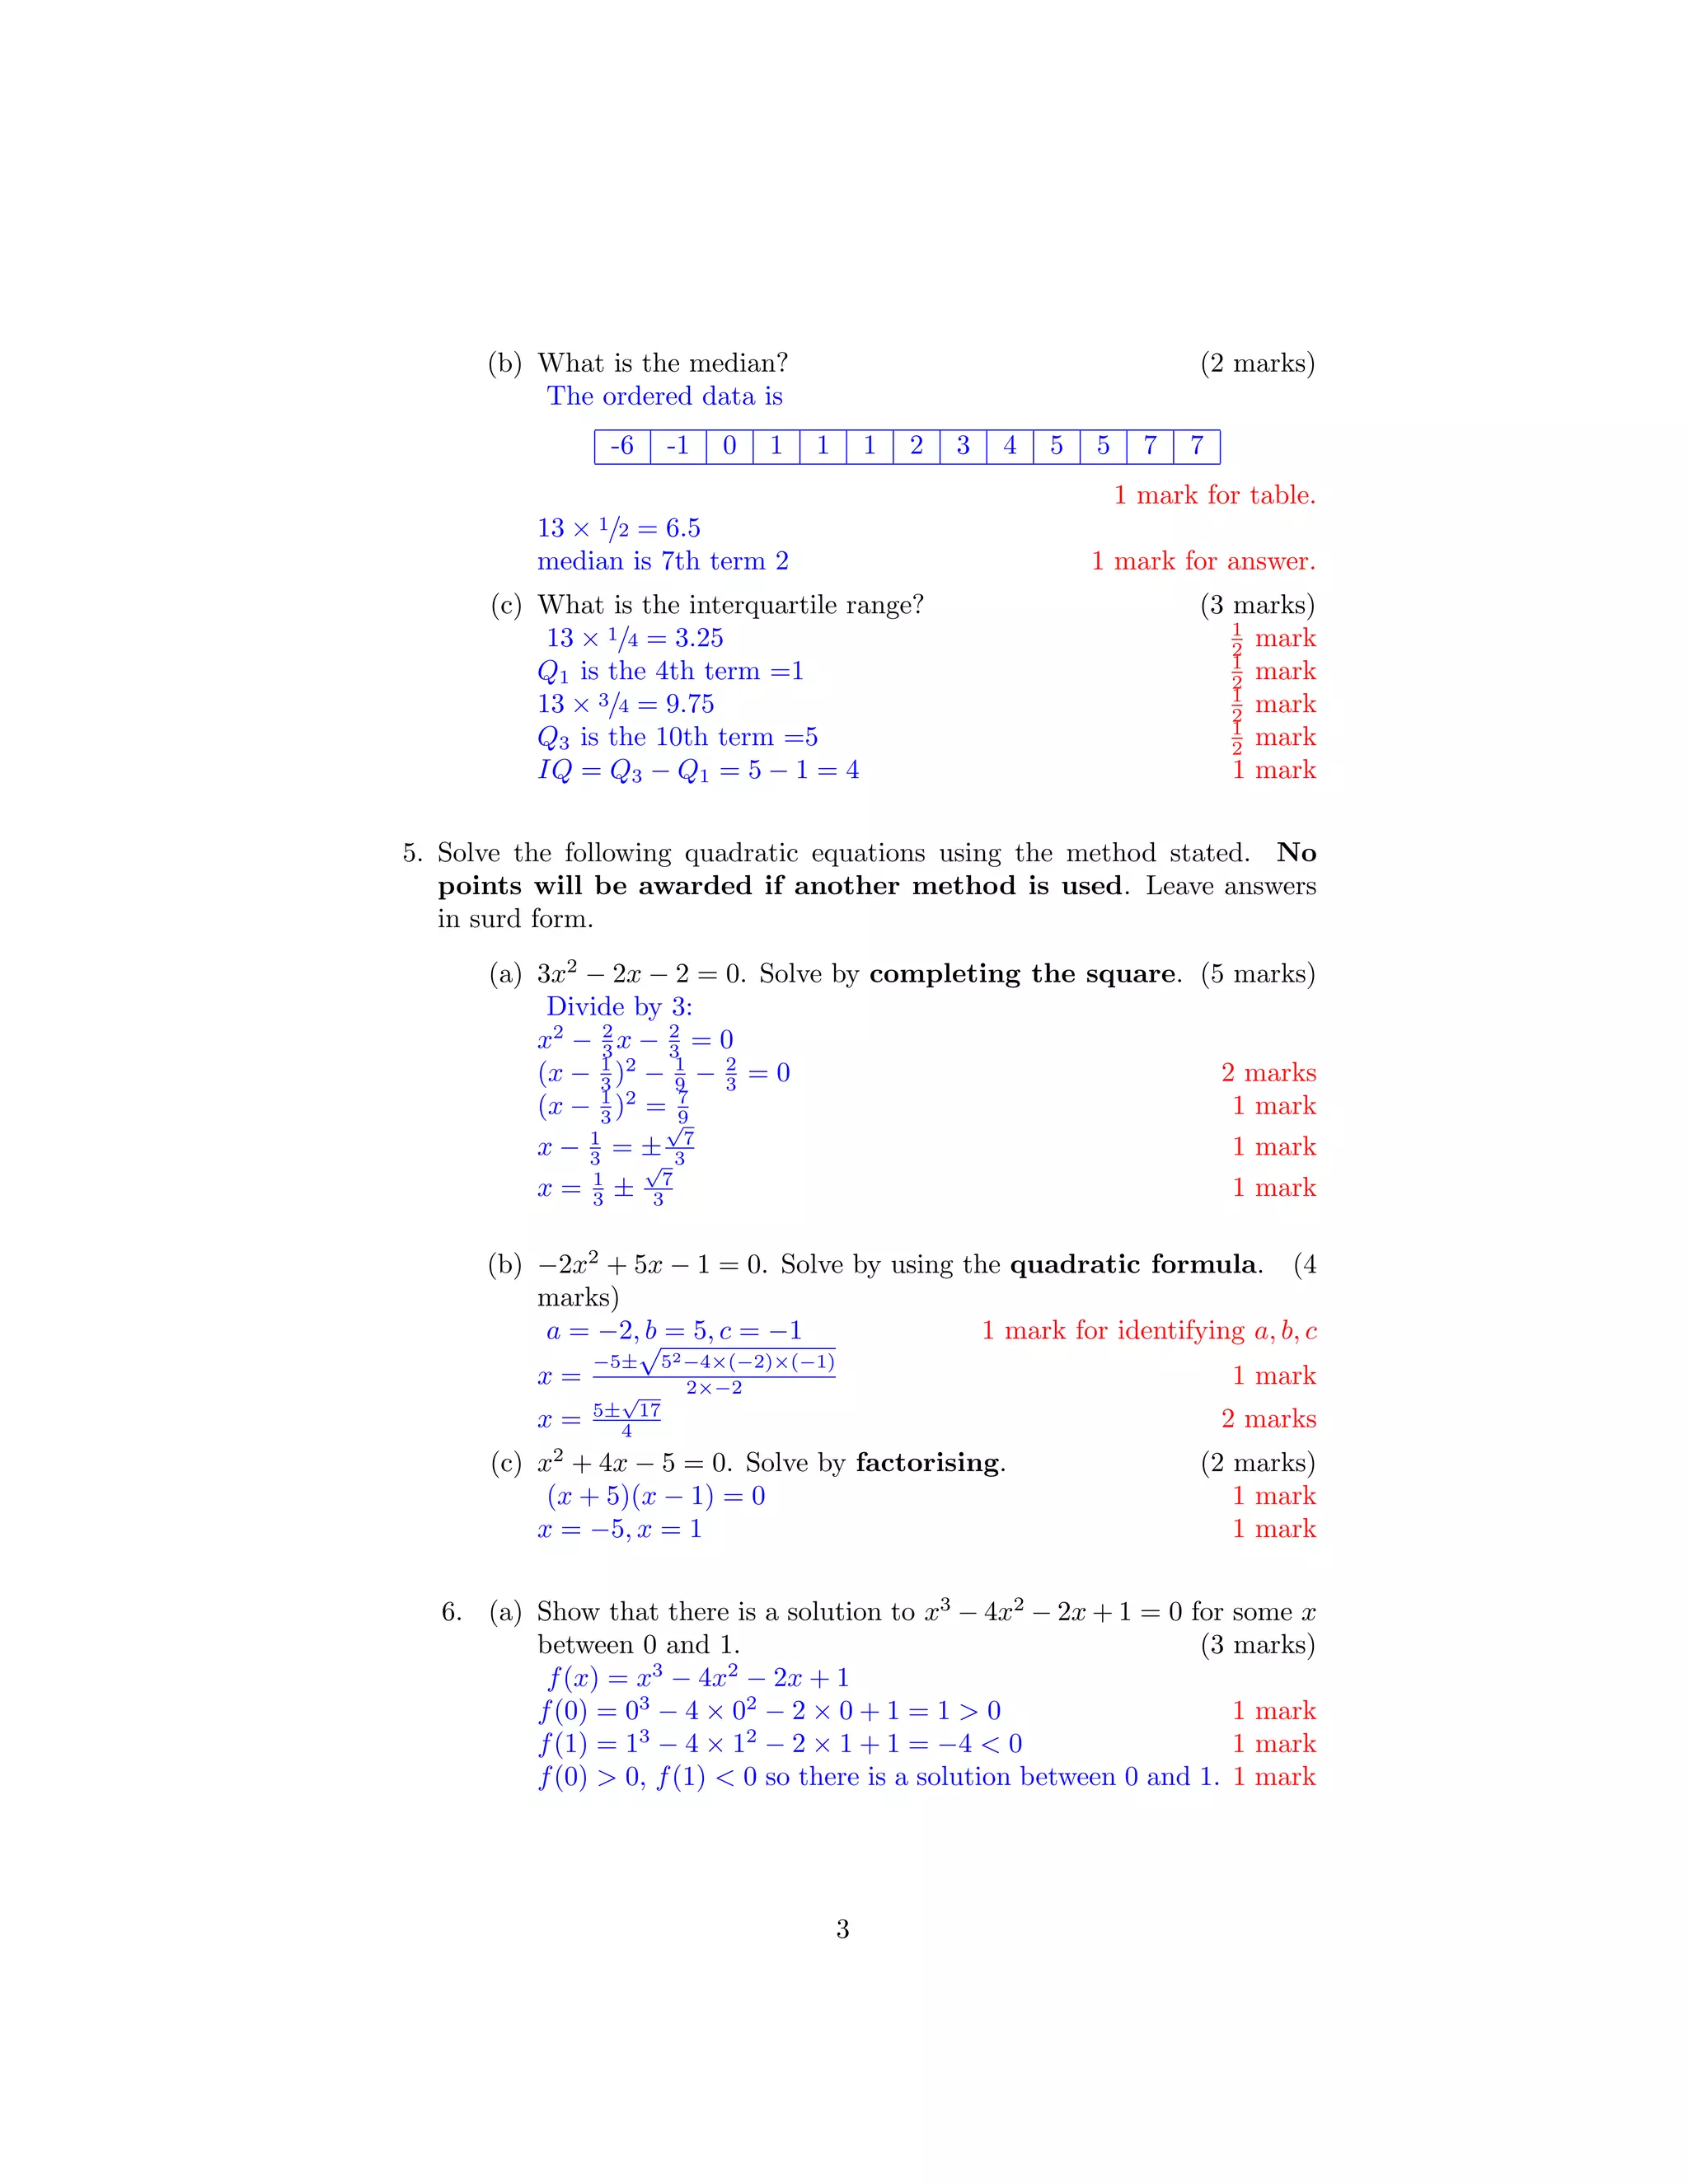
1. The document provides worked solutions to mathematical problems involving differentiation, graph sketching, solving quadratic equations, and probability.
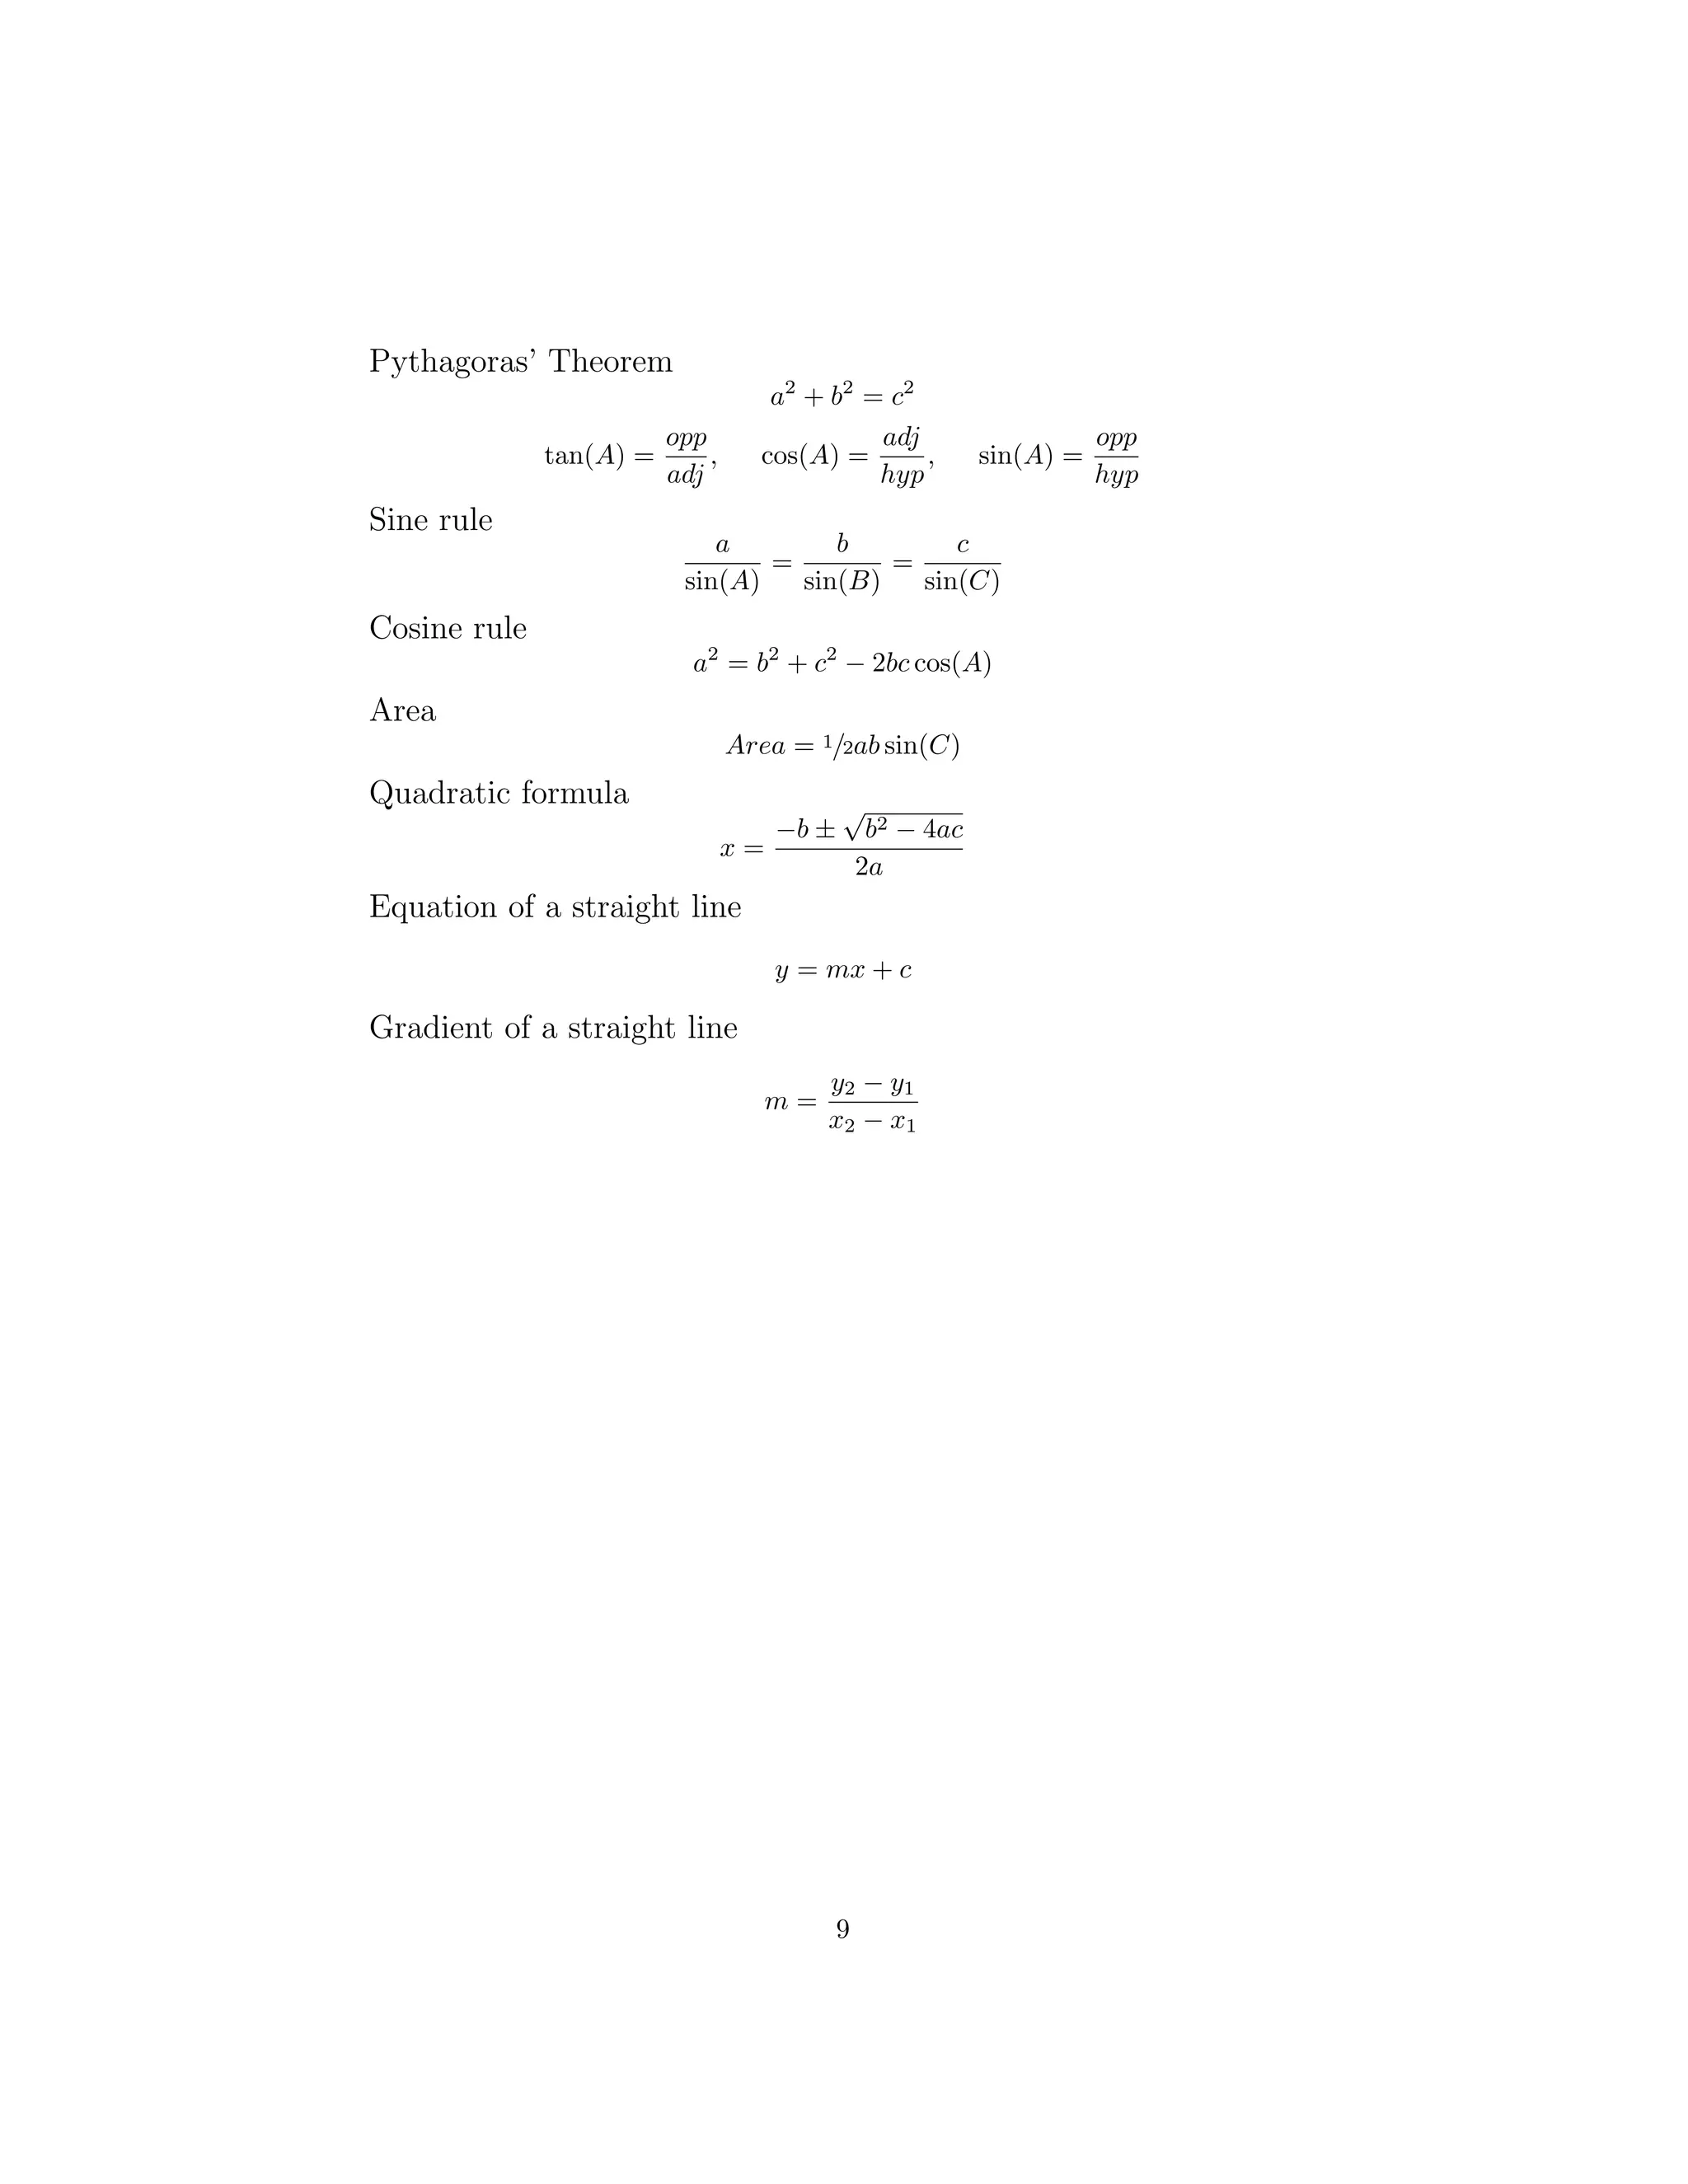
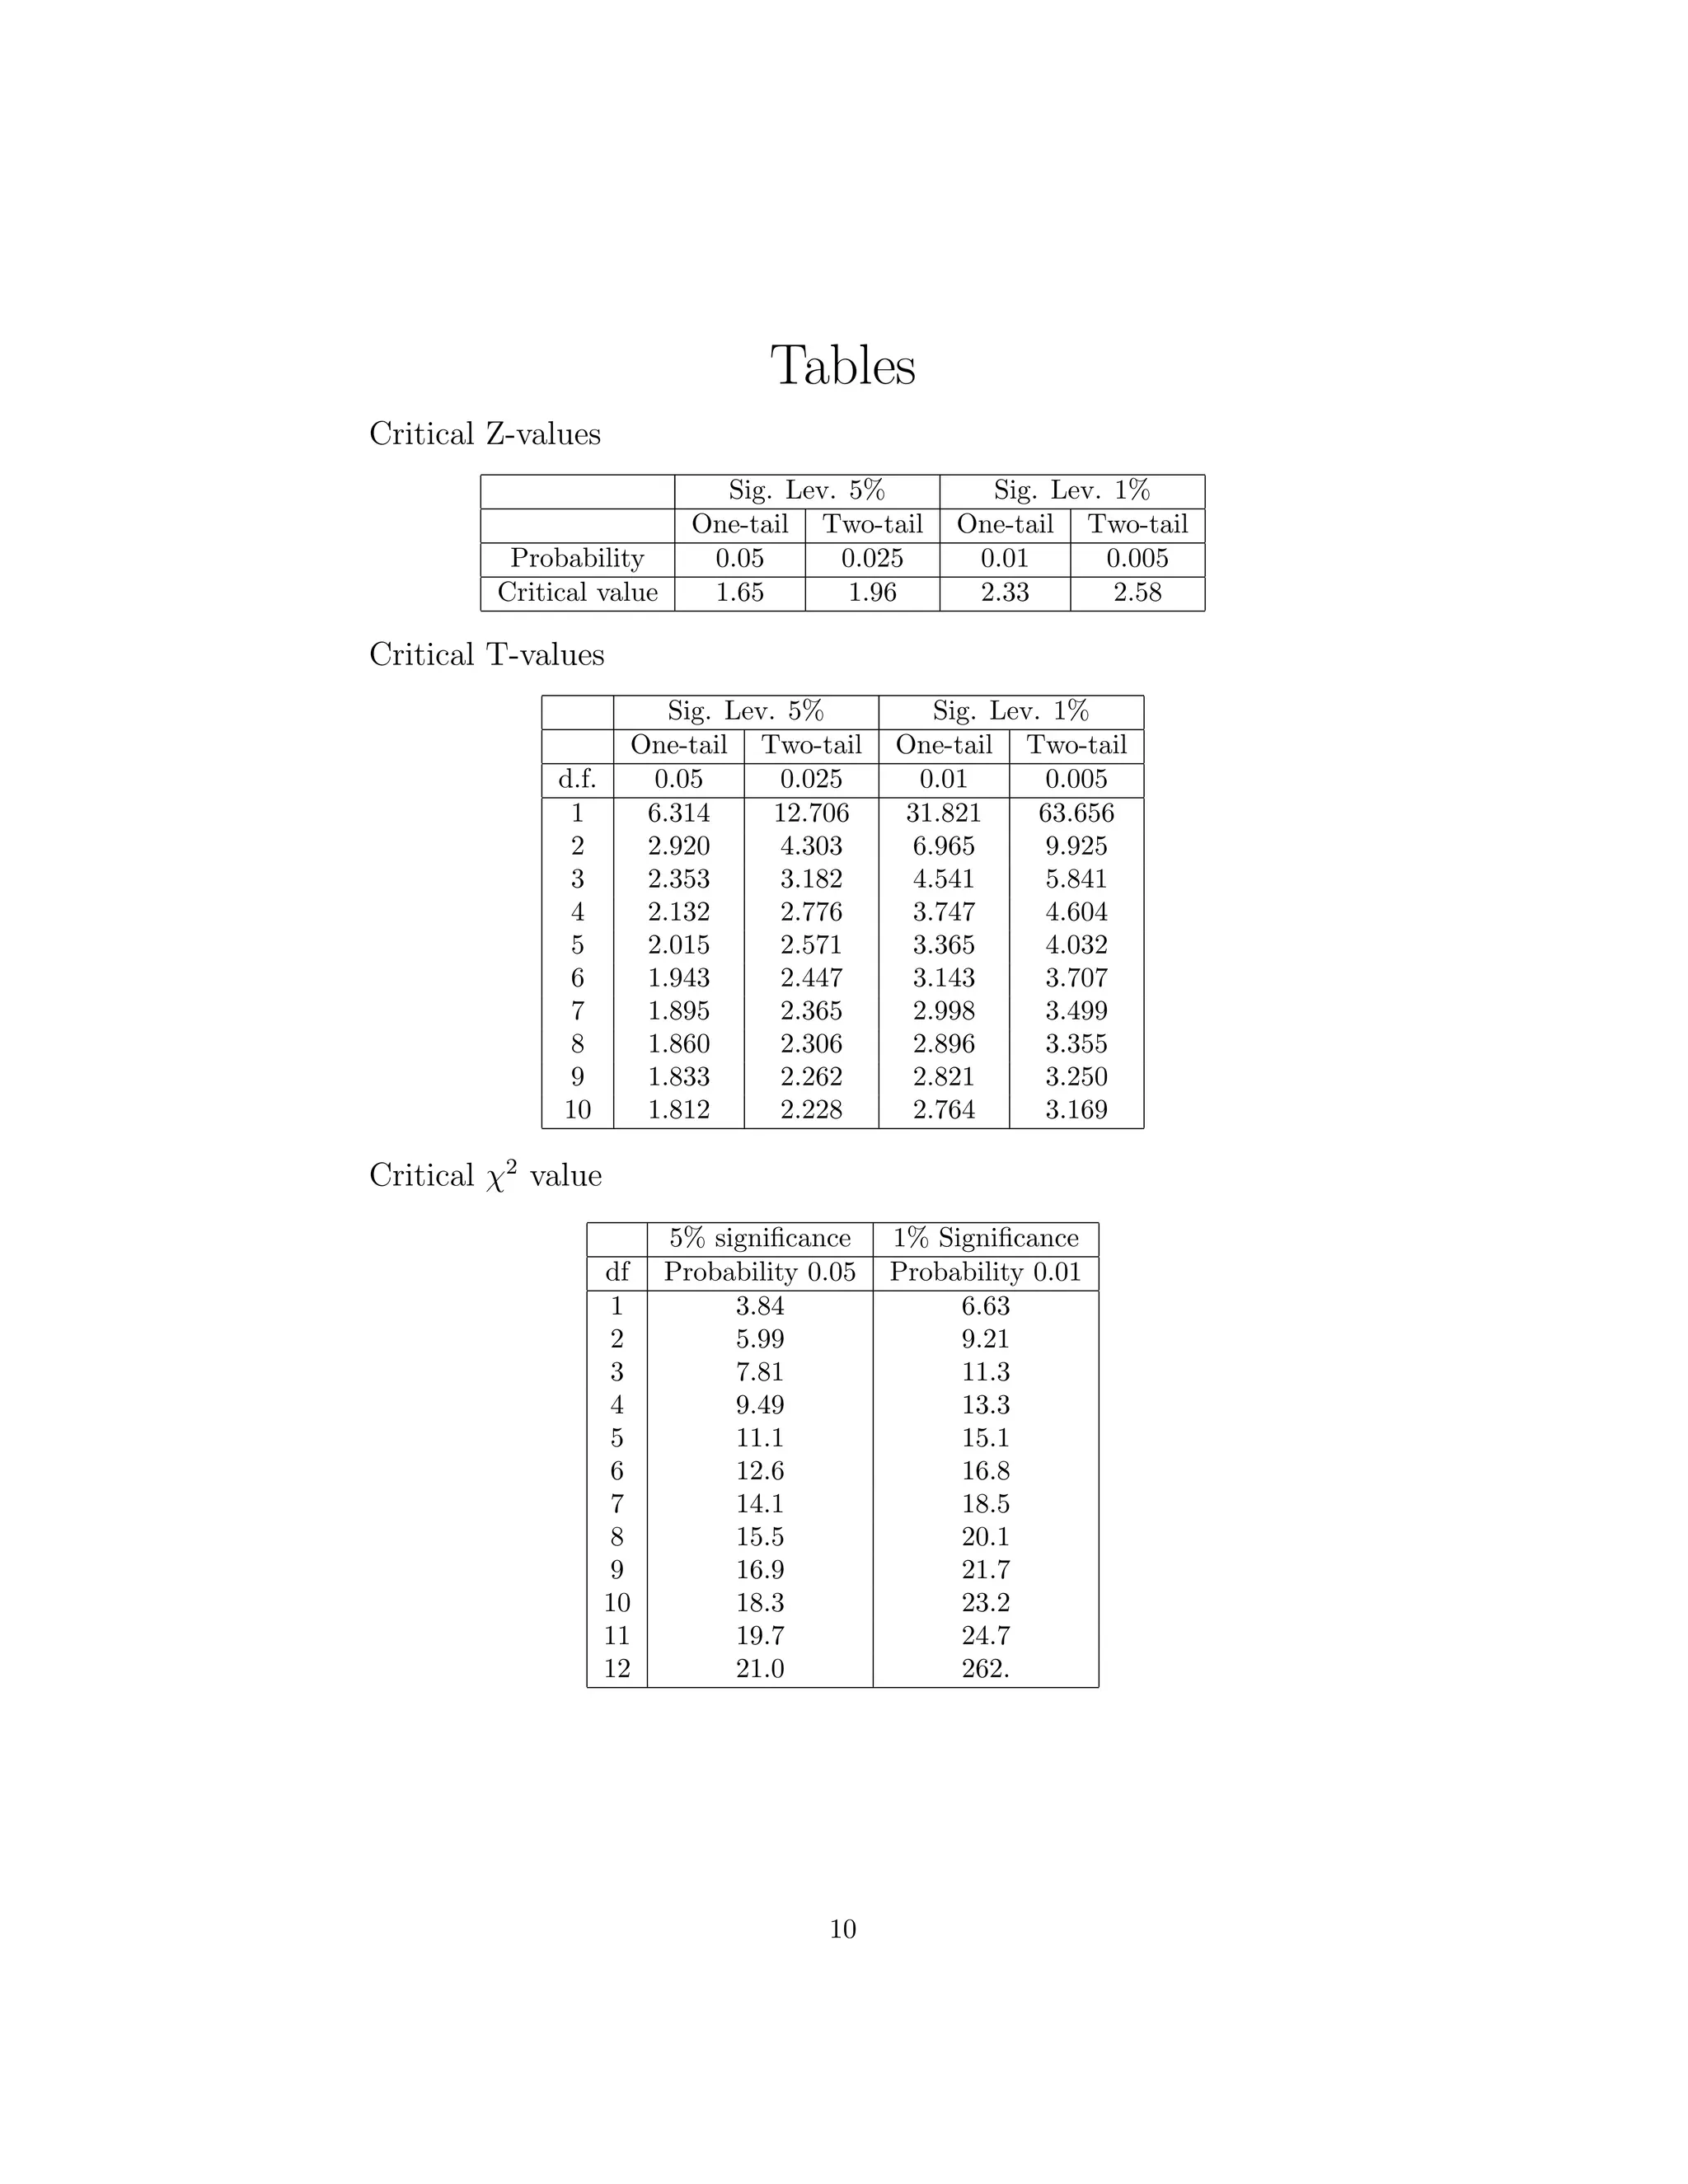
2. A key is provided with common statistical formulas and tables for critical values of t and z distributions.
3. The problems cover a range of mathematical topics at an intermediate level, with multiple parts requiring setting up and solving equations as well as interpreting results.
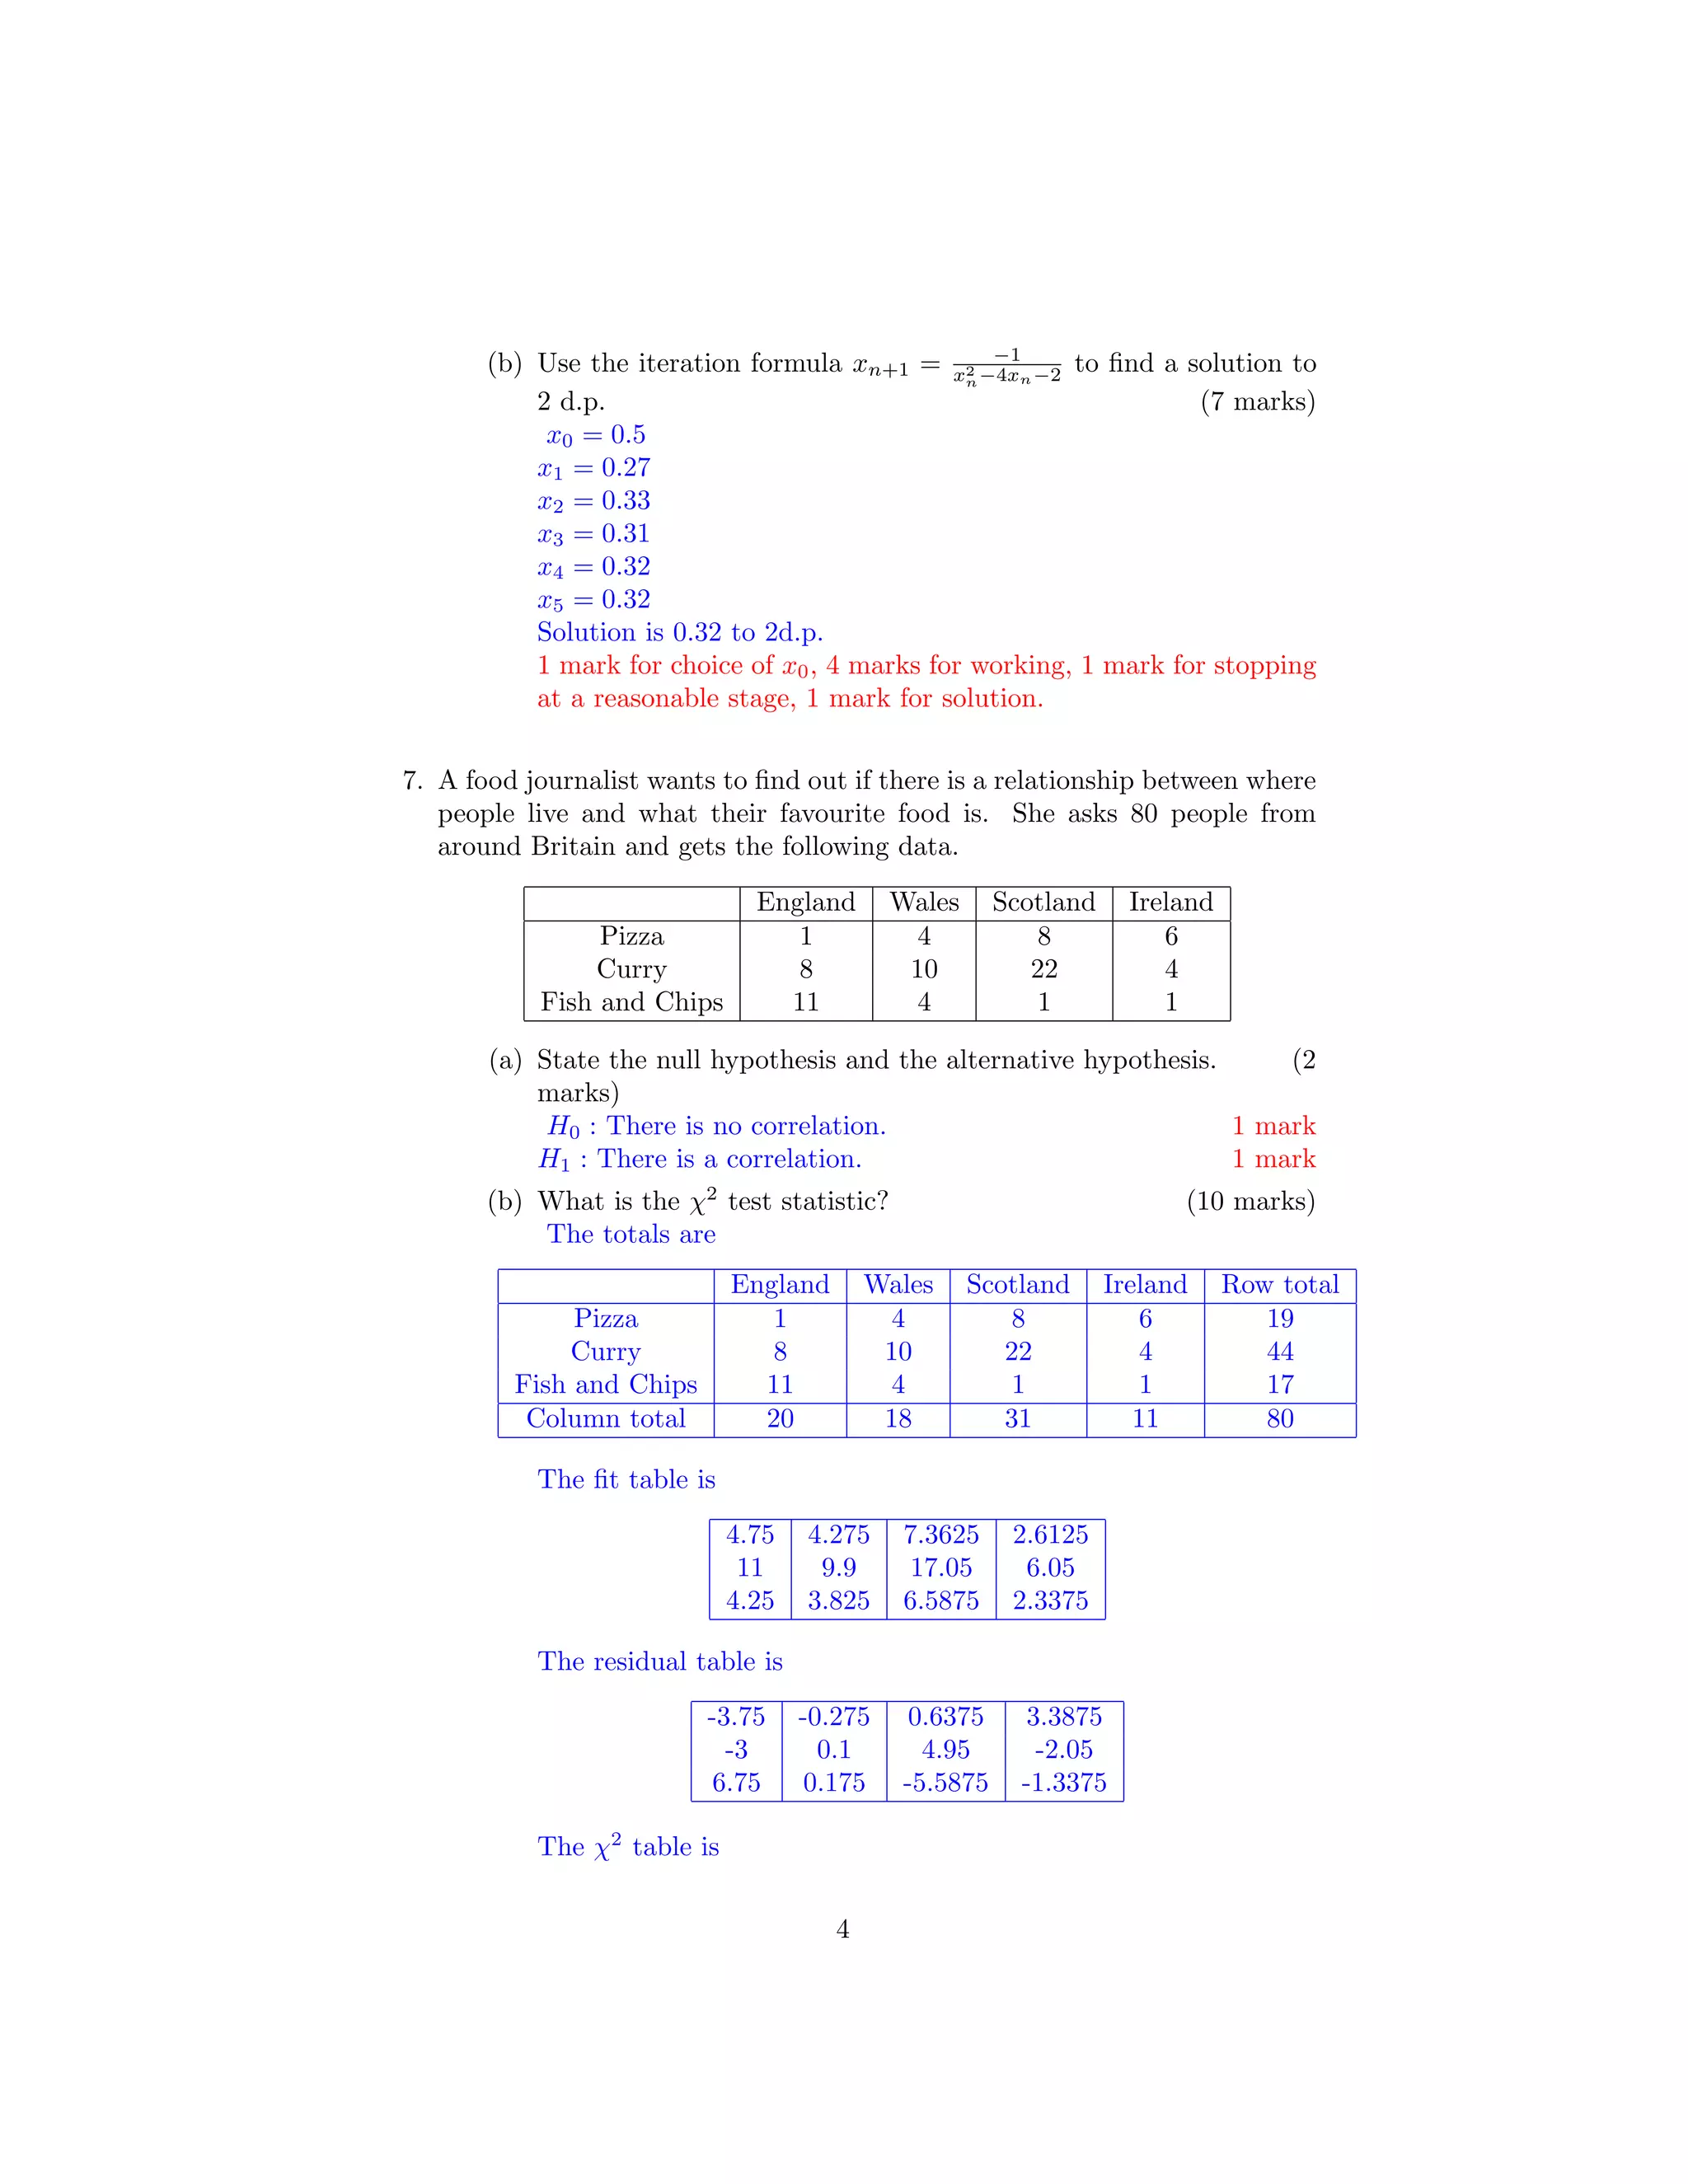
![2.9605 0.0177 0.0552 4.3924
0.8182 0.0010 1.4371 0.6946
10.7206 0.0080 4.7393 0.7653
The test statistic is 26.6.
2 marks per table (-0.5 per error), 2 marks for solution.
(c) If we test at a 1% level of significance what is the critical χ2
value?
(2 marks)
Degree of freedom is (4 − 1) × (3 − 1) = 6 1 mark
Critical value is 16.8 1 mark
(d) What can we deduce? (2 mark)
26.8 > 16.8 so there is a correlation between the food people
prefer and the country they live in.
8. A Baker claims there is a mean of 17 cherries in each of his cherry cakes.
A customer buys 9 random cherry cakes and notes how many cherries are
in each one. He writes his test data in a table.
10 15 19 16 1 20 13 15 17
(a) State the null hypothesis and the alternative hypothesis. (2
marks)
H0 : µ = 17 1 mark
H1; µ = 17 1 mark
(b) What is the mean of the test data? (2 marks)
µ(X) = 10 + 15 + 19 + 16 + 1 + 20 + 13 + 15 + 17/9 = 126/9 = 14
1 mark for method, 1 mark for solution.
(c) What is the sample standard deviation of the test data? (4
marks)
(X[i])2
= 100 225 361 256 1 400 169 225 289
σ2
(X) = 100+225+361+256+1+400+169+225+289−9×142
9−1 = 2026−1764
8 =
32.75
σ(X) = 5.723 to 3 d.p. 1 mark for square values, 1 mark for
working, 2 marks for solution.
(d) What is the T test statistic? (3 marks)
µ = 17, µ(X) = 14, σ(X) = 5.723, n = 9.
T = 14−17
5.723/
√
9
= −1.57 to 2 d.p. 1 mark for identifying variables, 1
mark for working, 1 mark for answer.
5](https://image.slidesharecdn.com/foundationc2exammay2013sols-140603104923-phpapp02/75/Foundation-c2-exam-may-2013-sols-5-2048.jpg)
![Formulae
Let X be a list of data of size n.
Mean:
µ(X) =
n
i=1 X[i]
n
Variance
σ2
(X) =
n
i=1(X[i])2
n
− µ2
(X)
Z-statistic
Z =
µ(X) − µ
σ/
√
n
Sample Variance
σ2
(X) =
n
i=1(X[i])2
− nµ2
(X)
n − 1
T-statistic
T =
µ(X) − µ
σ(X)/
√
n
Alternative notation
Mean
¯x =
x
n
Variance
V ar =
x2
n
− ¯x2
Z-statistic
Z =
¯x − A
σ/
√
n
Sample Variance
s2
=
x2
− n¯x2
n − 1
T-statistic
T =
¯x − A
s/
√
n
8](https://image.slidesharecdn.com/foundationc2exammay2013sols-140603104923-phpapp02/75/Foundation-c2-exam-may-2013-sols-8-2048.jpg)