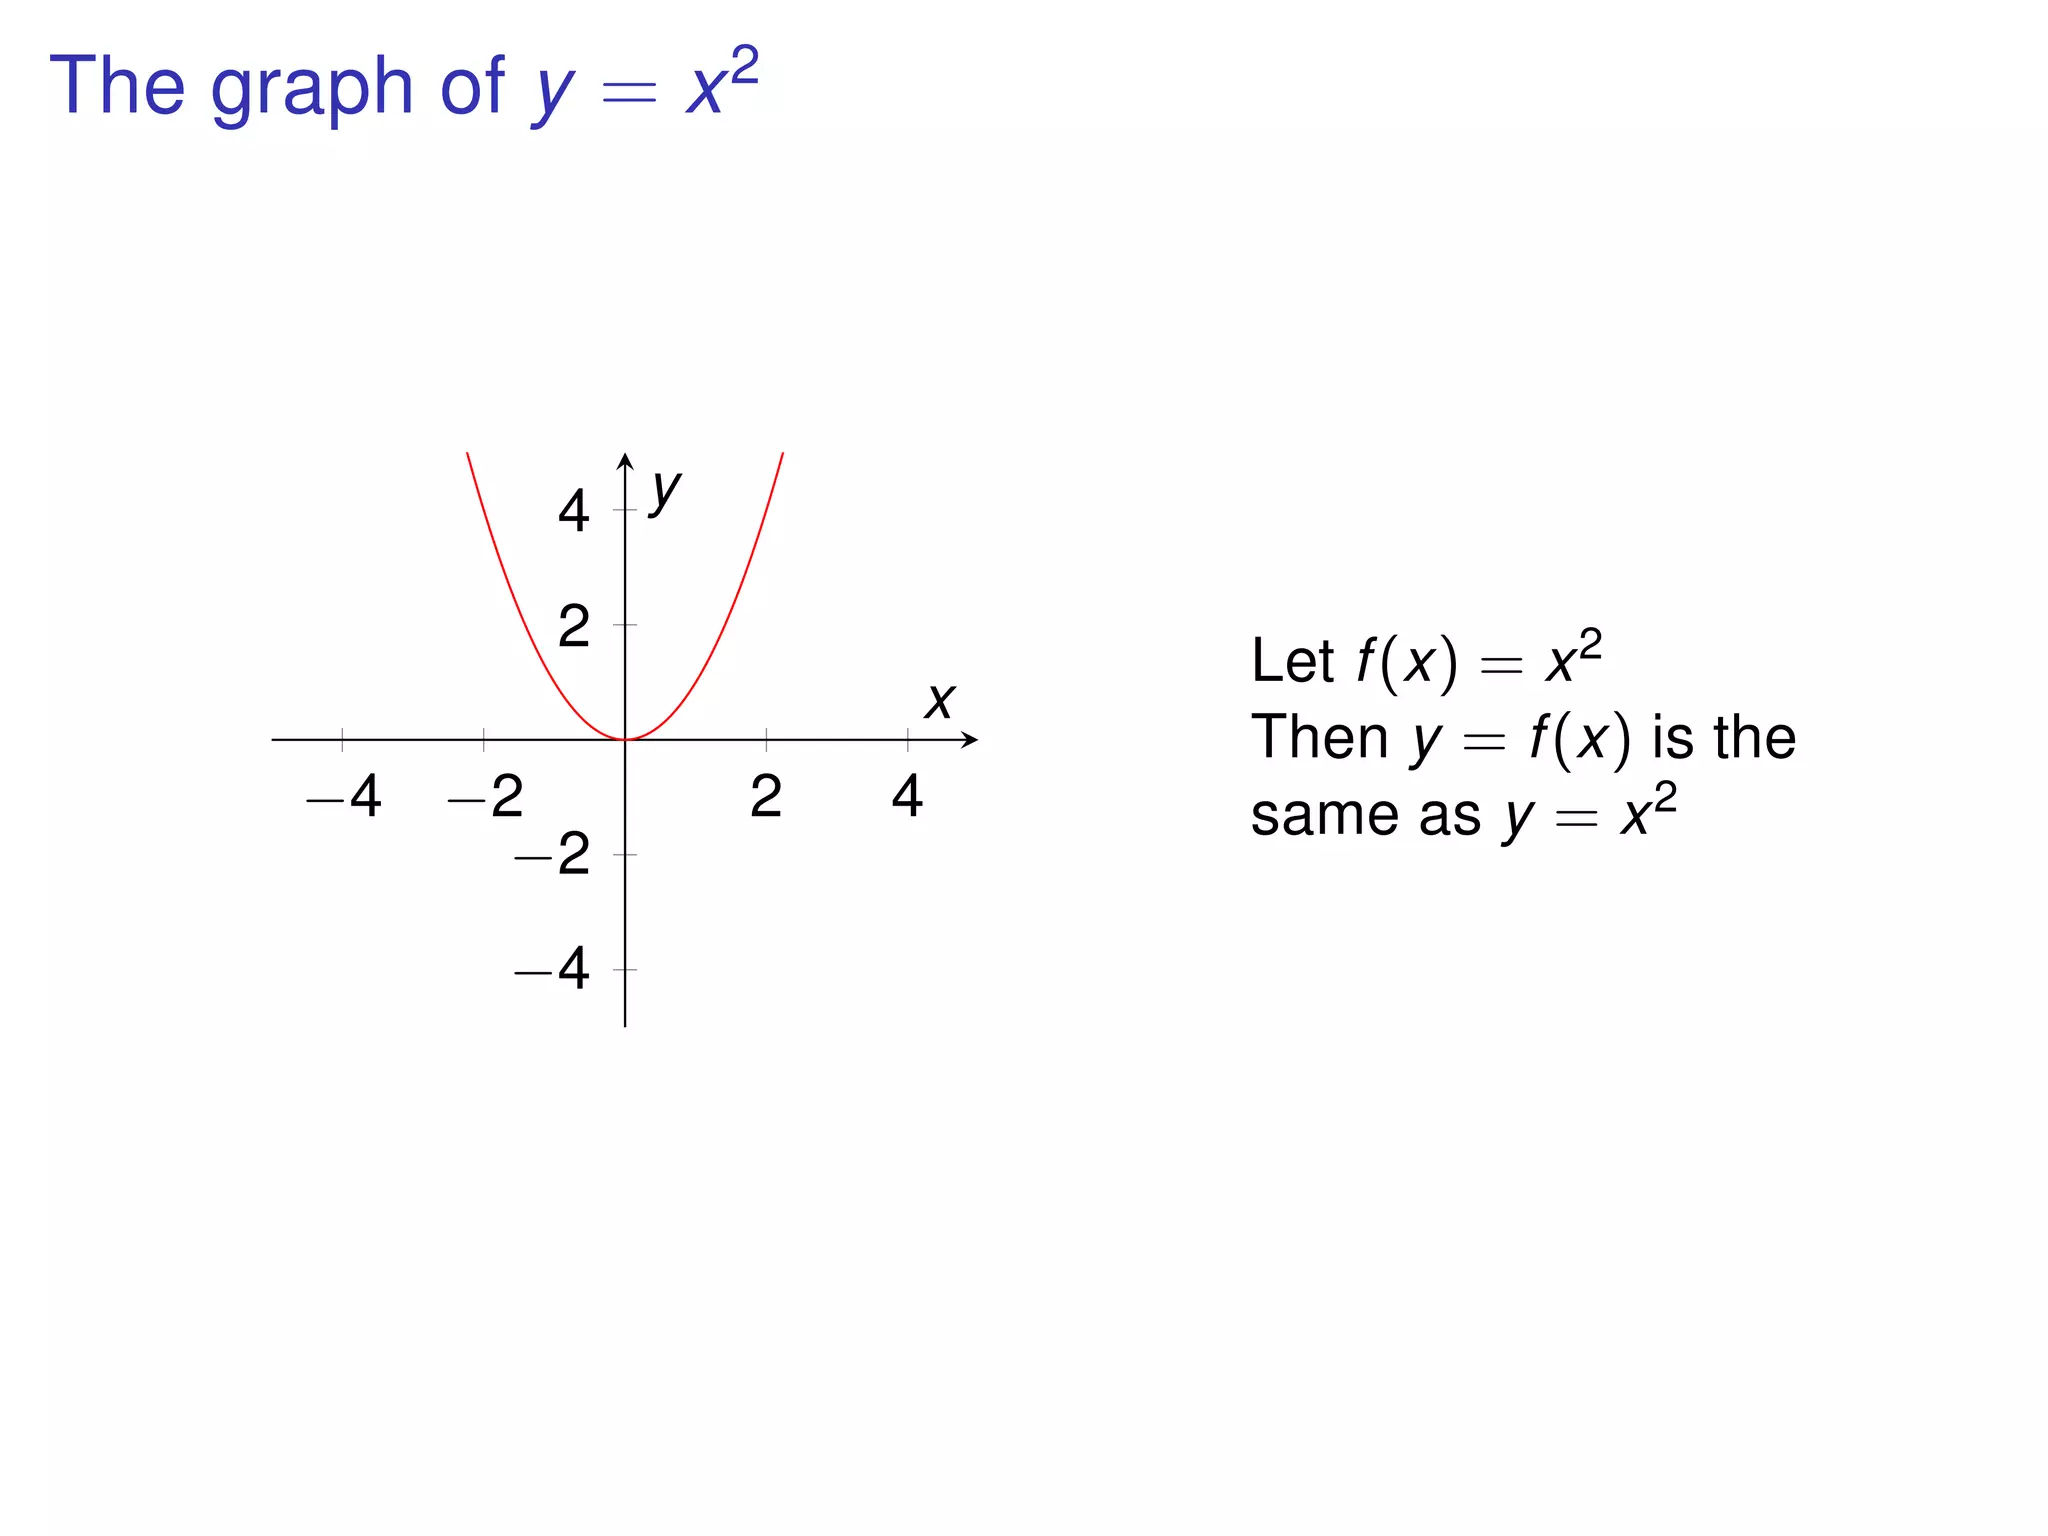
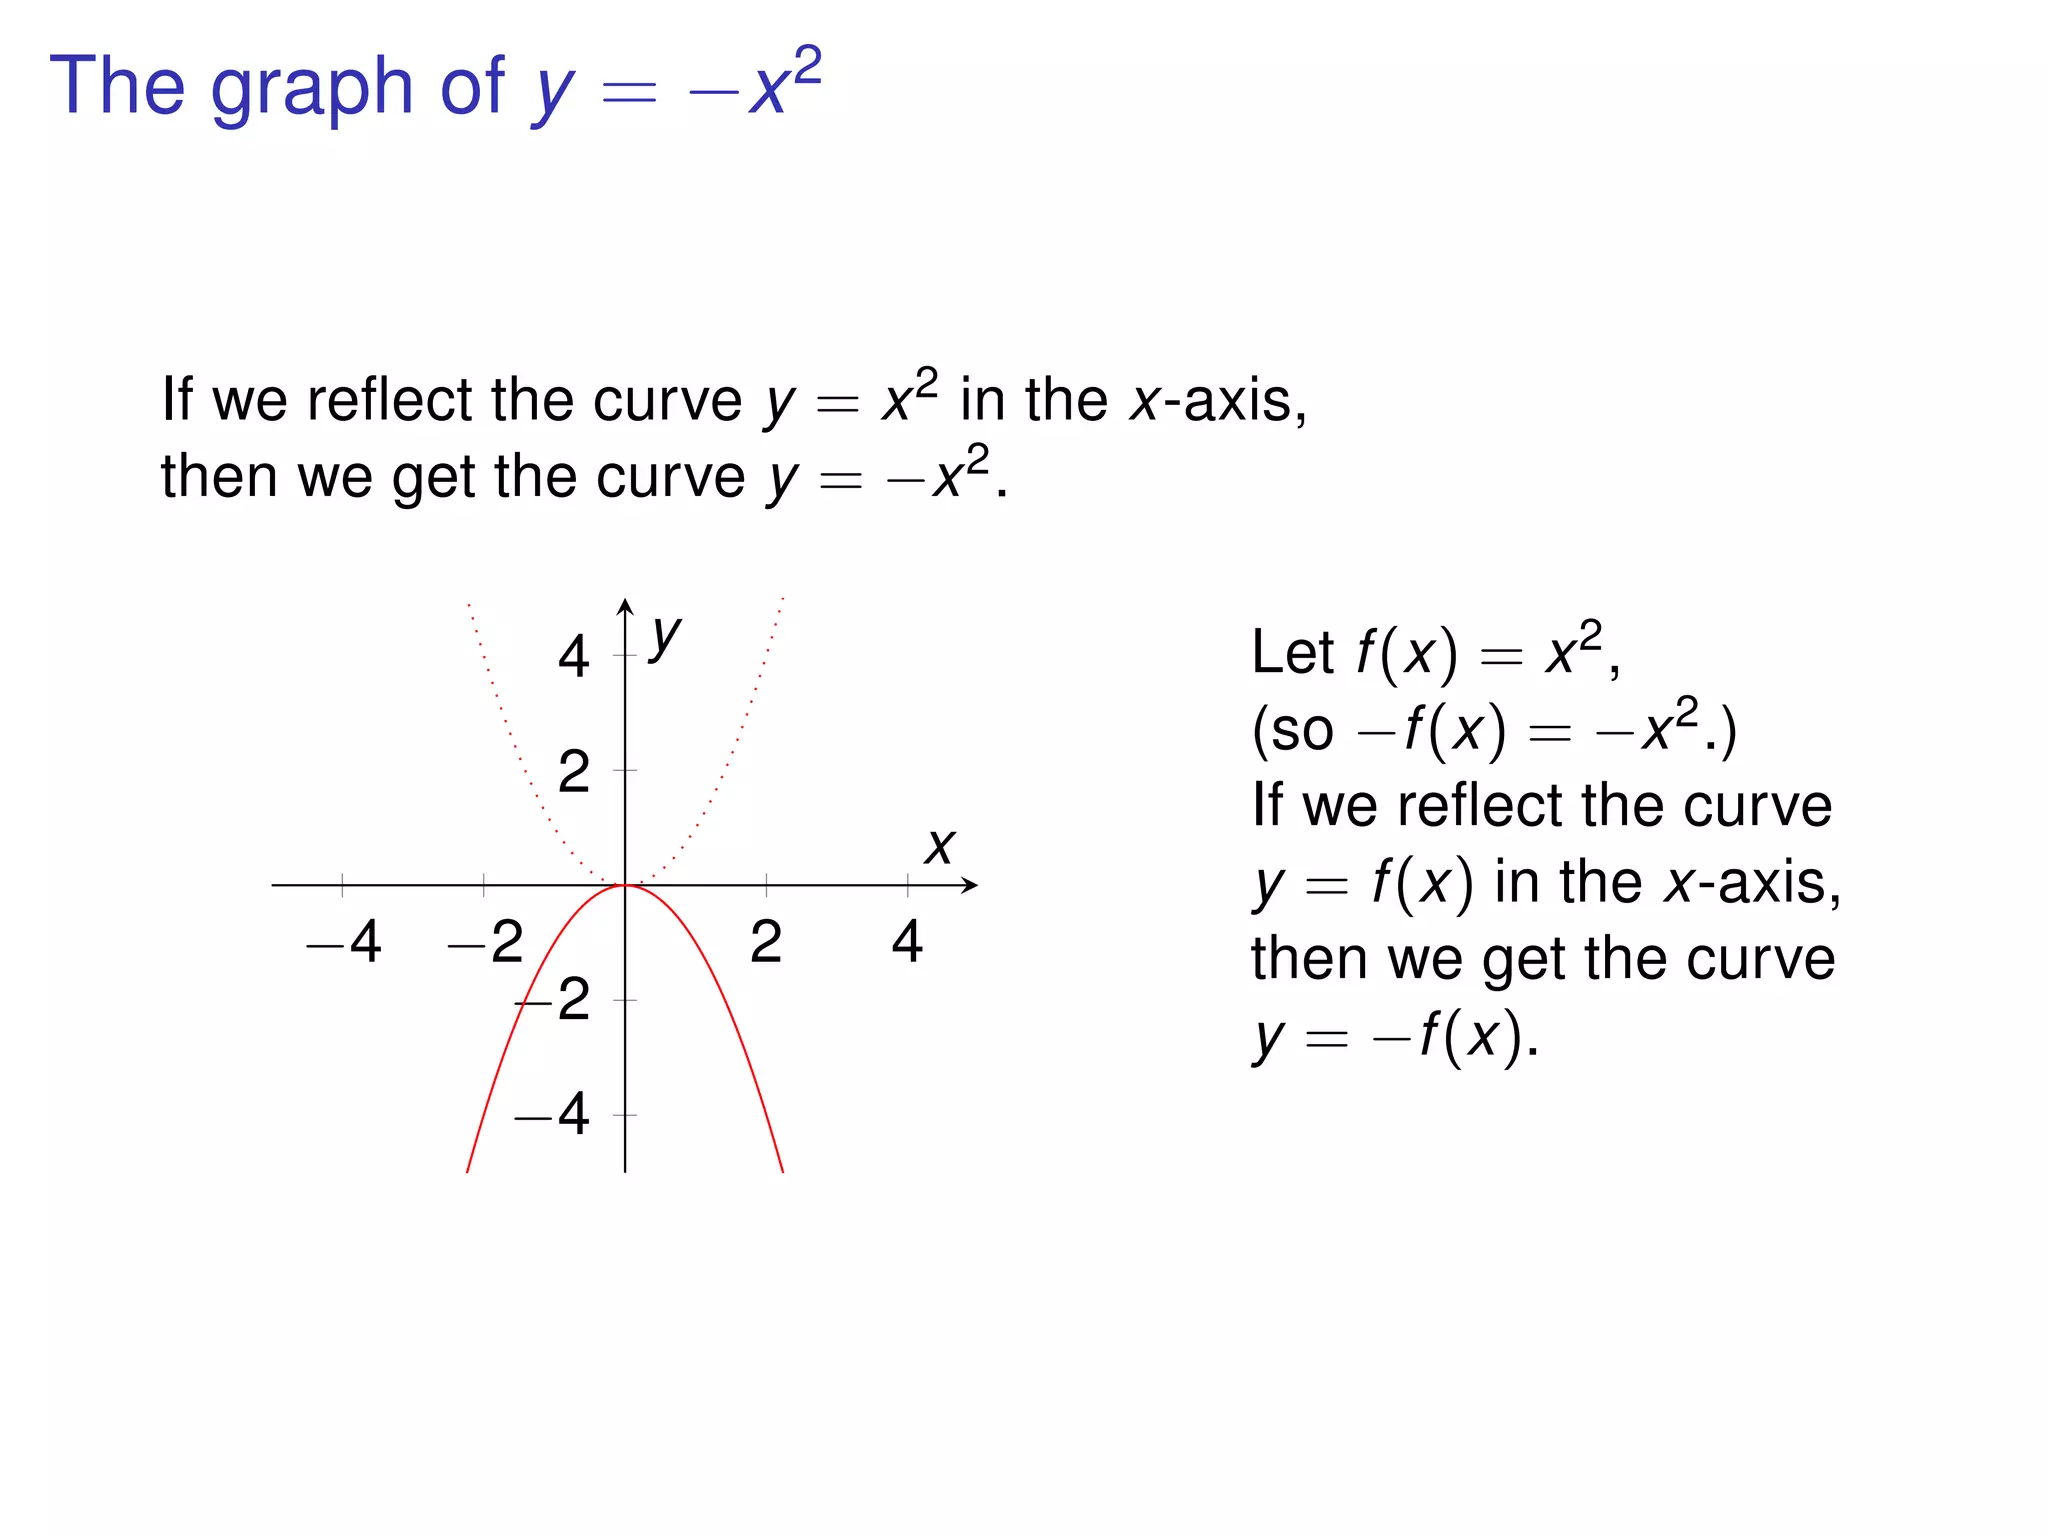
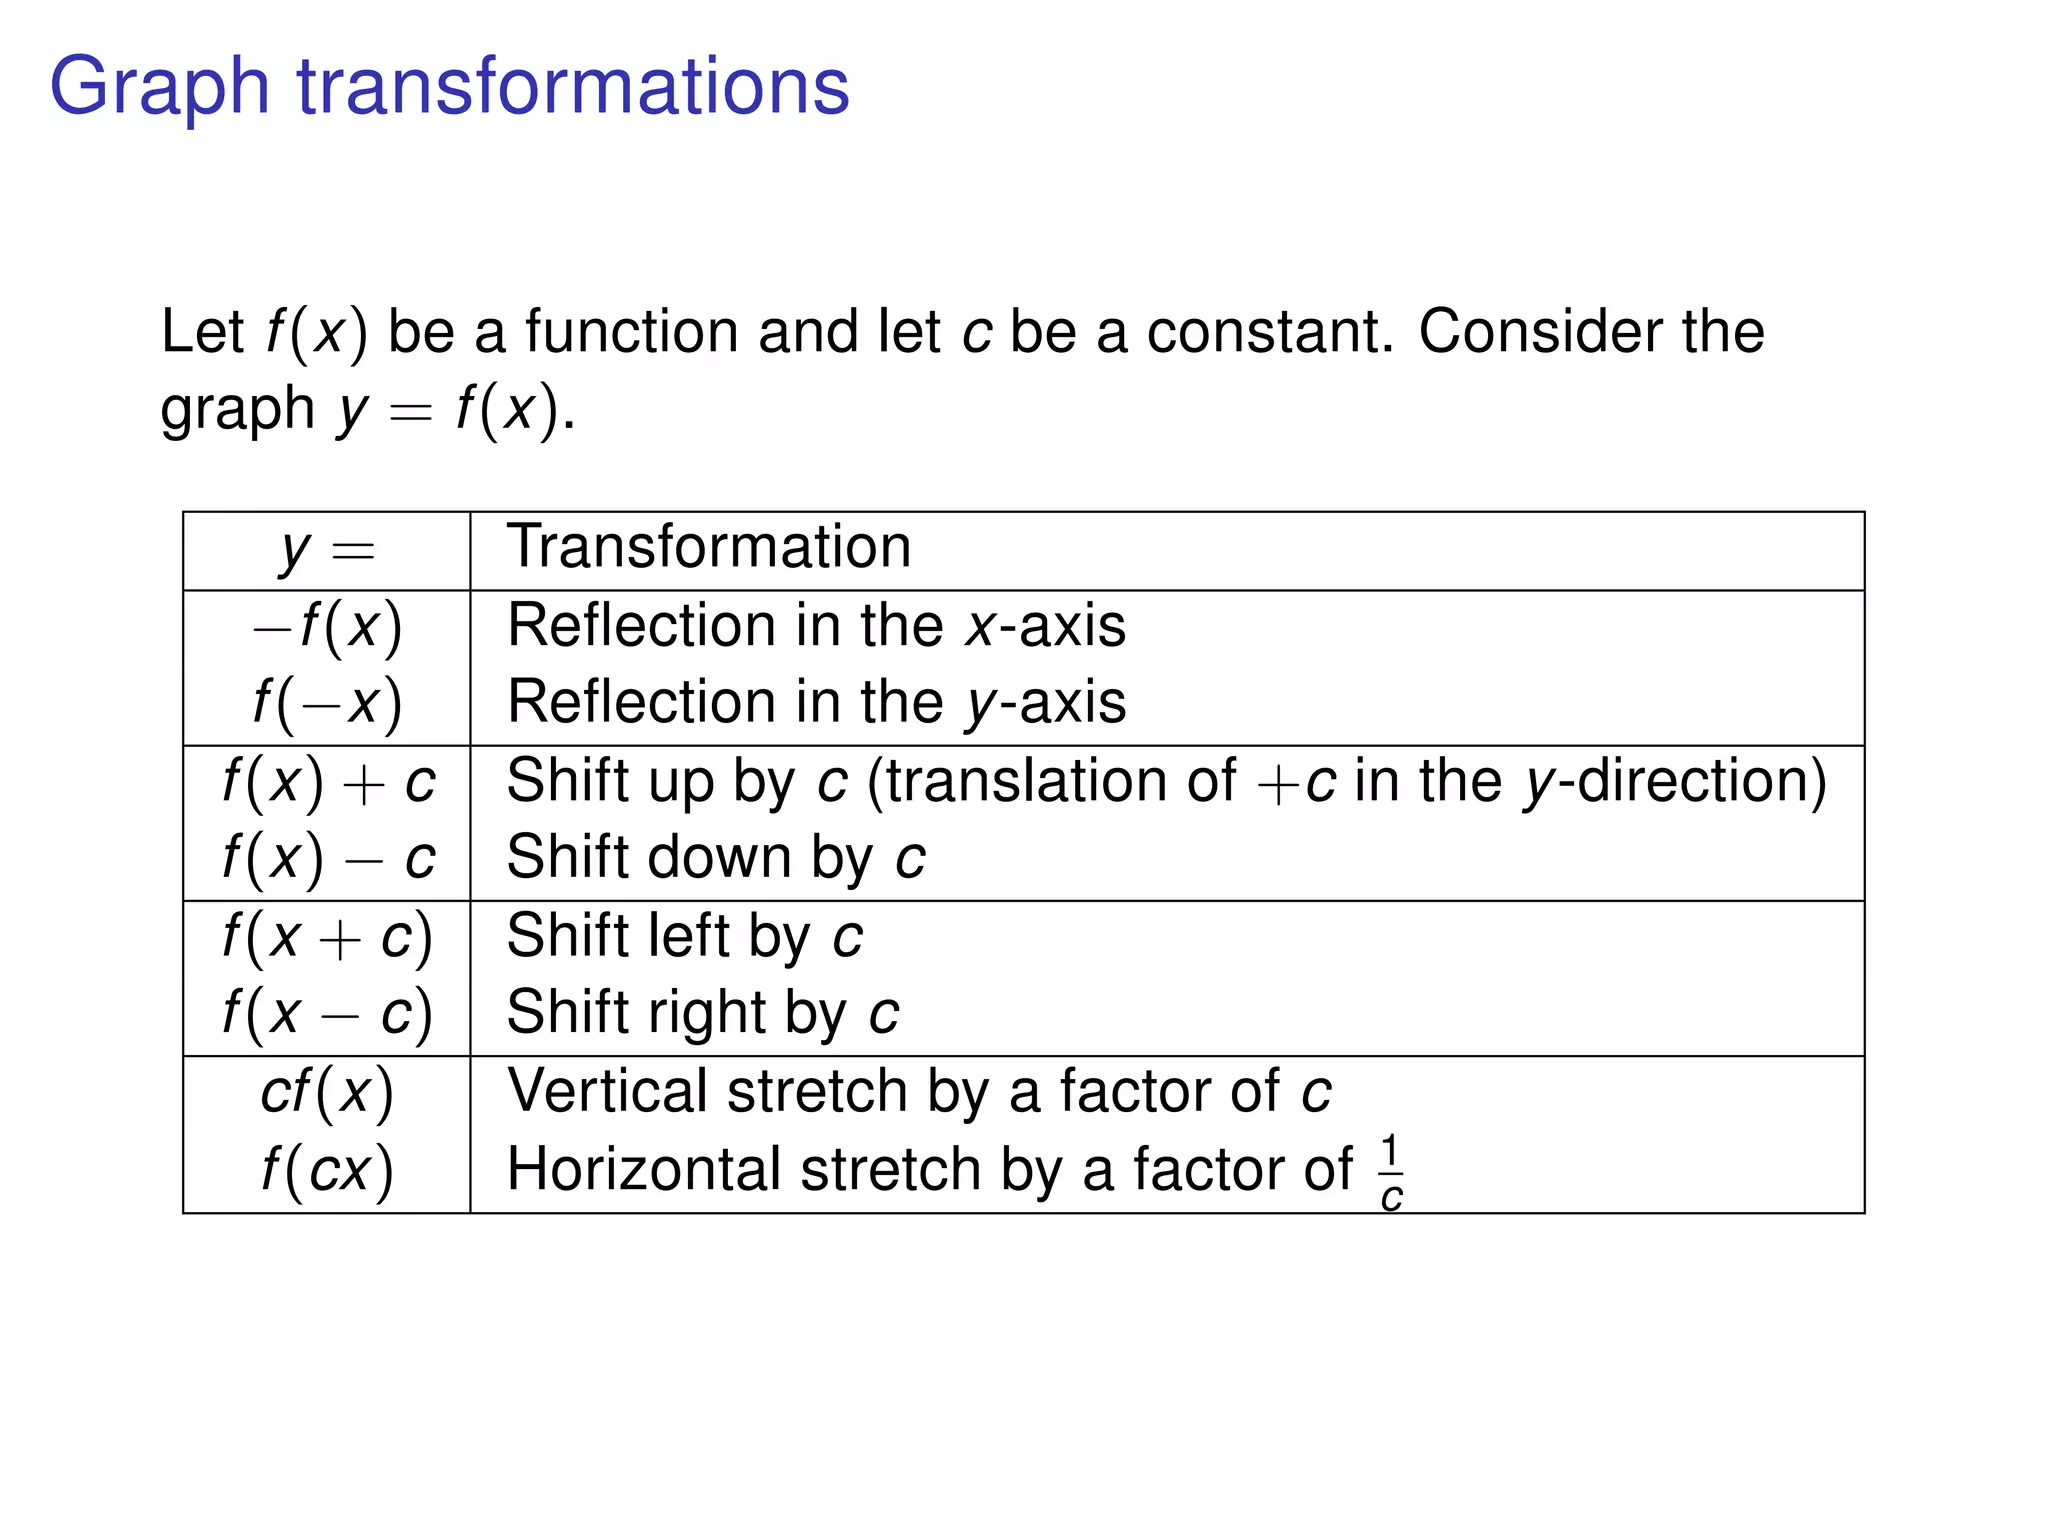
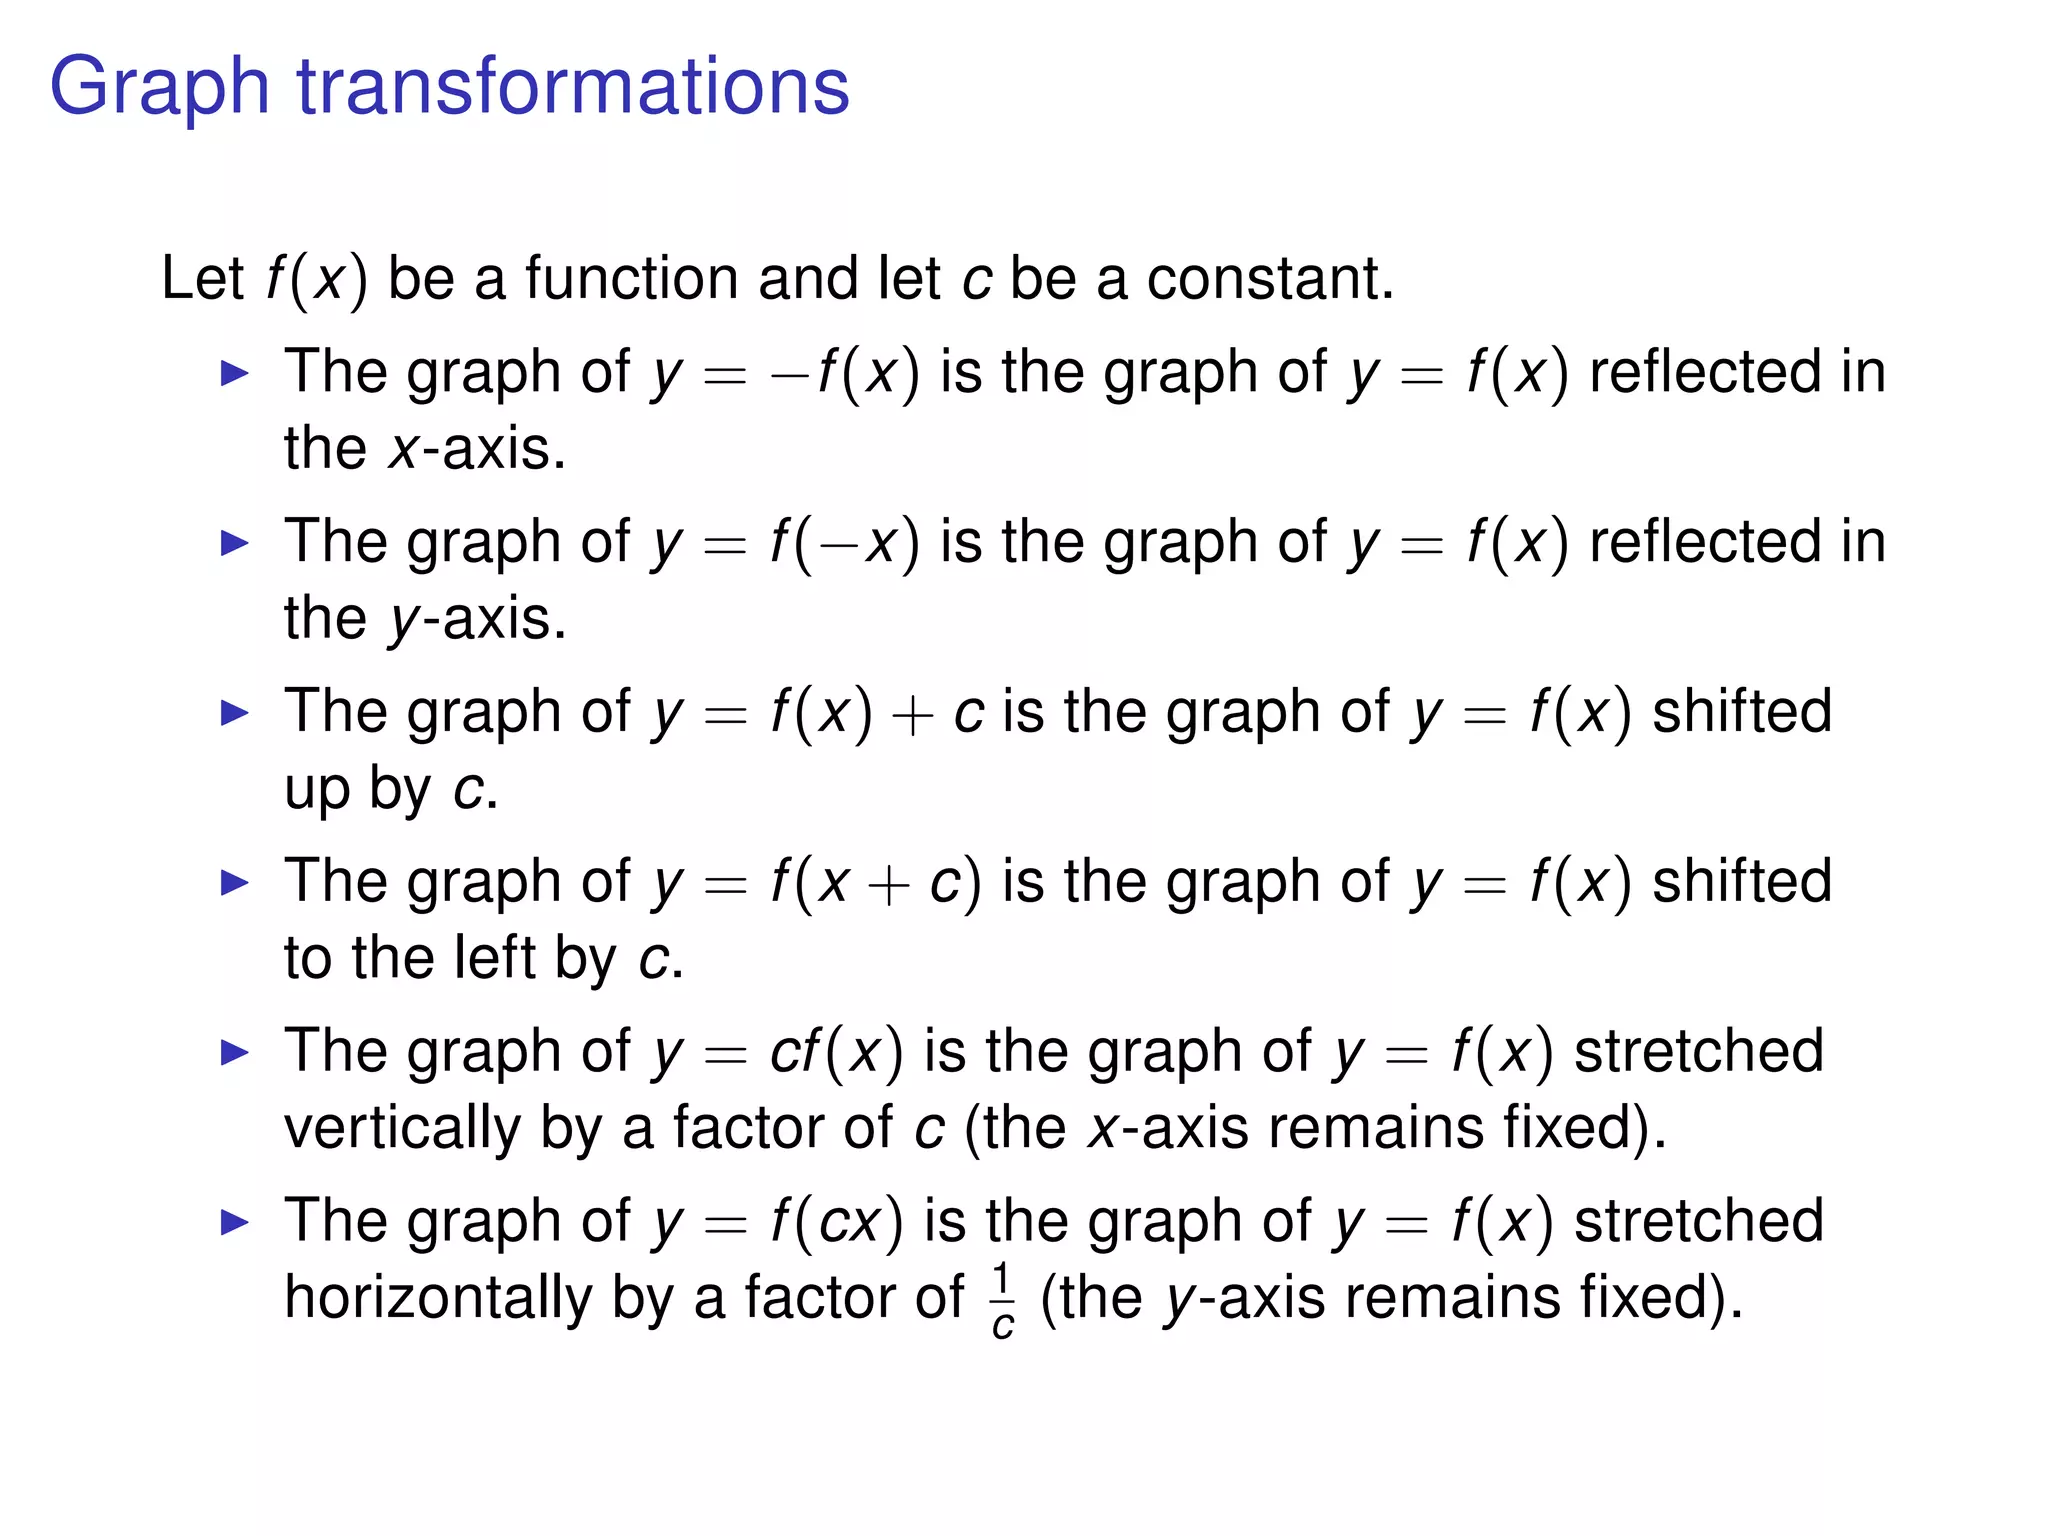
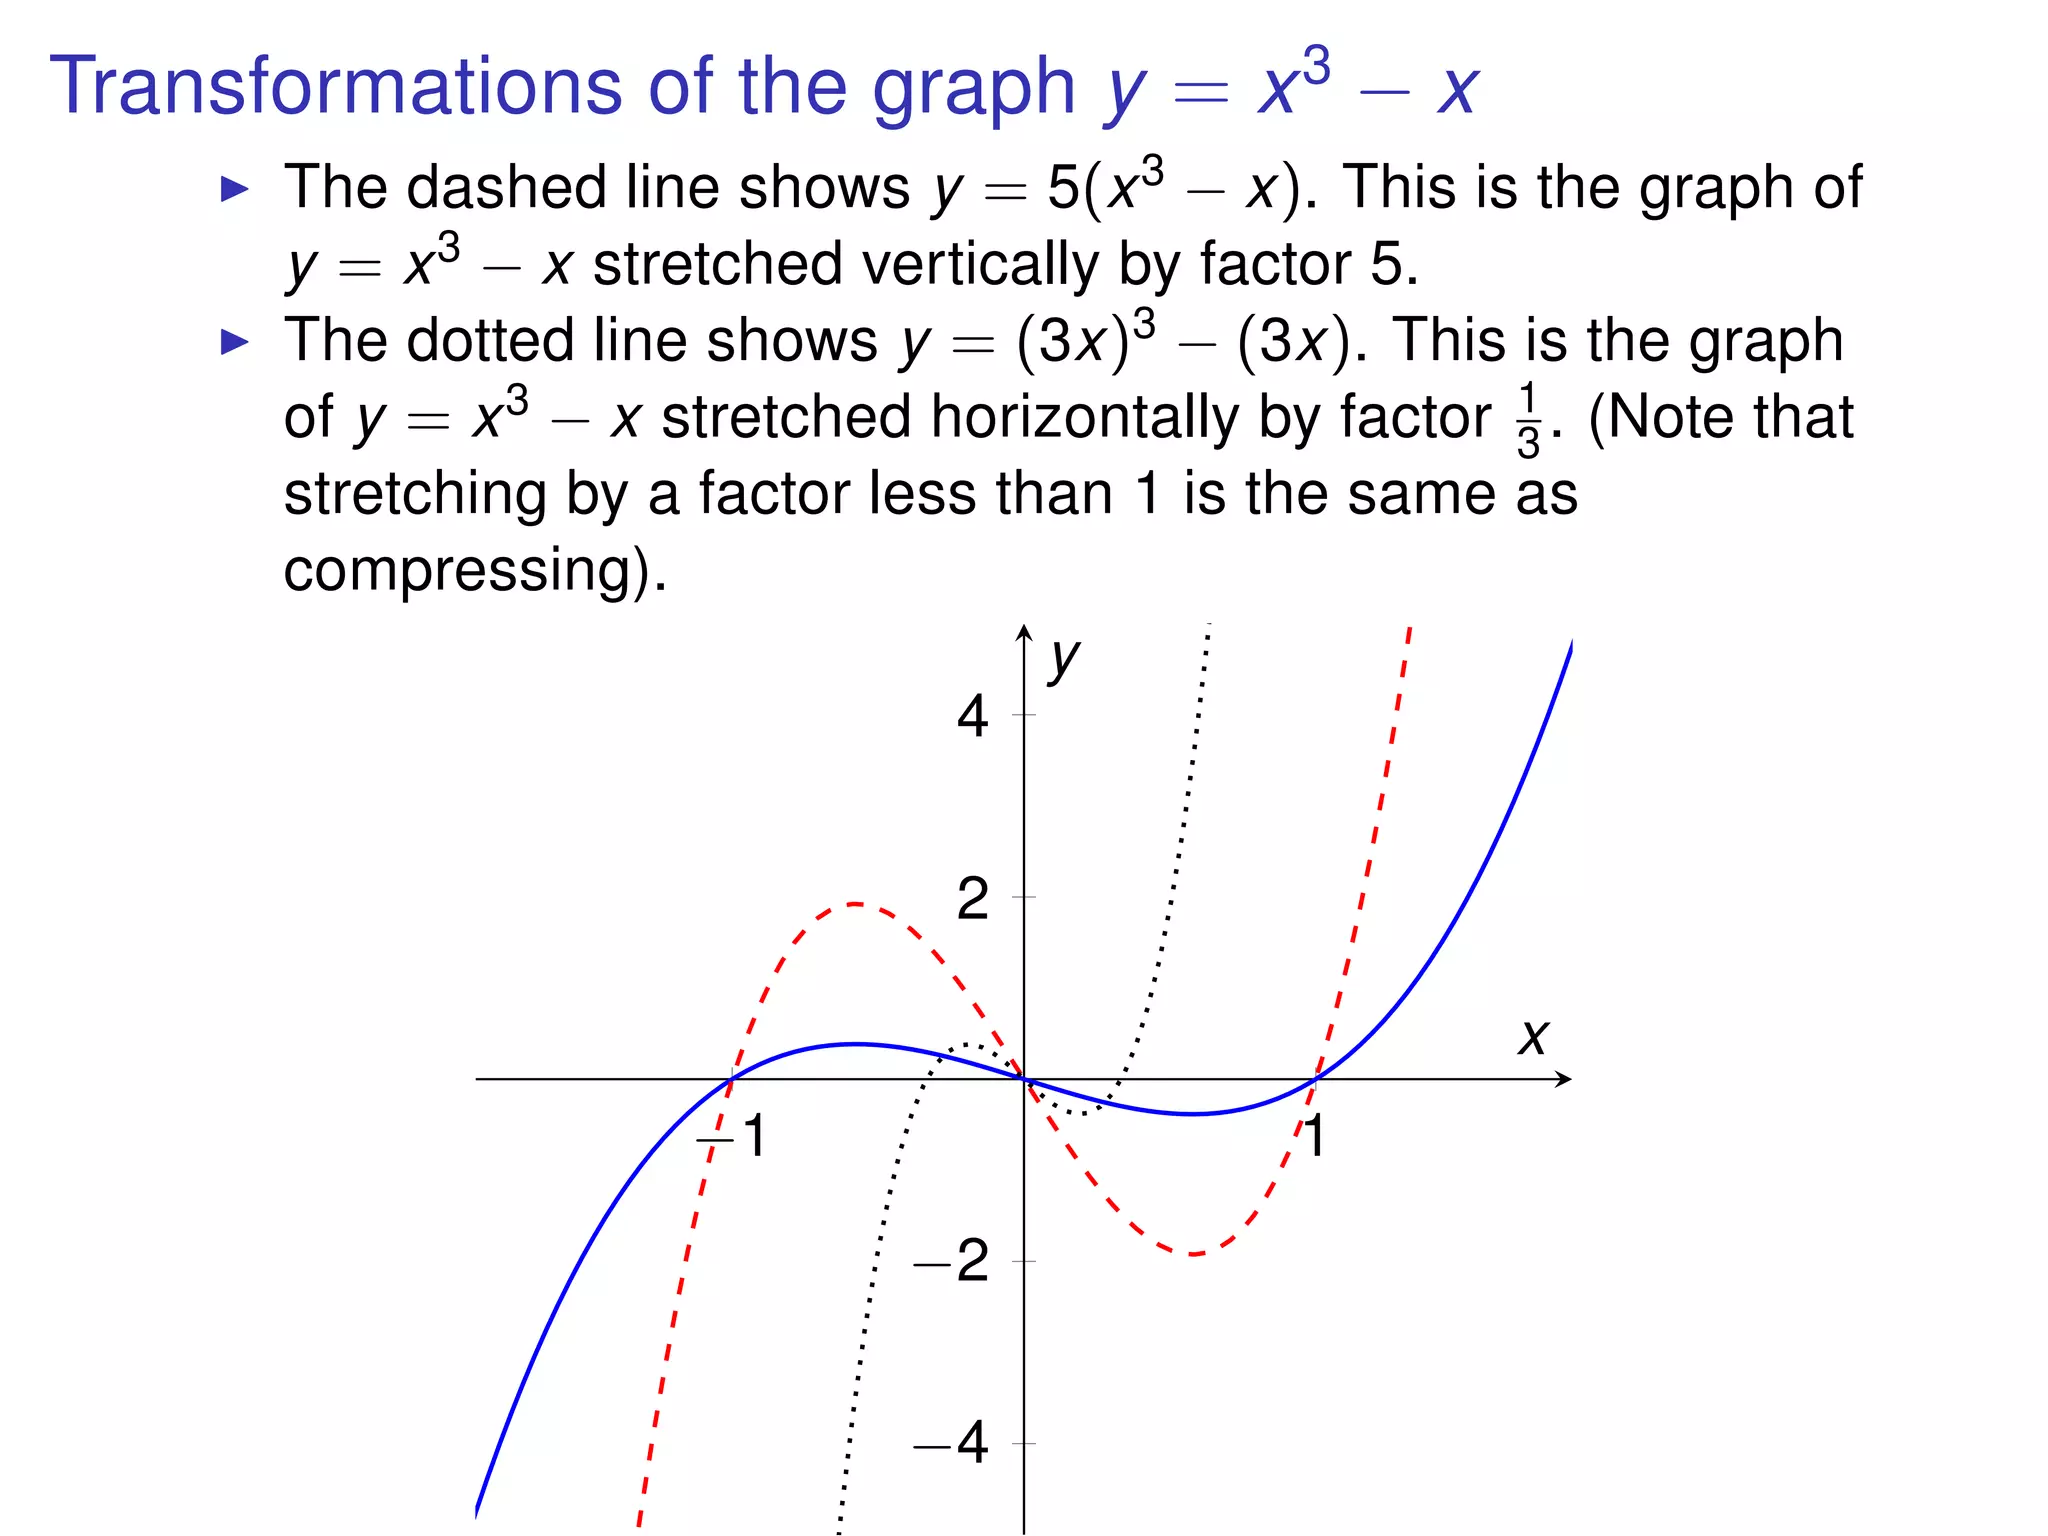
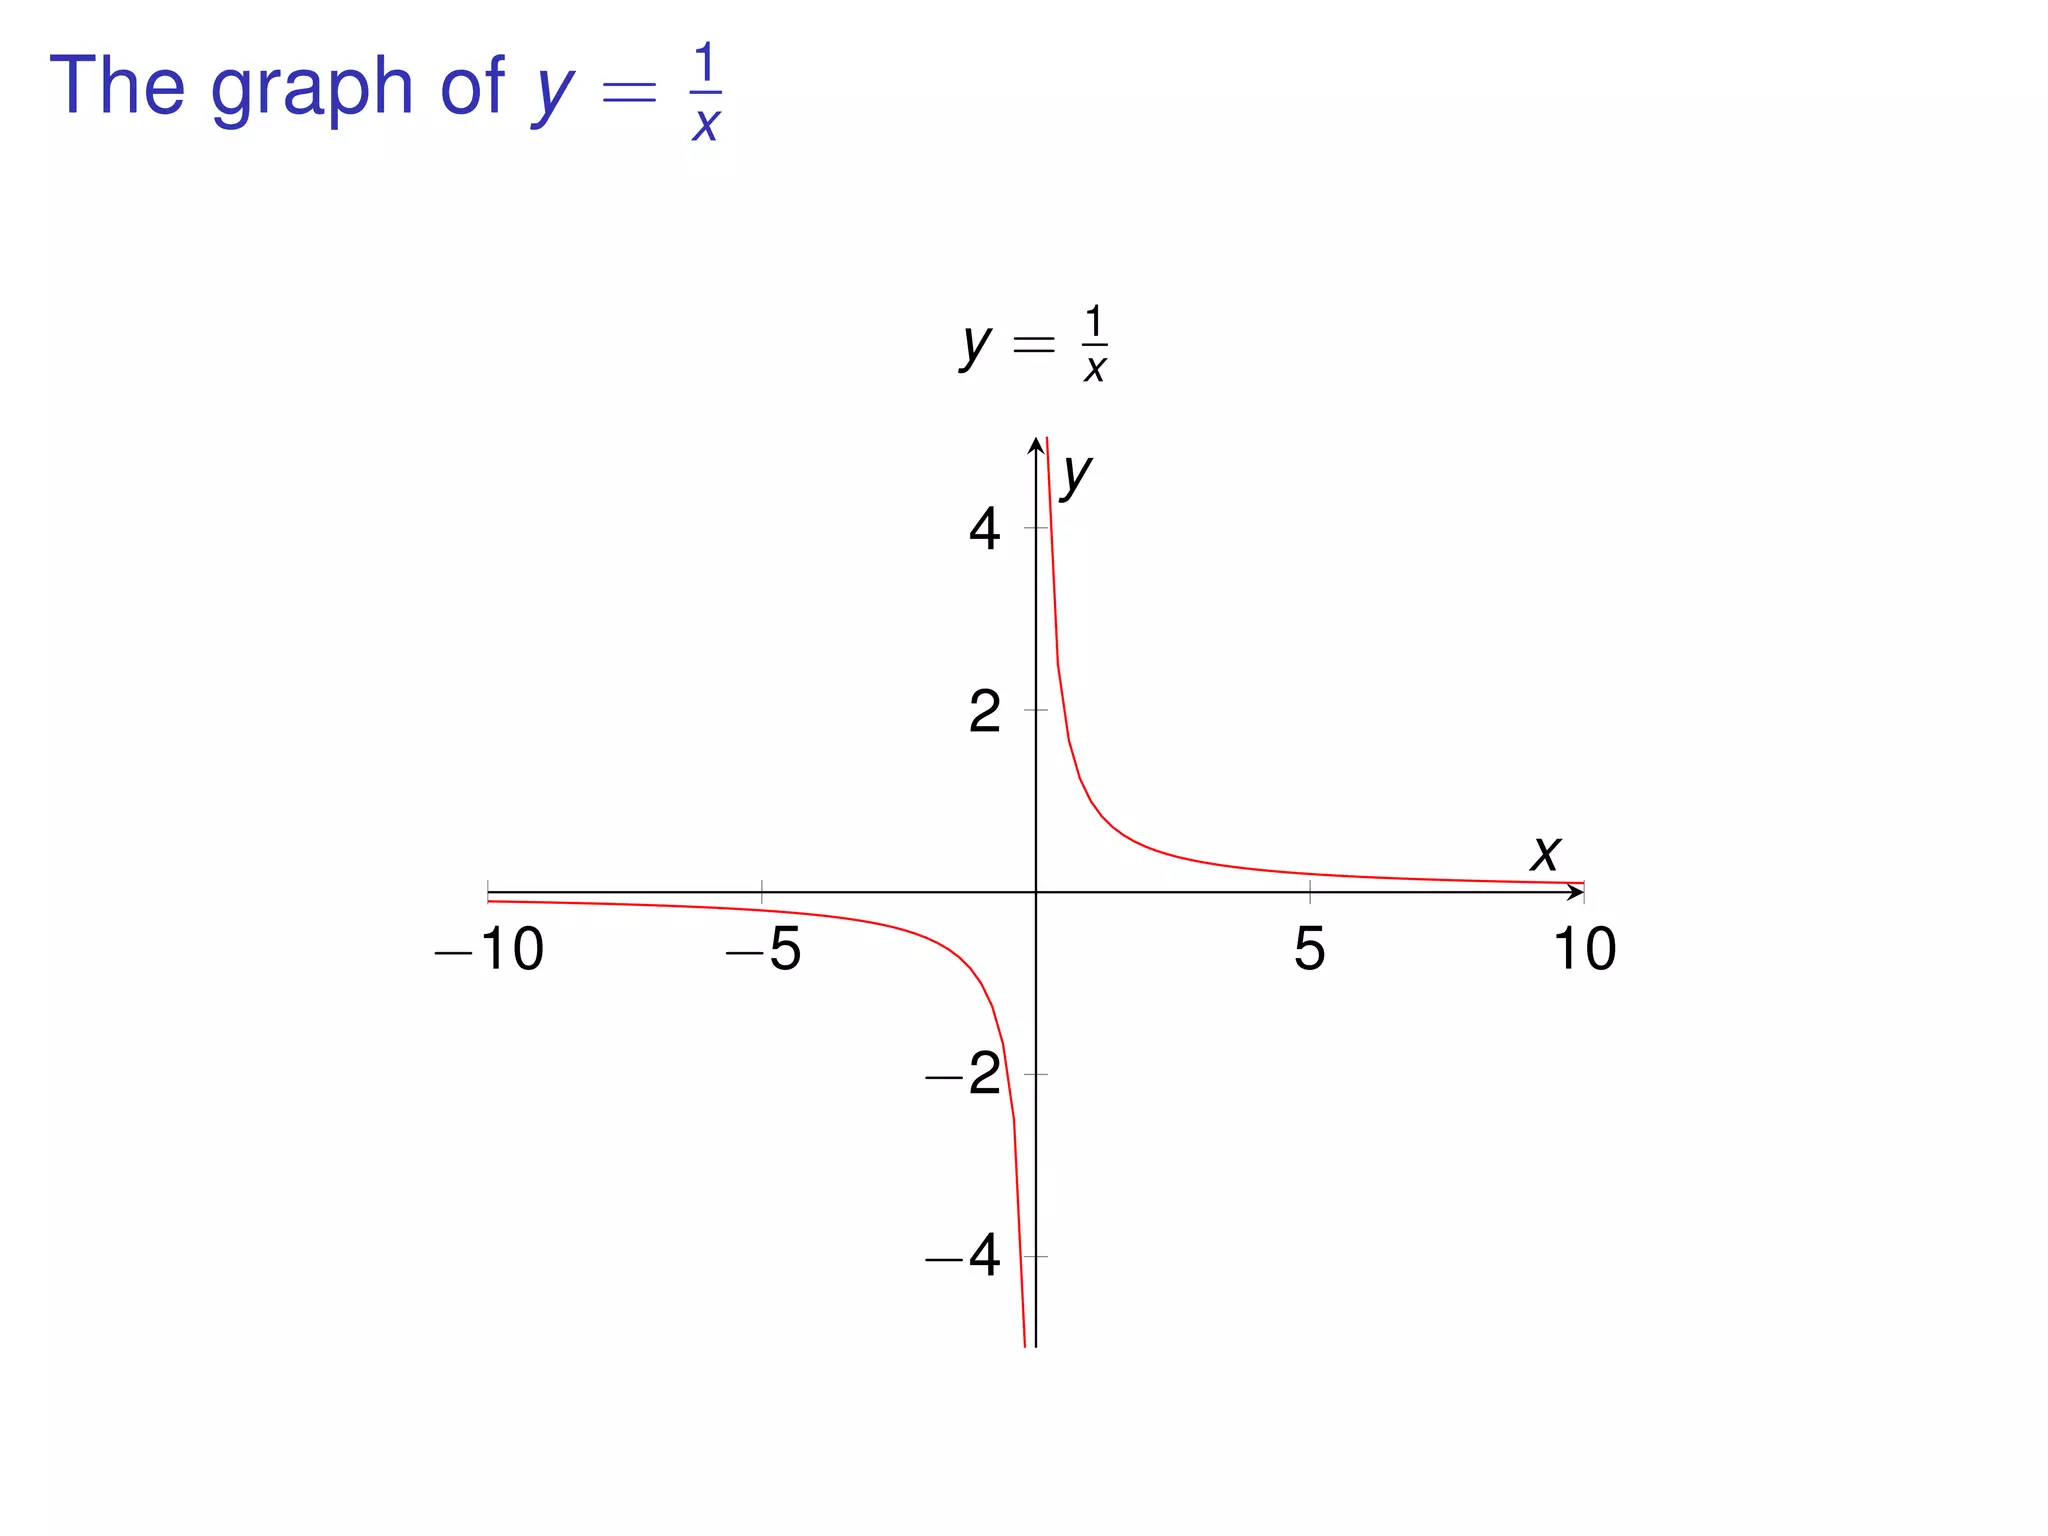
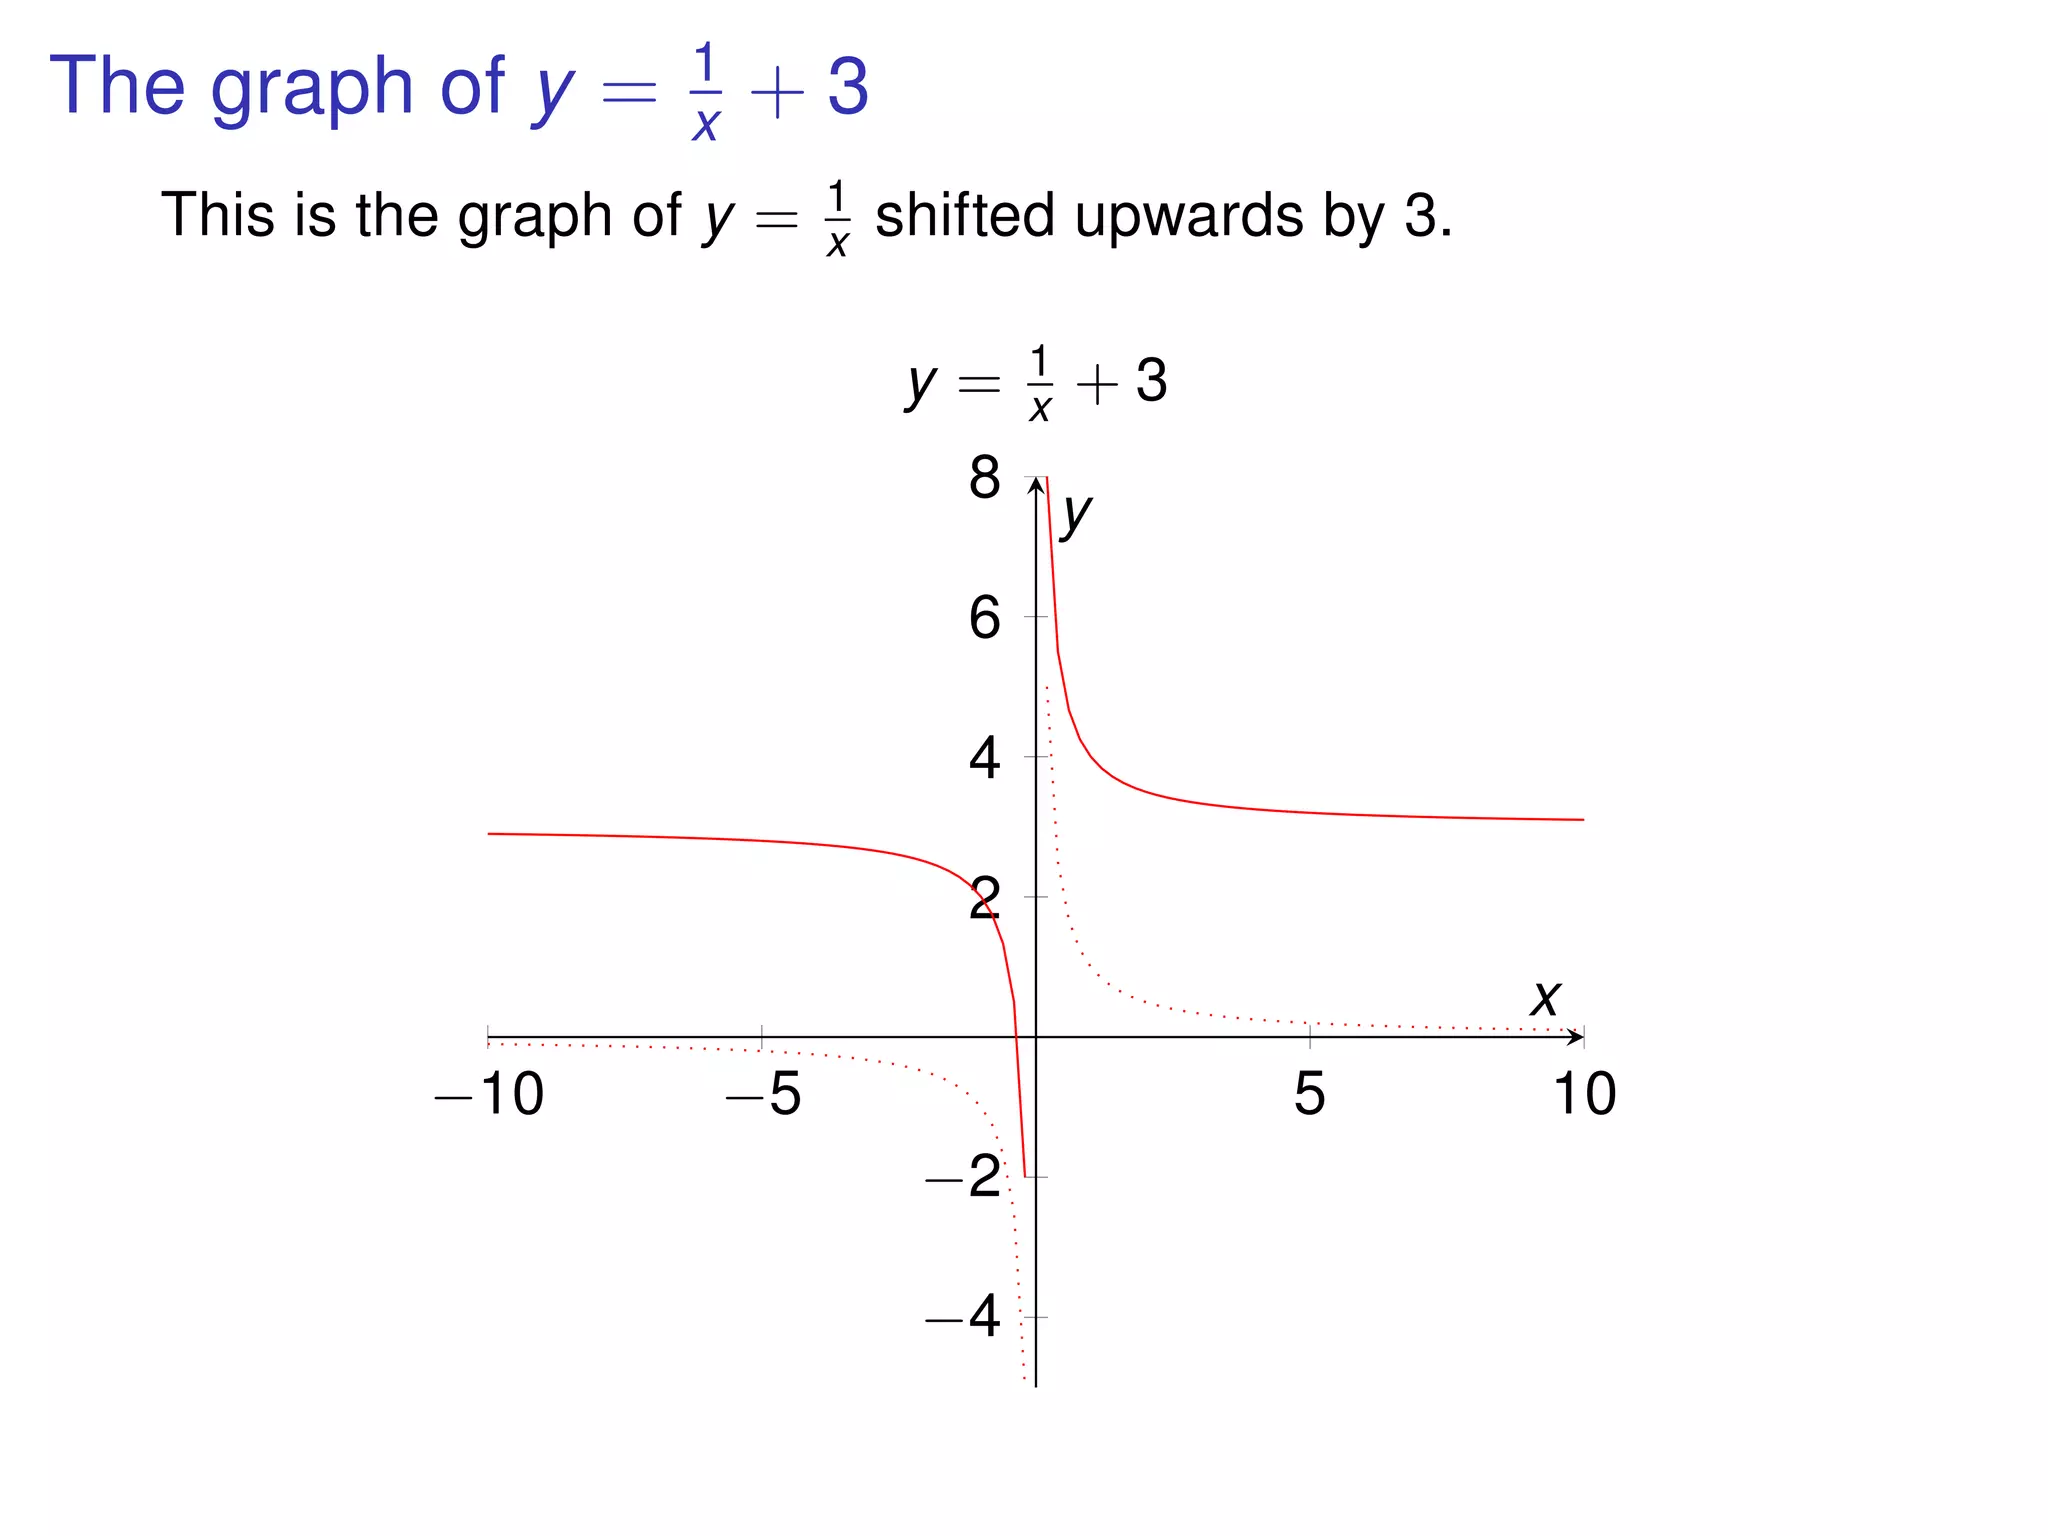
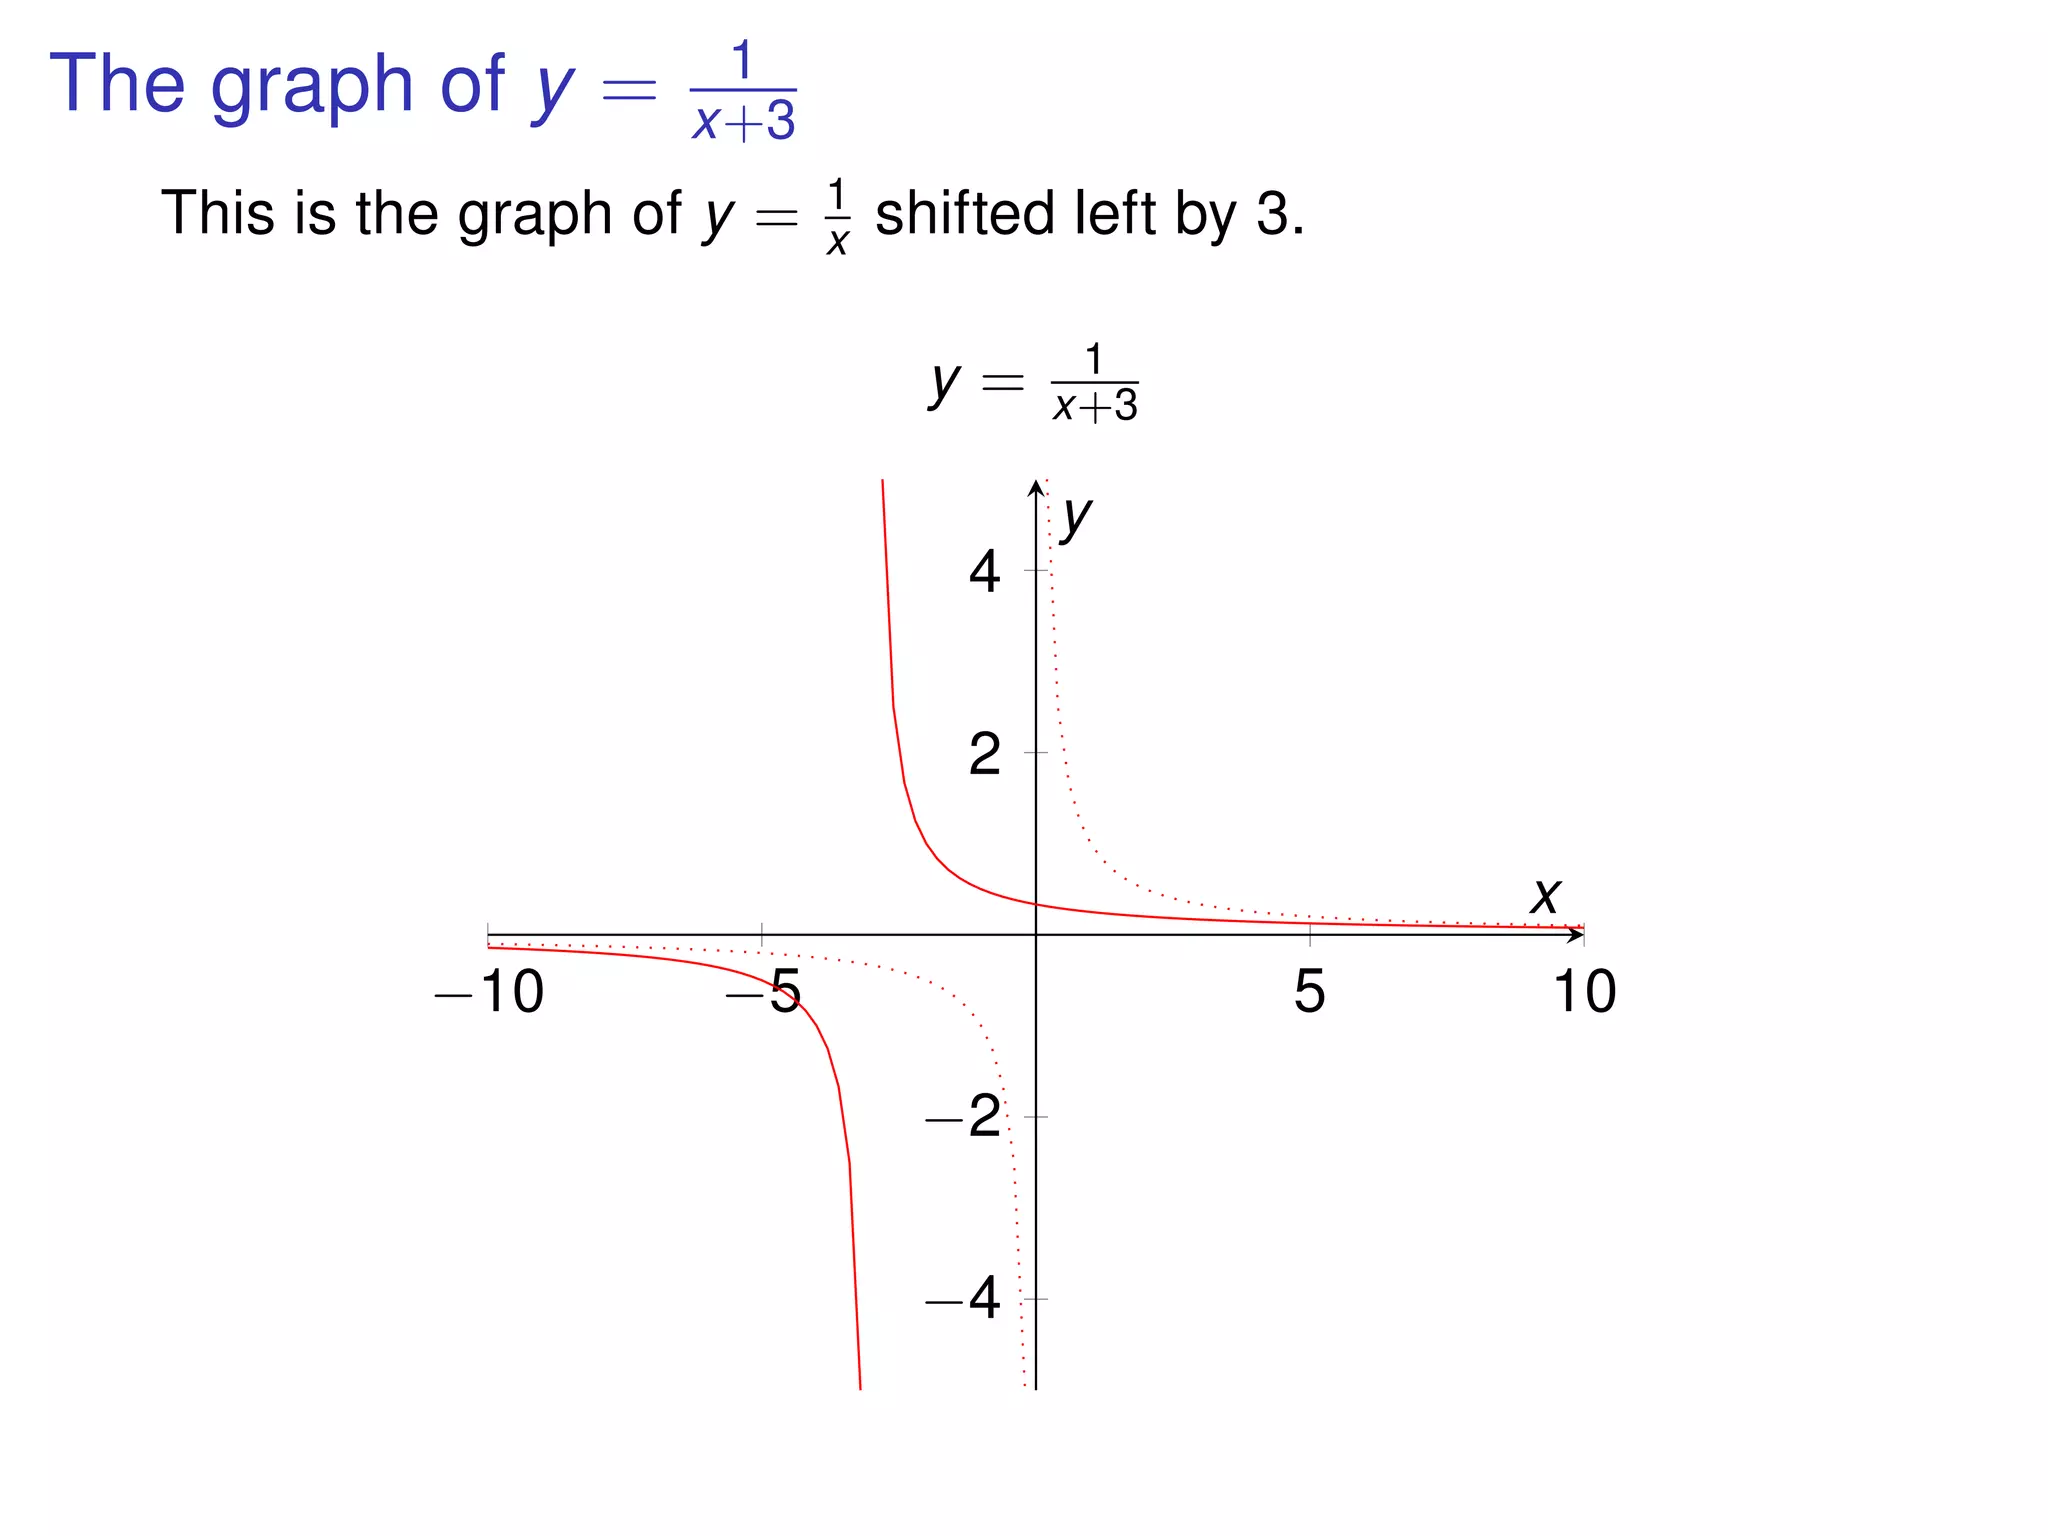
1) The document discusses graph transformations of functions including shifting curves vertically or horizontally, reflecting in the x-axis or y-axis, and stretching or compressing graphs.
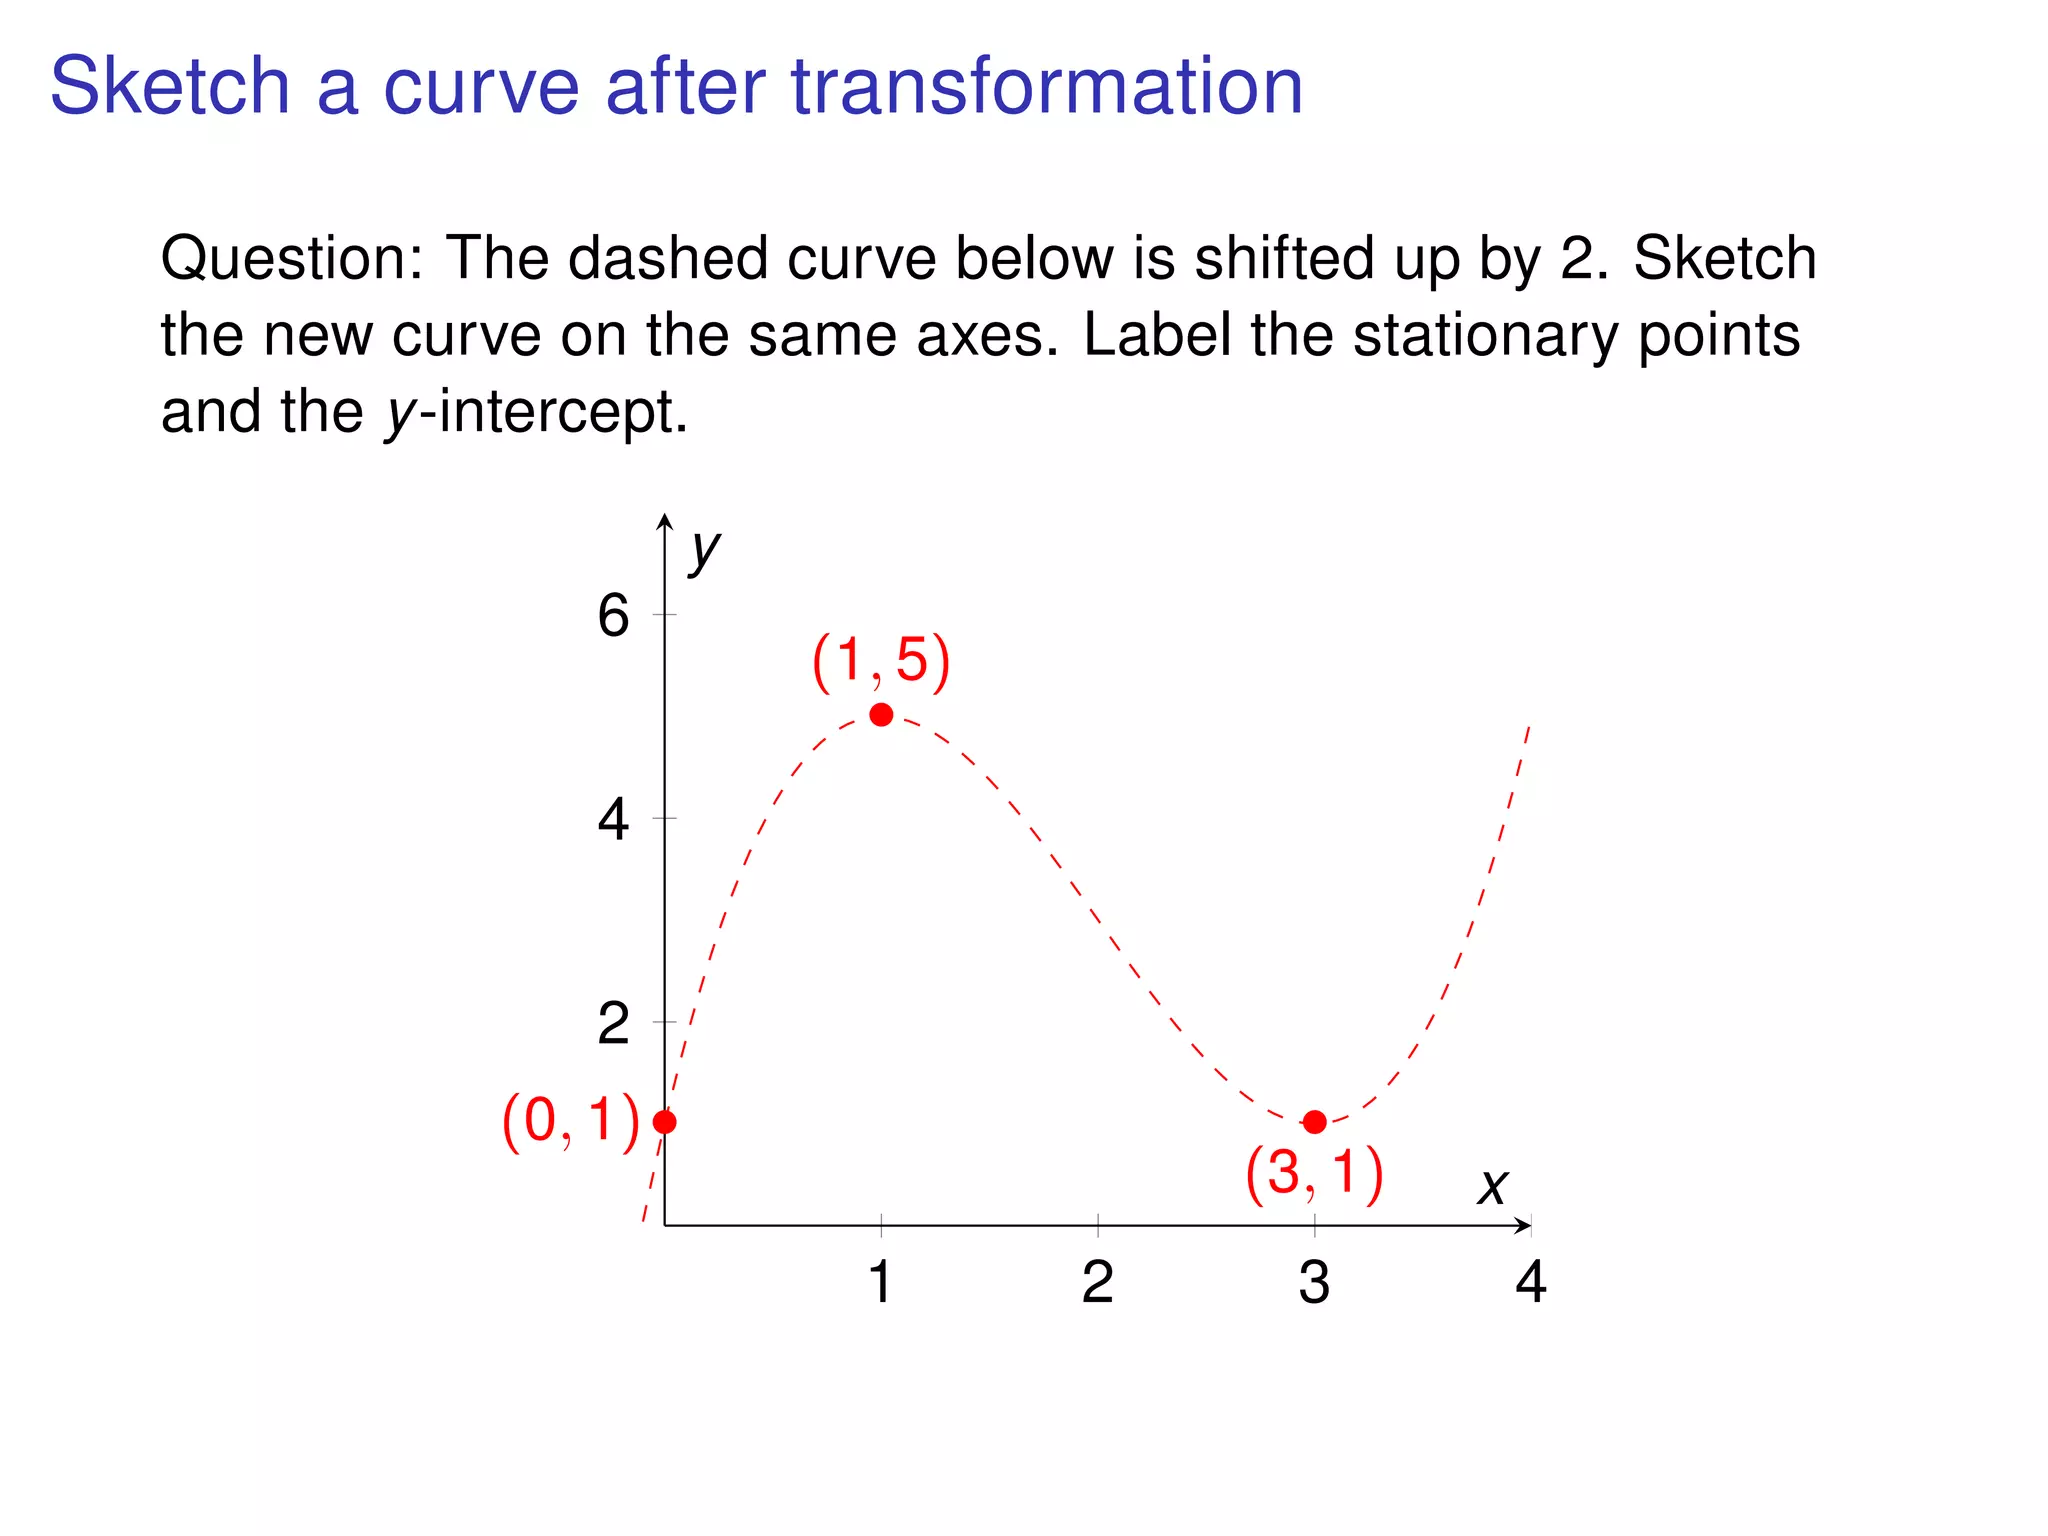
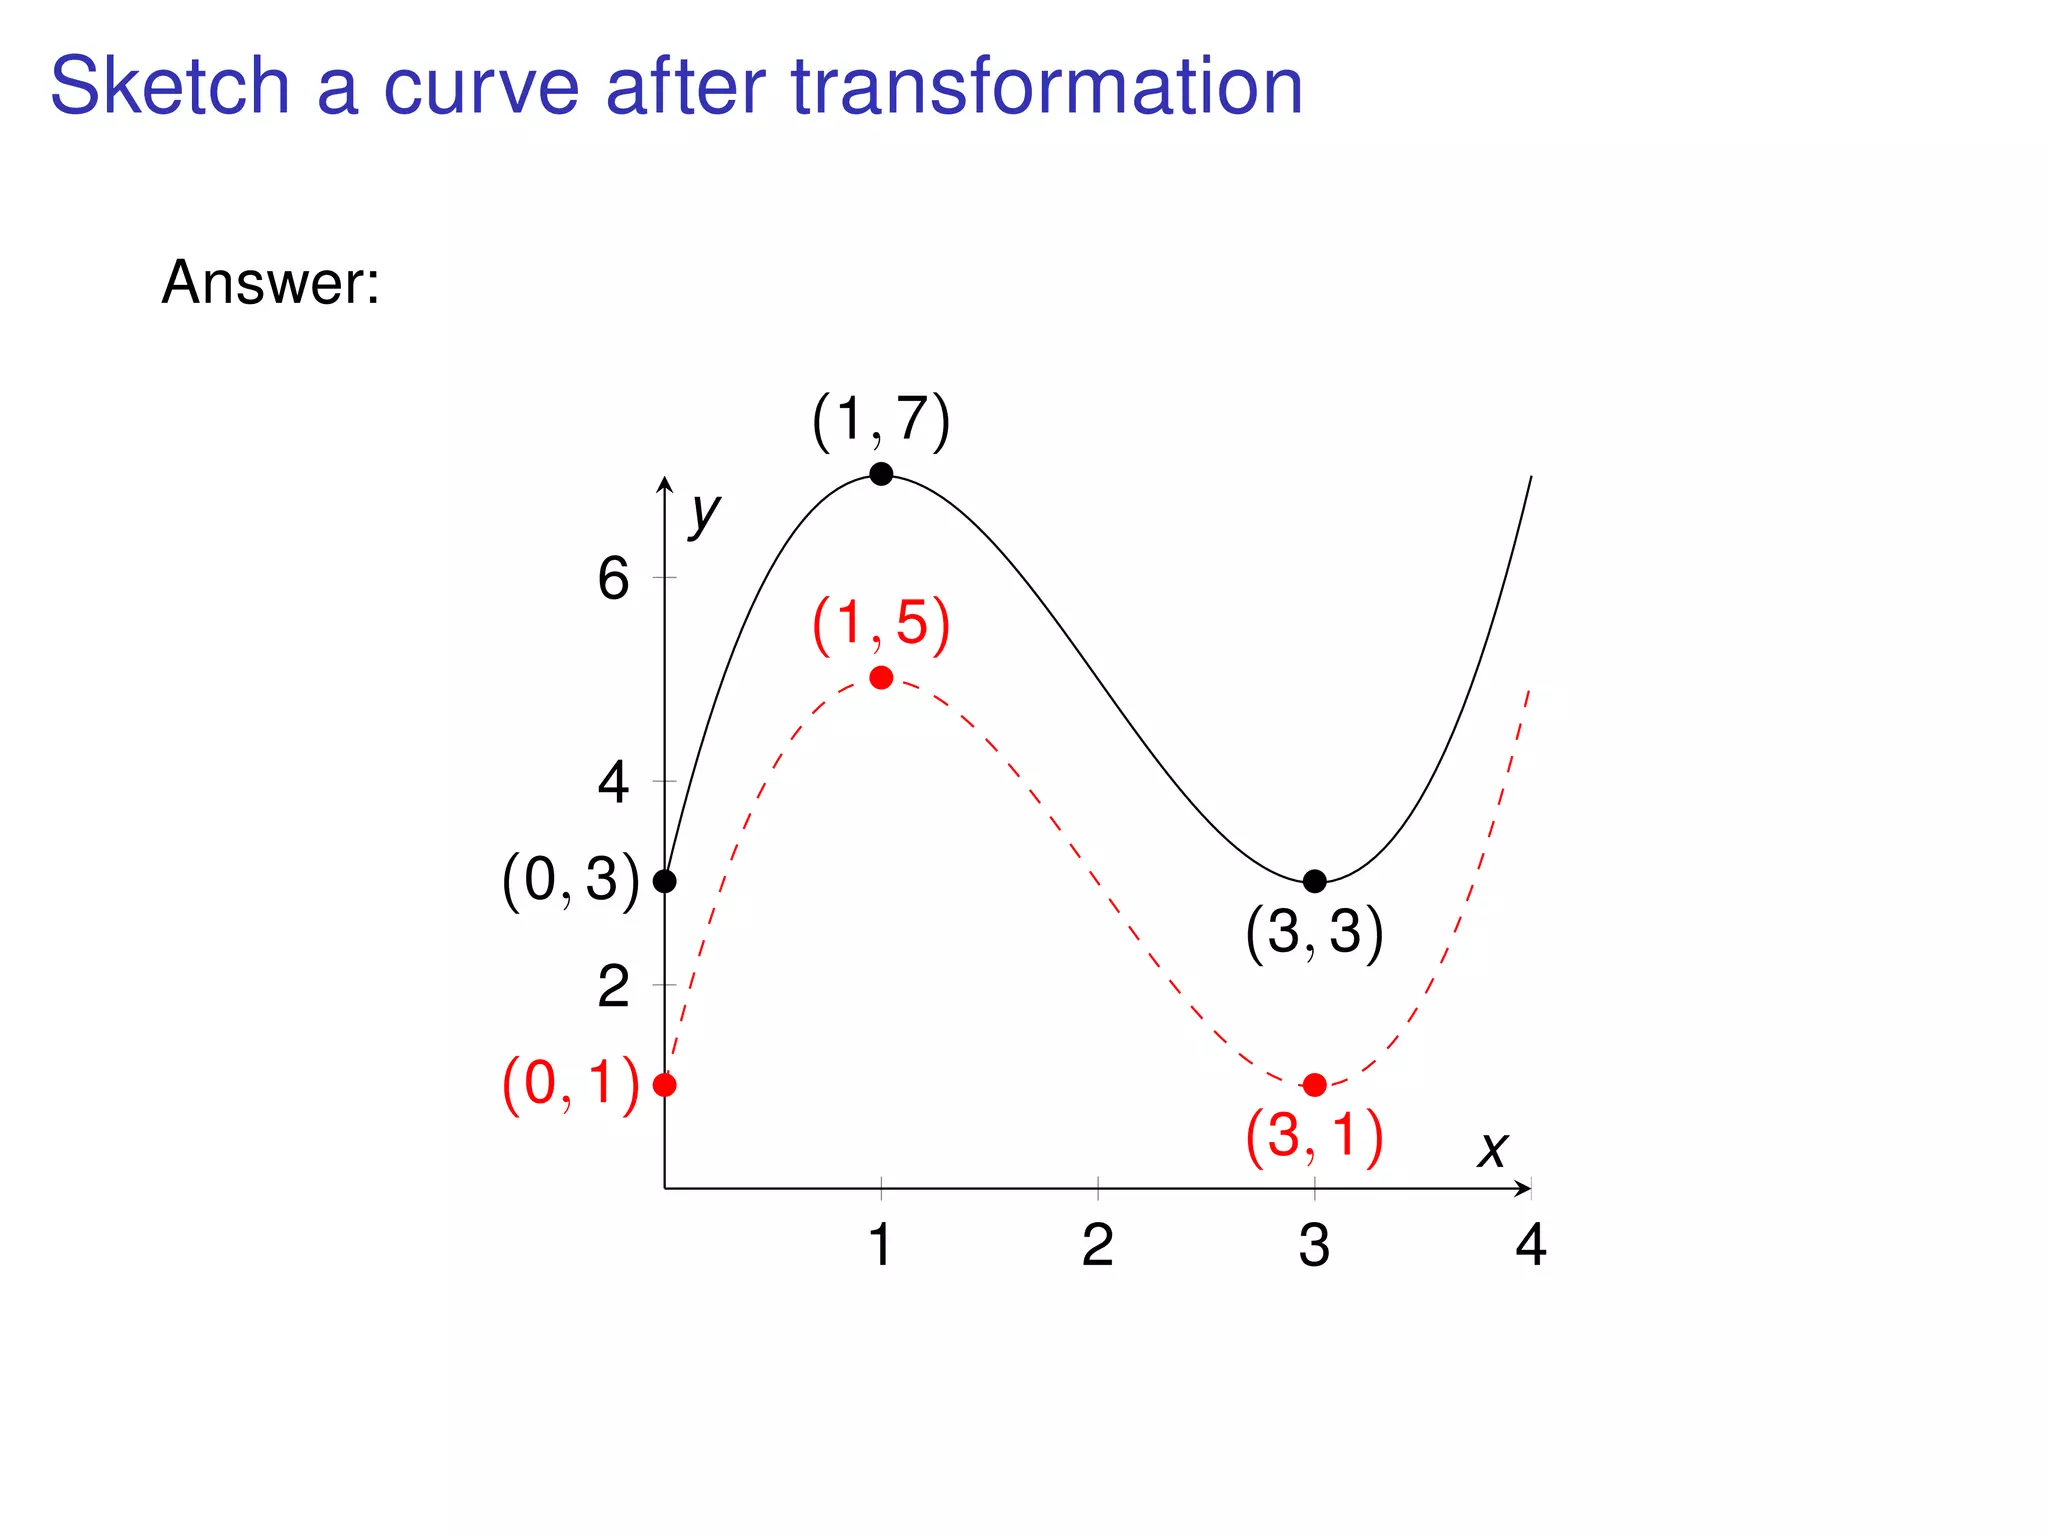
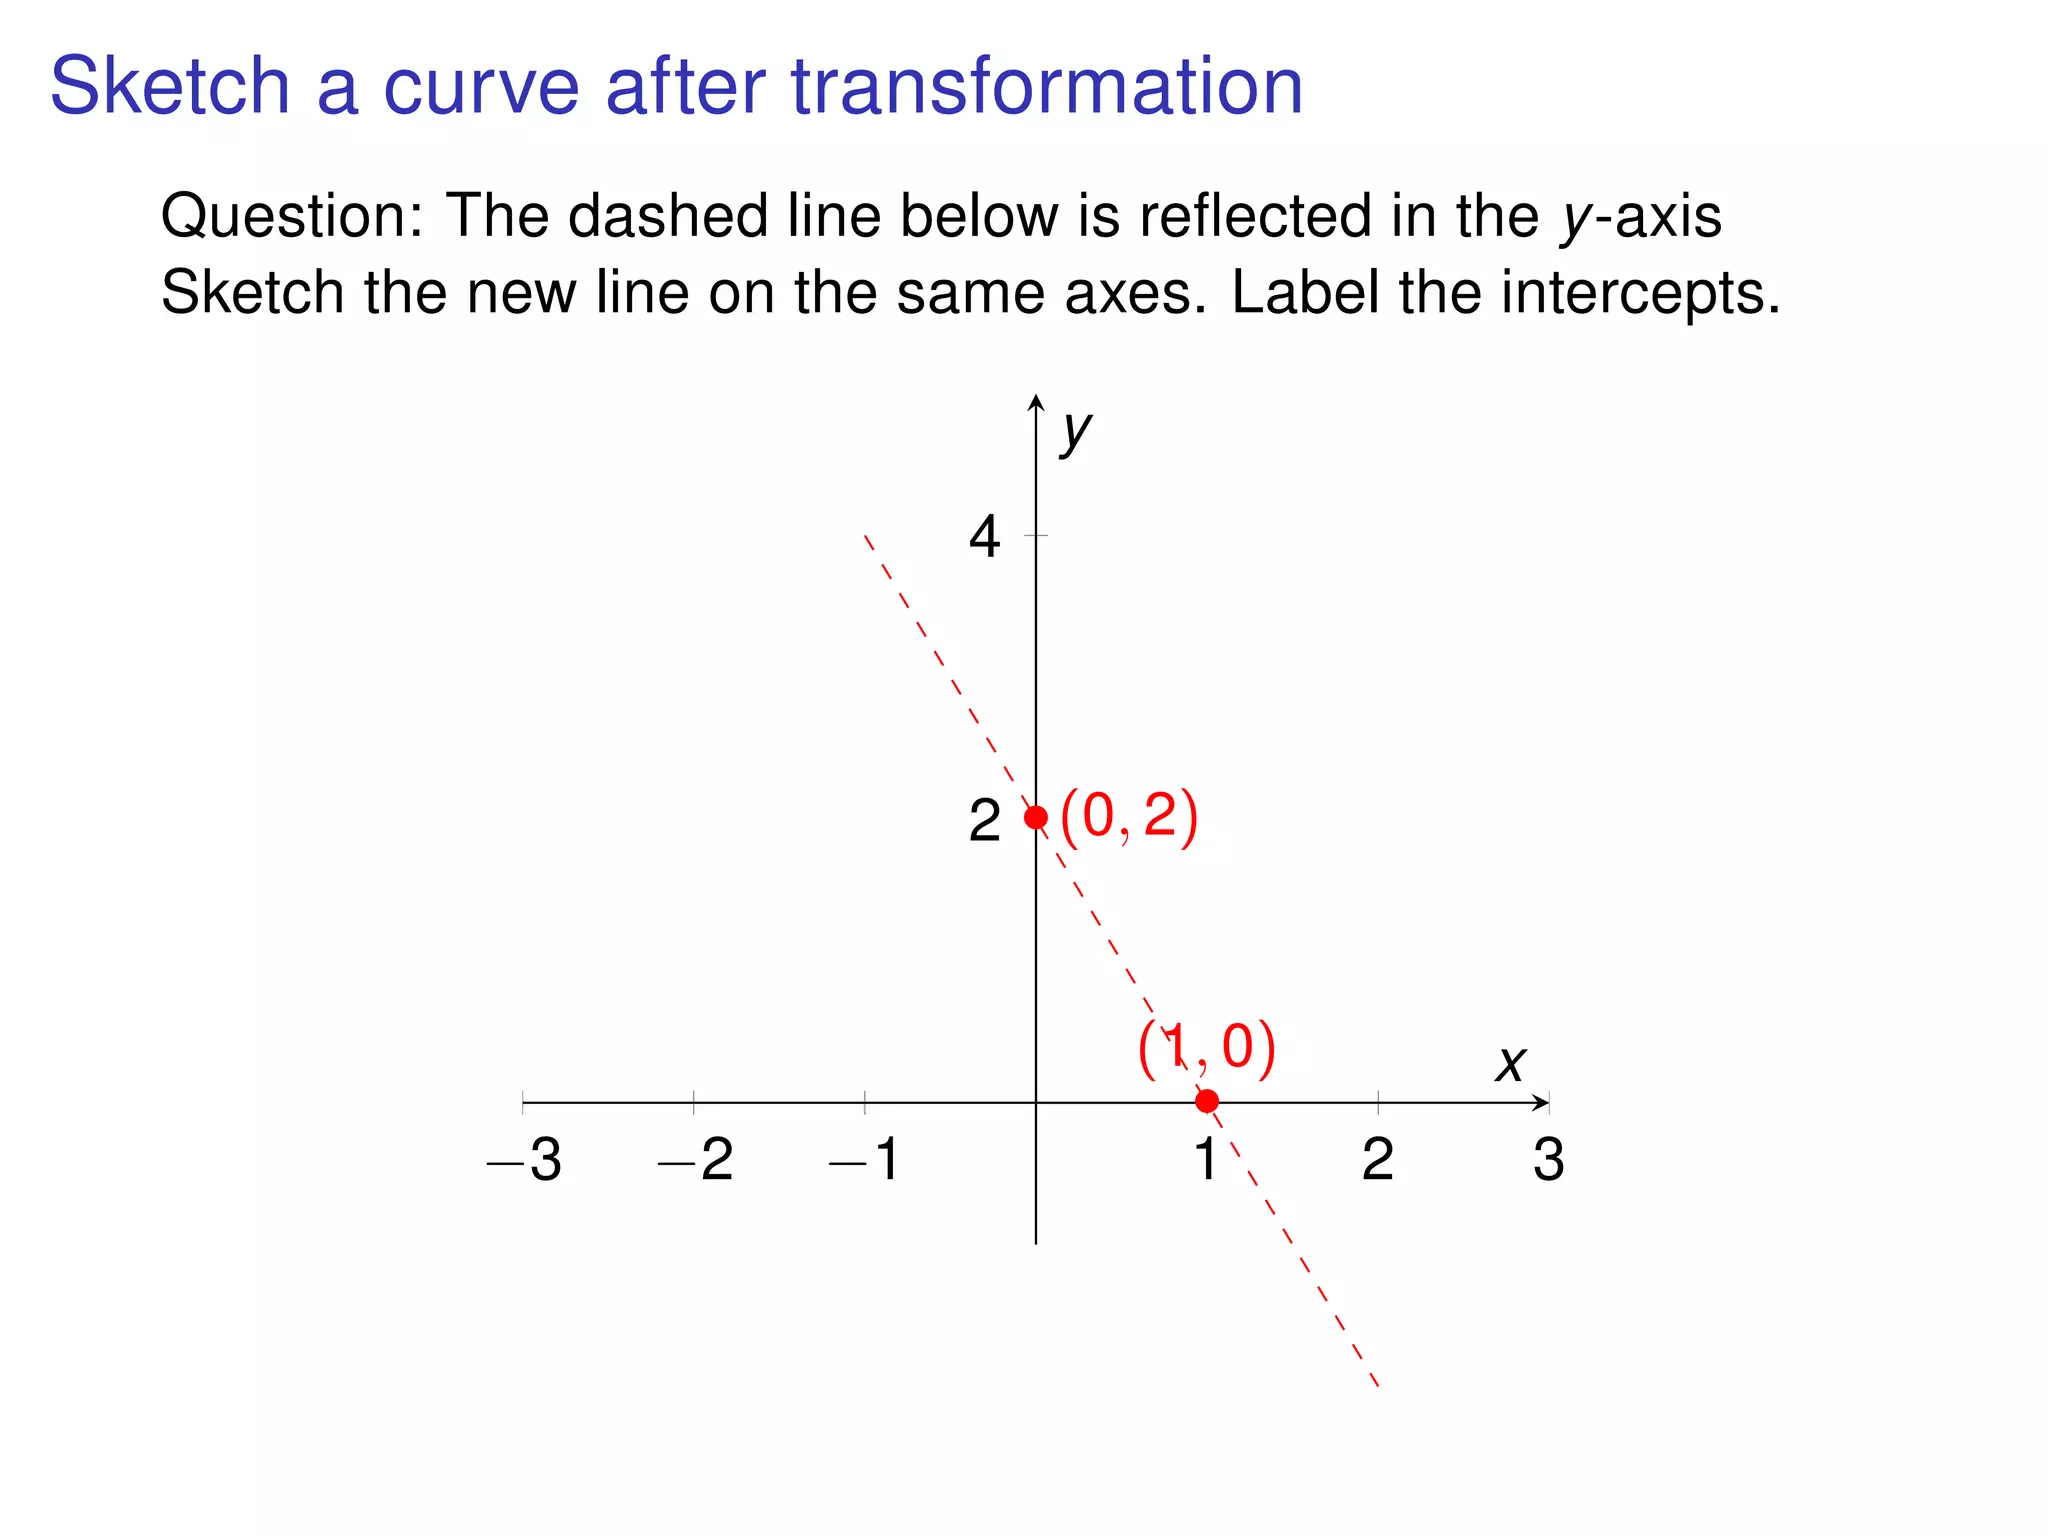
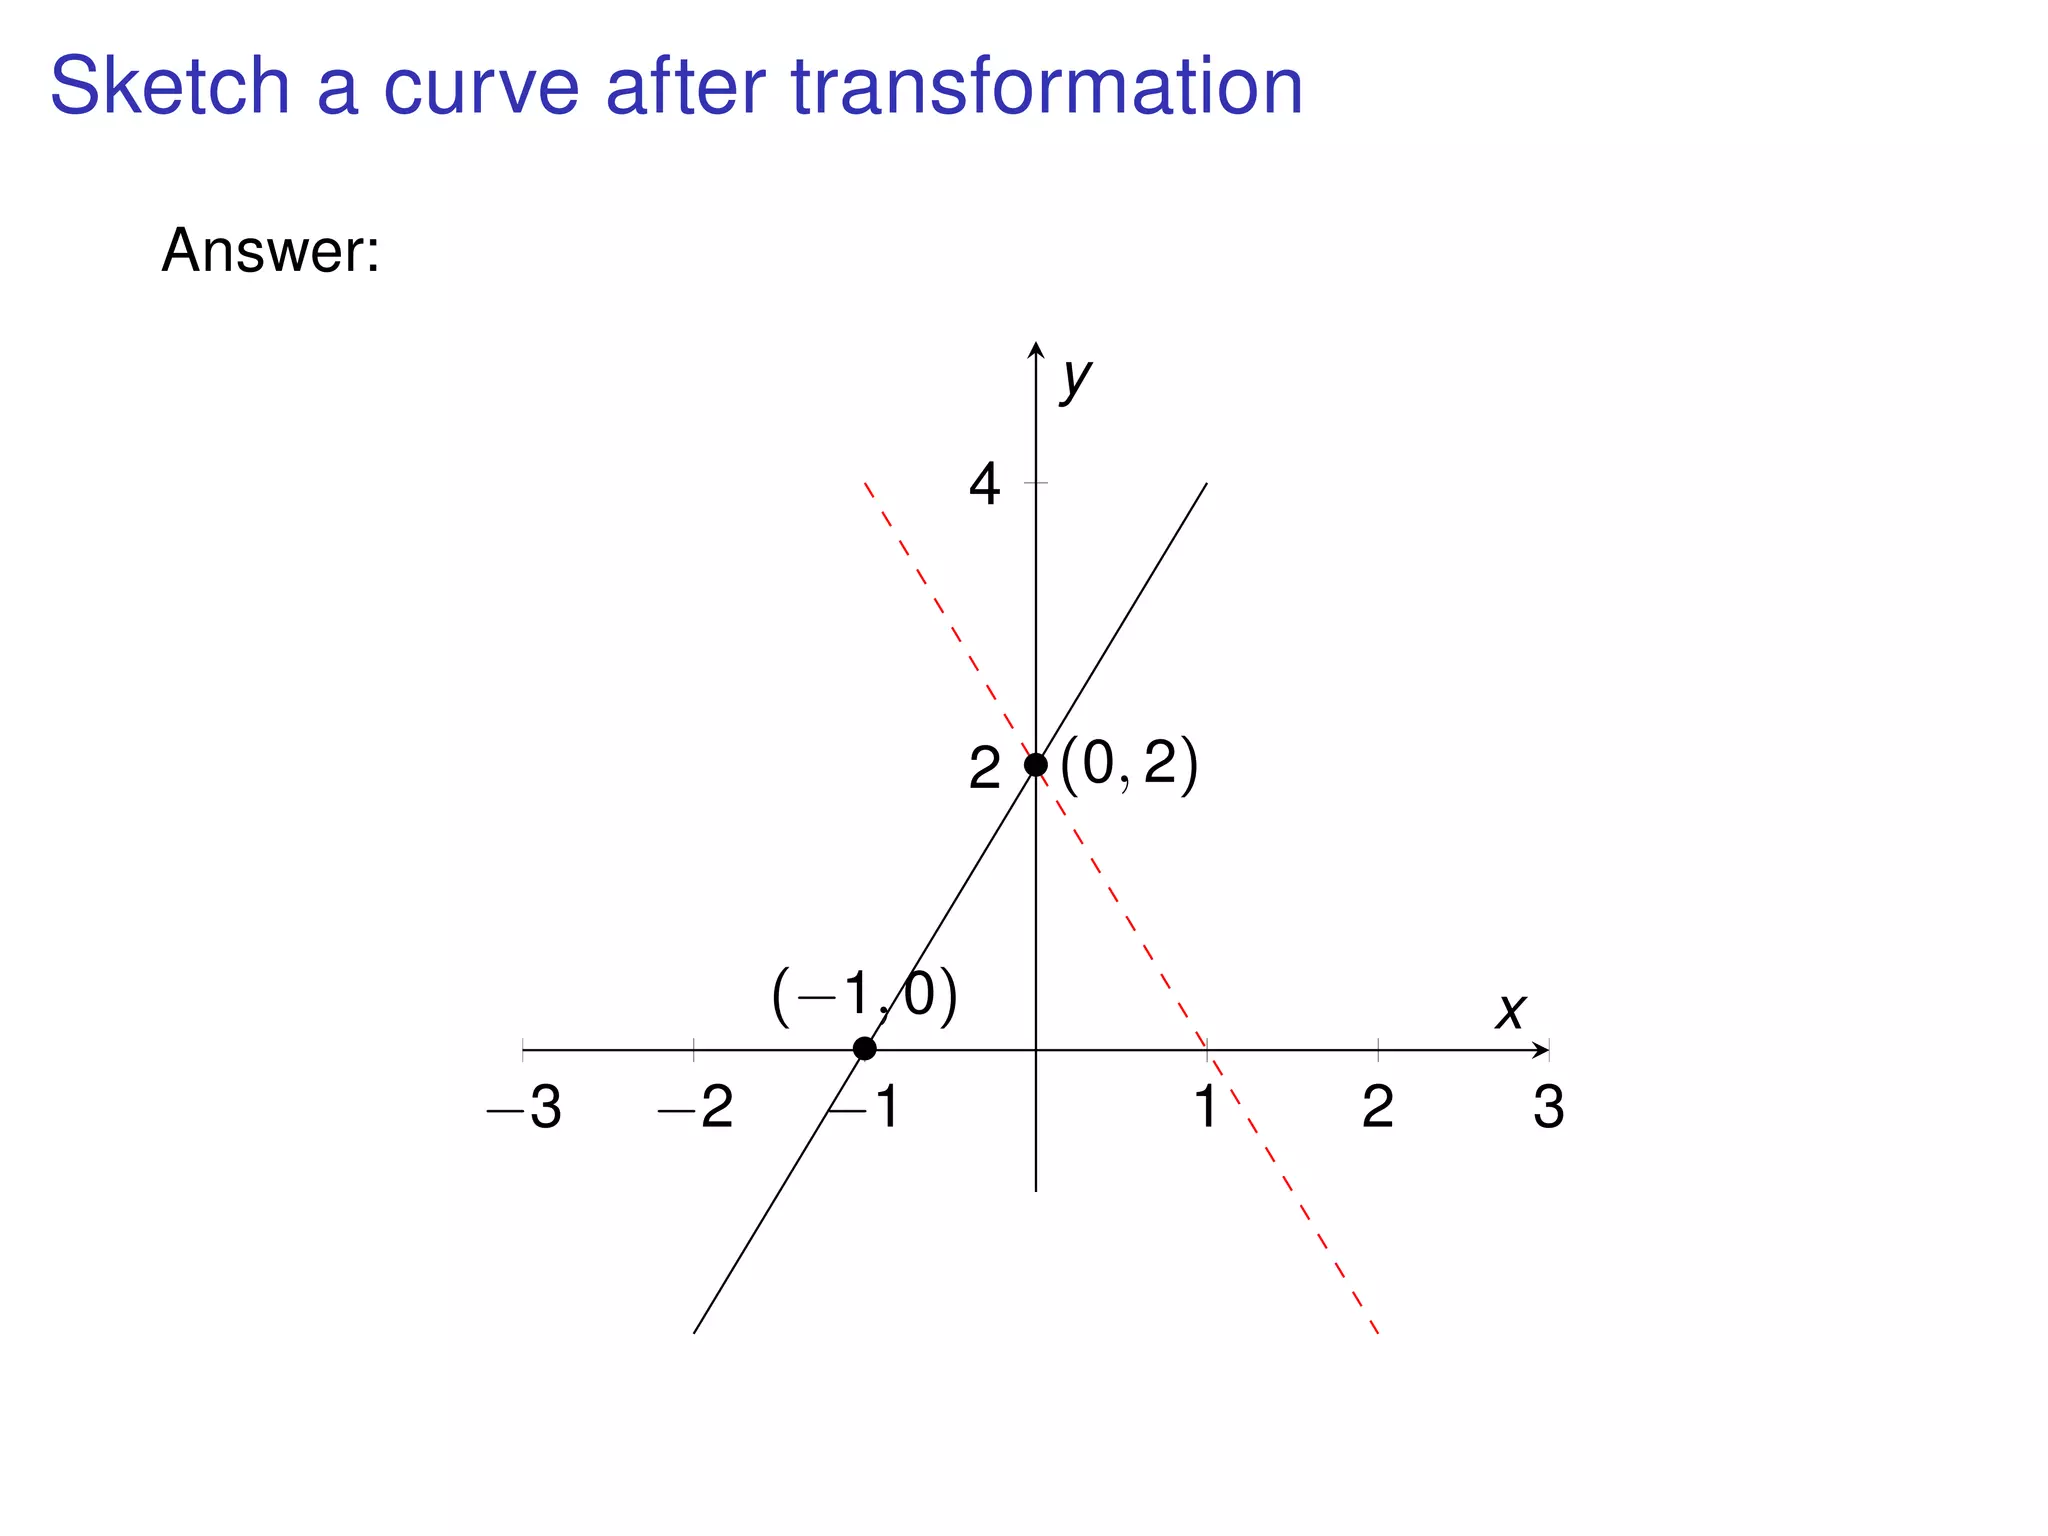
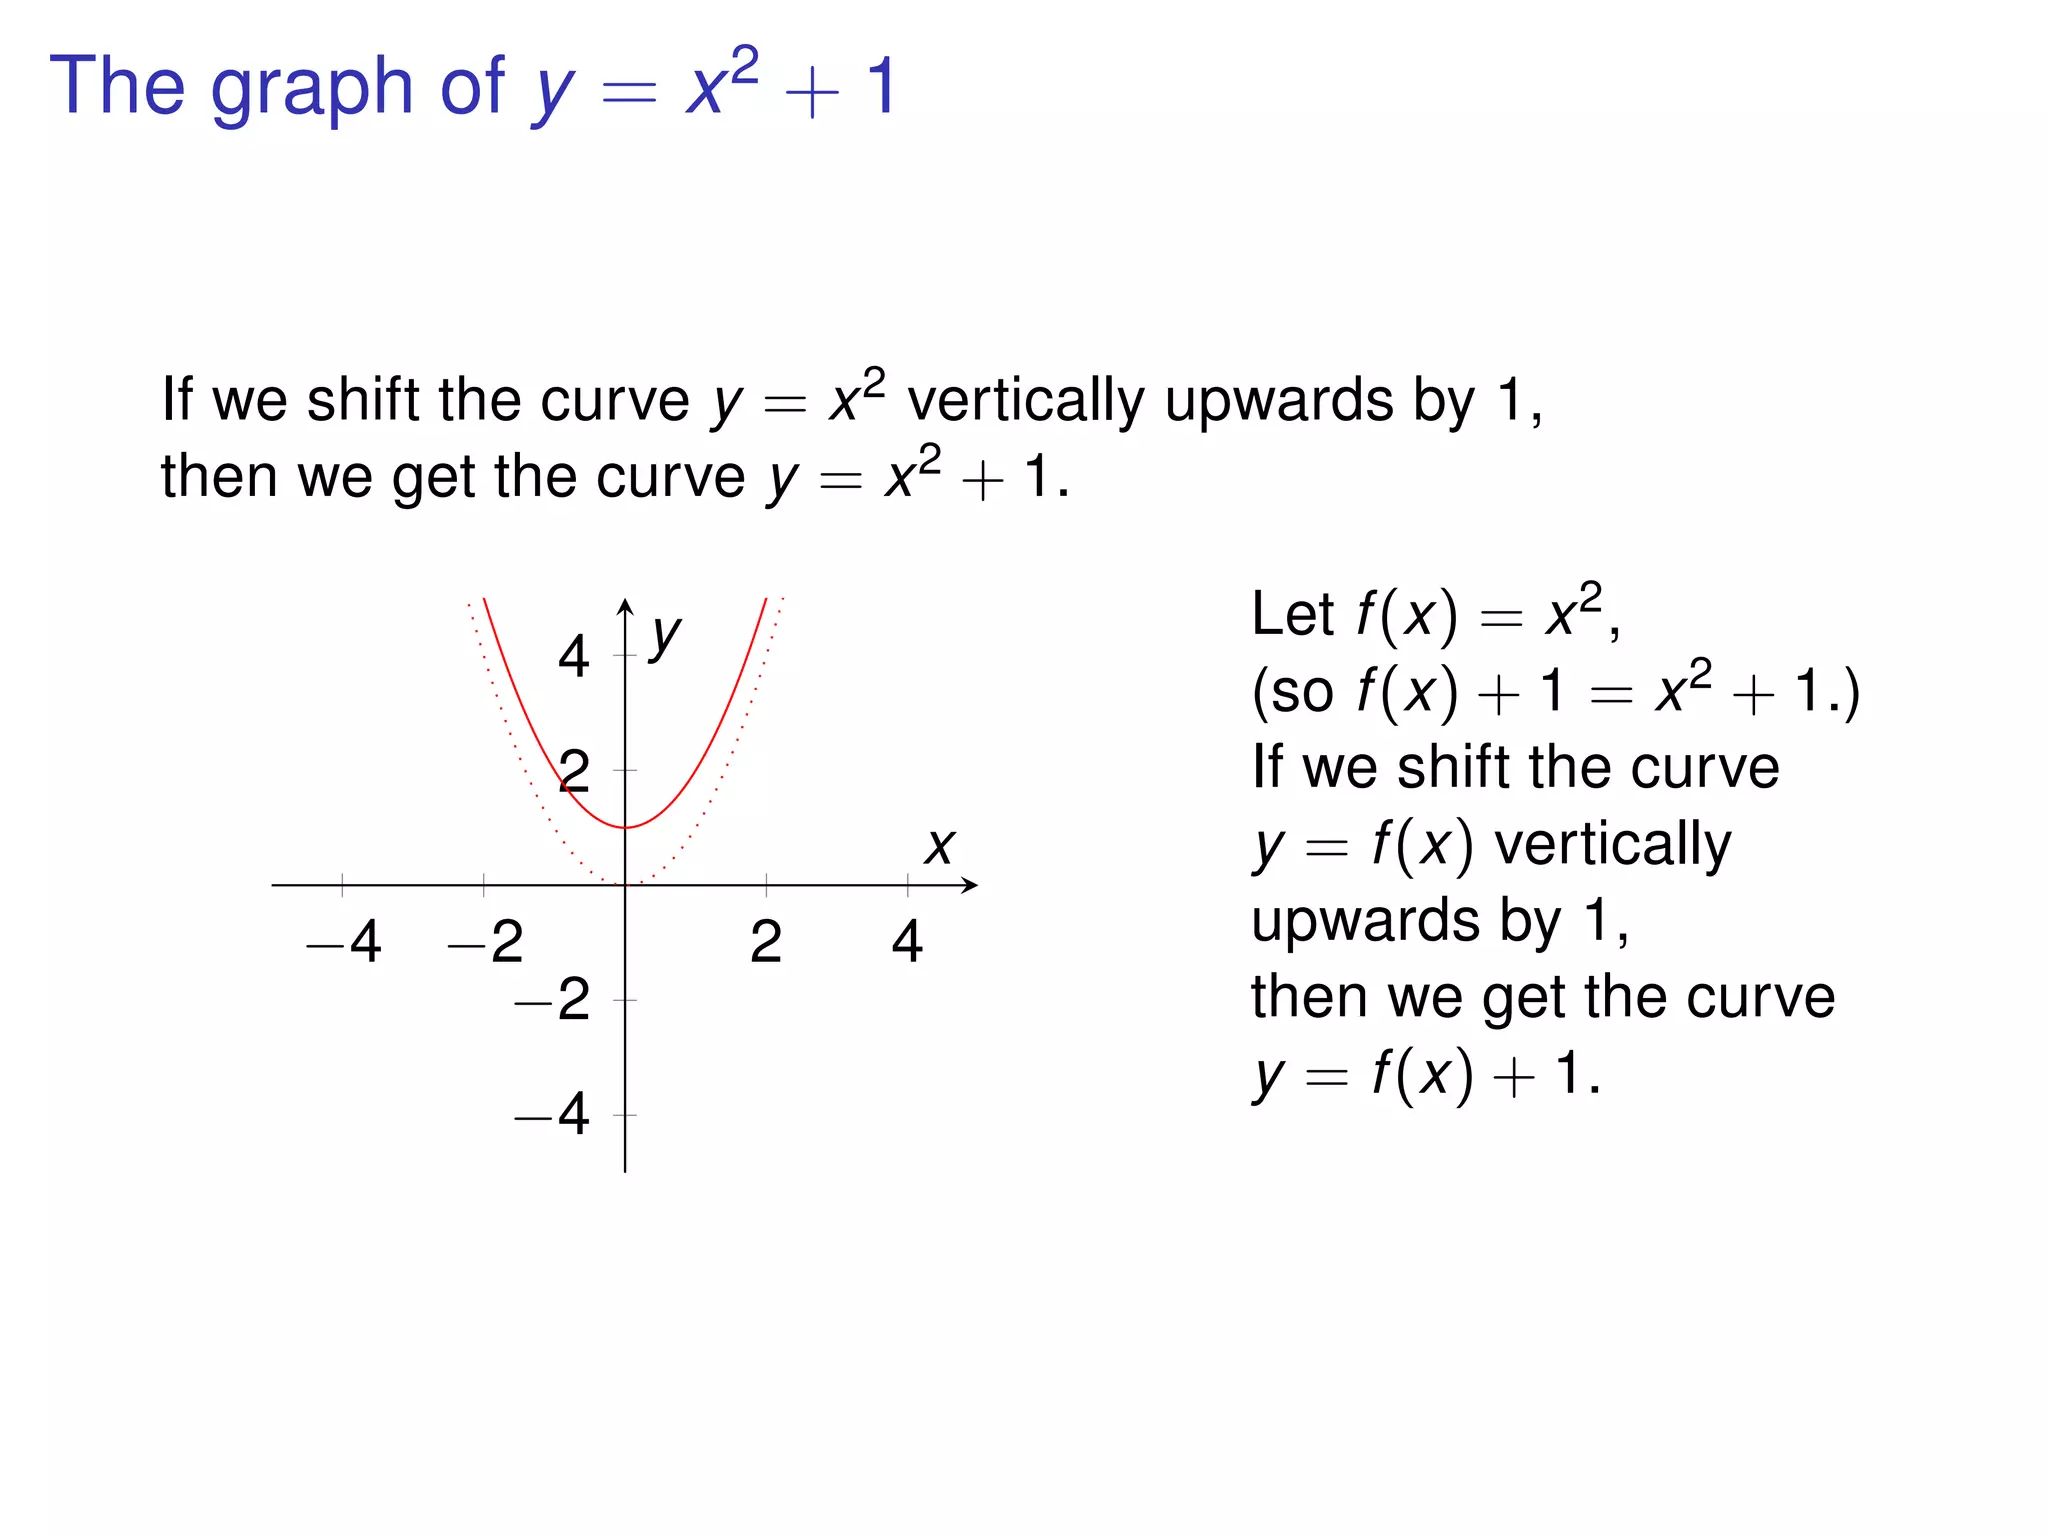
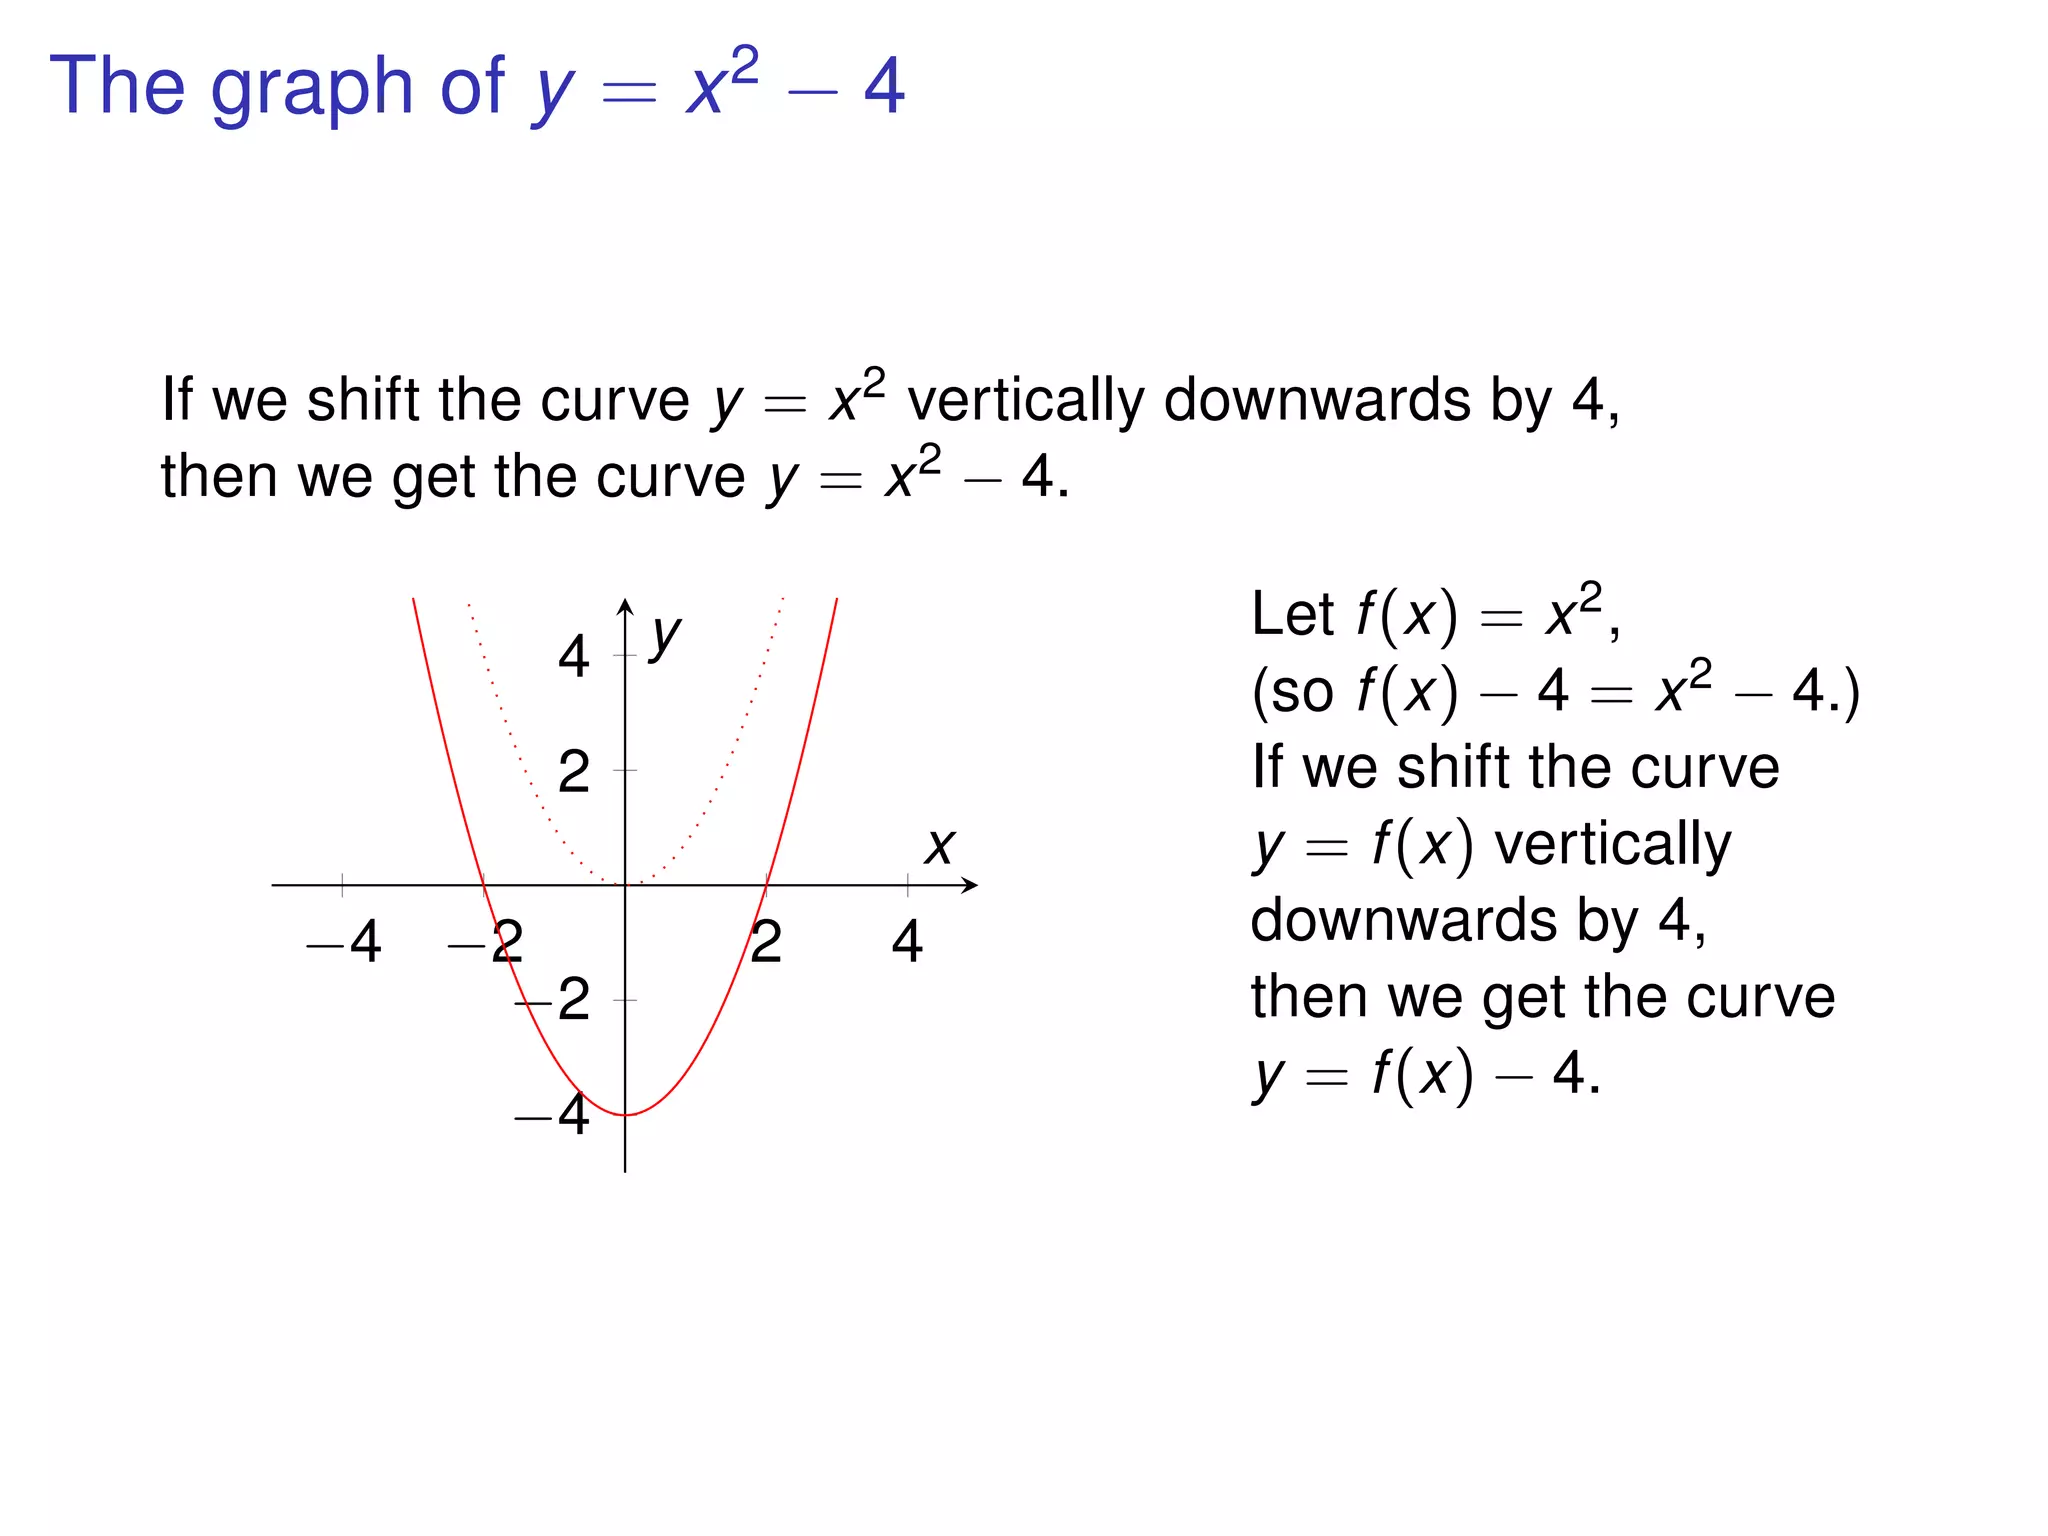
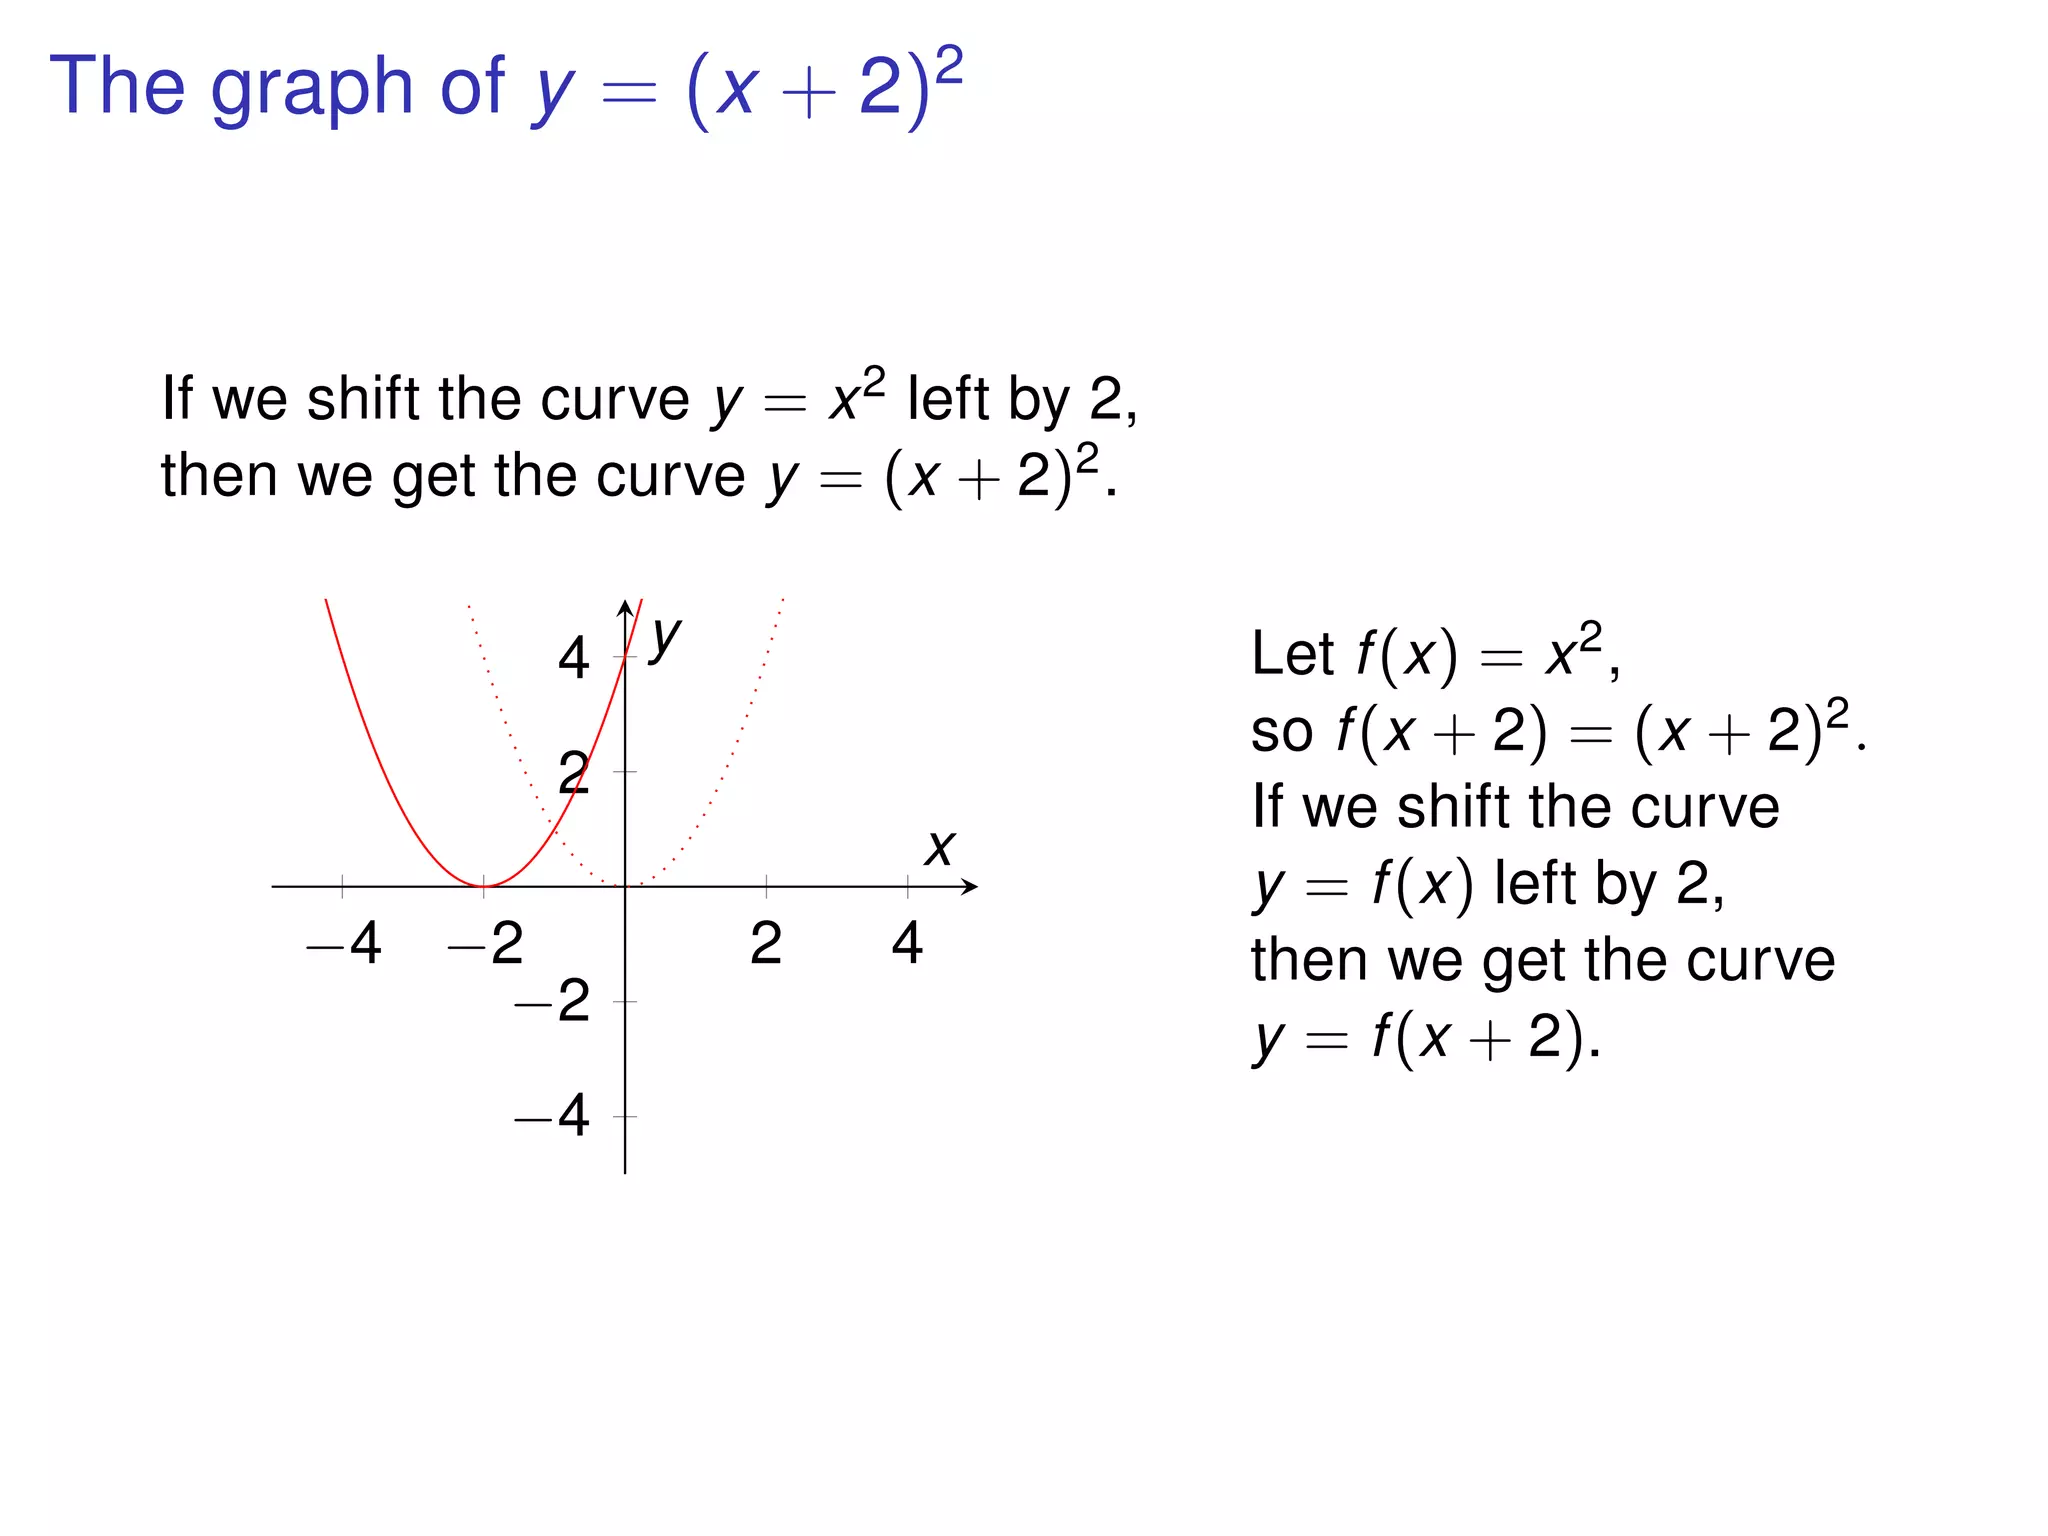
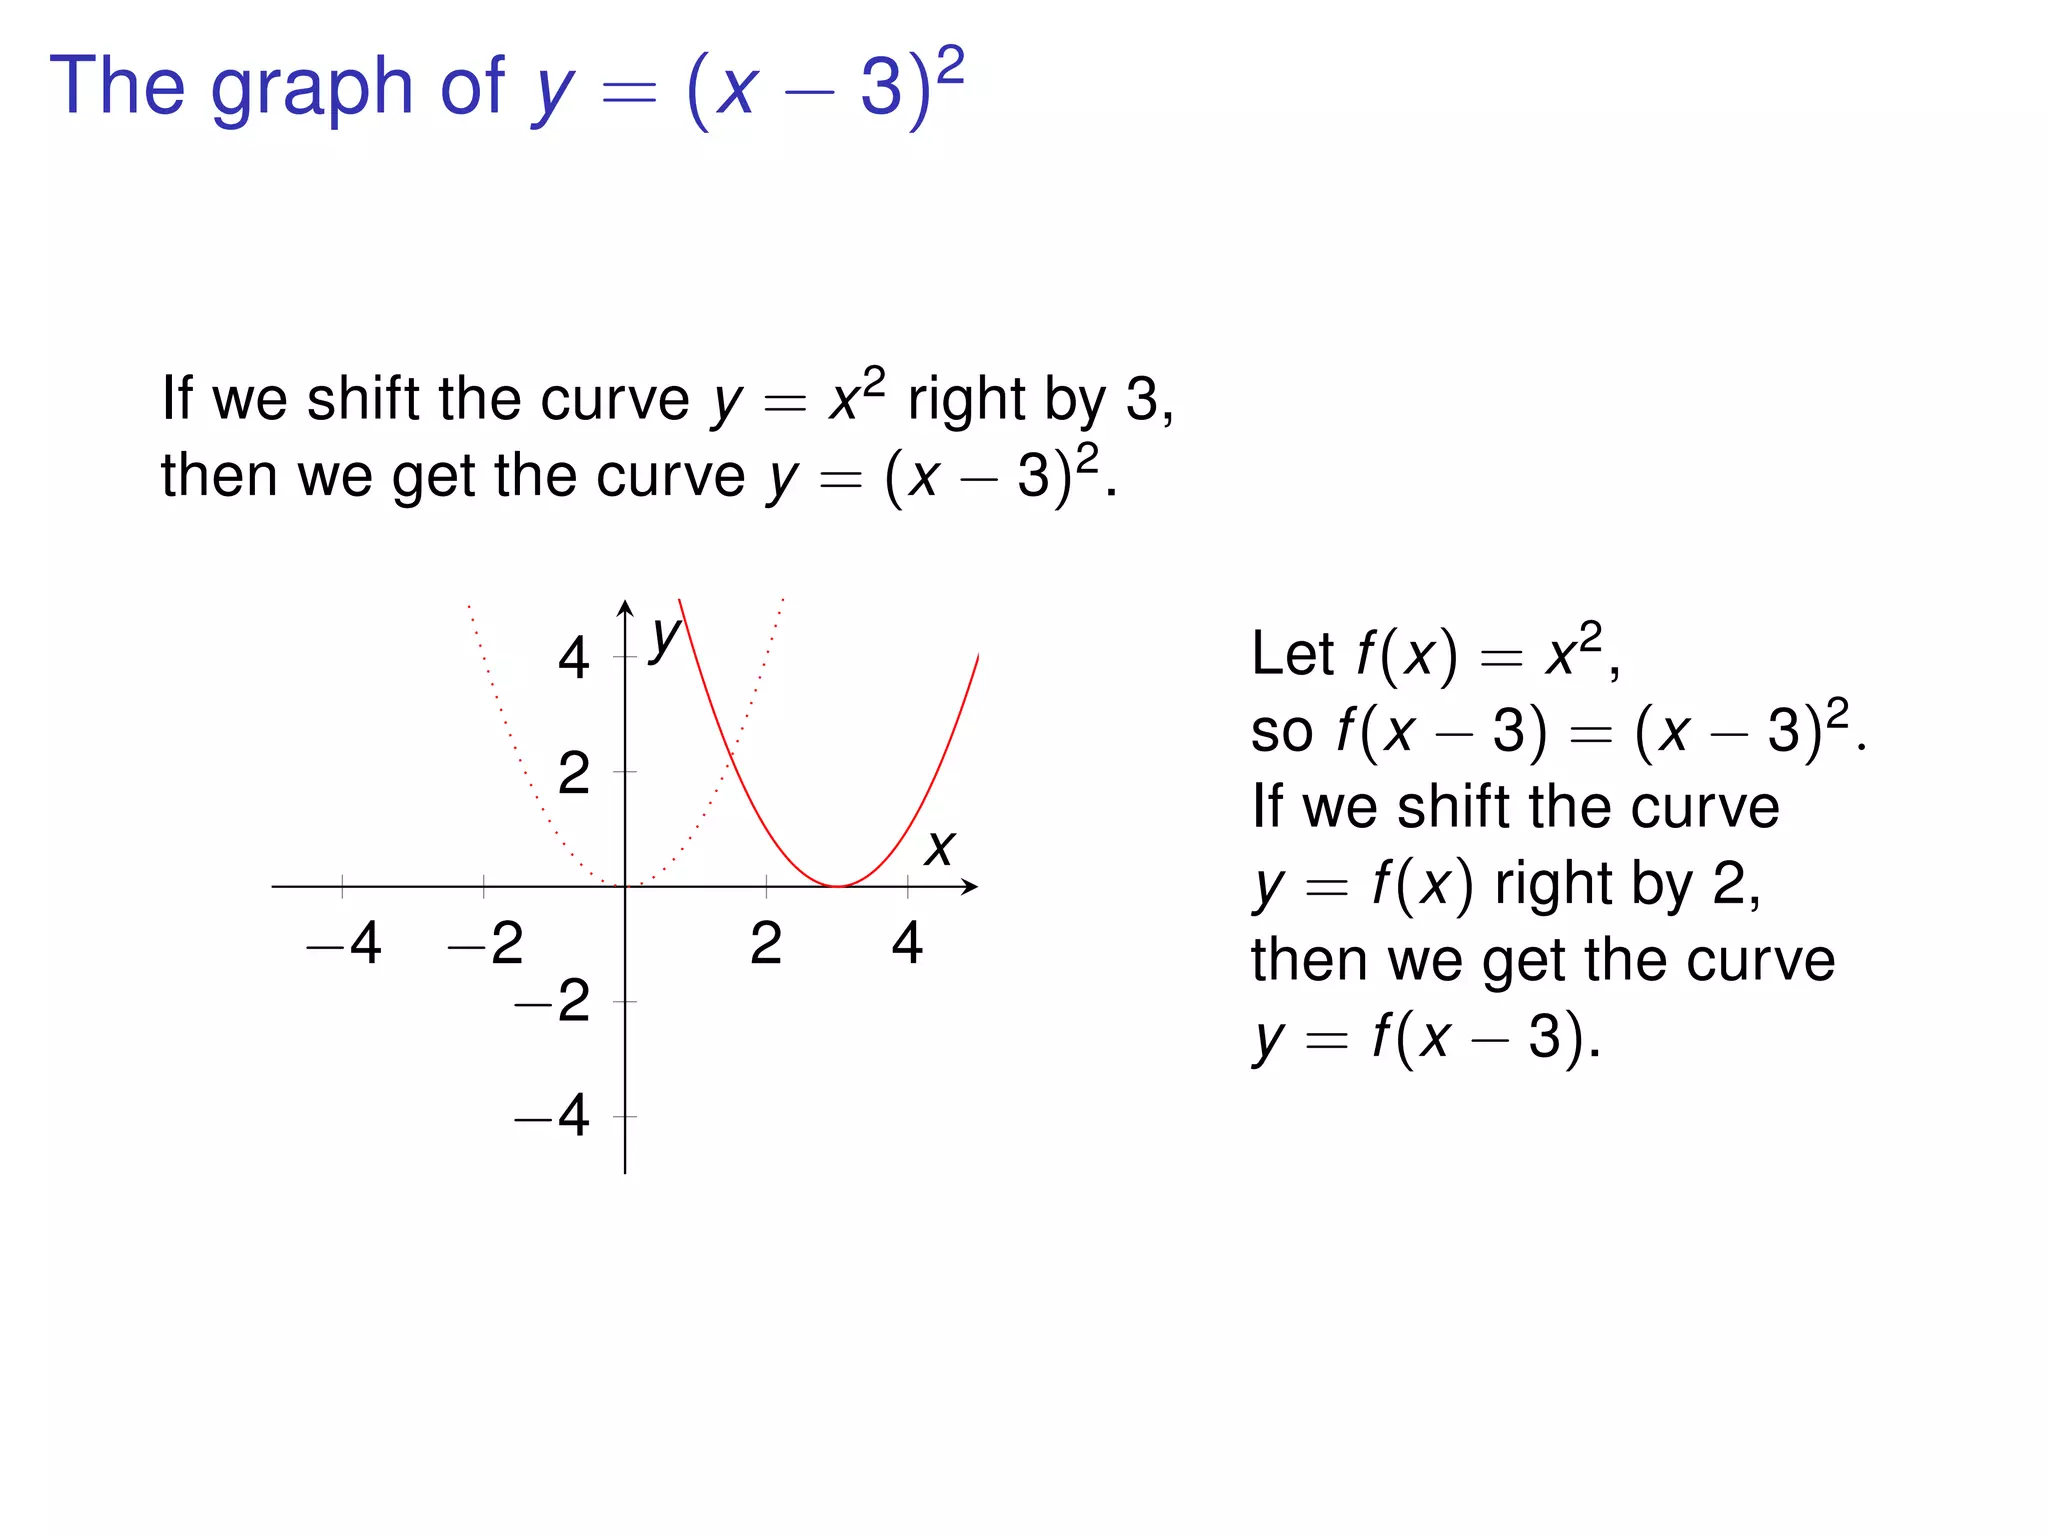
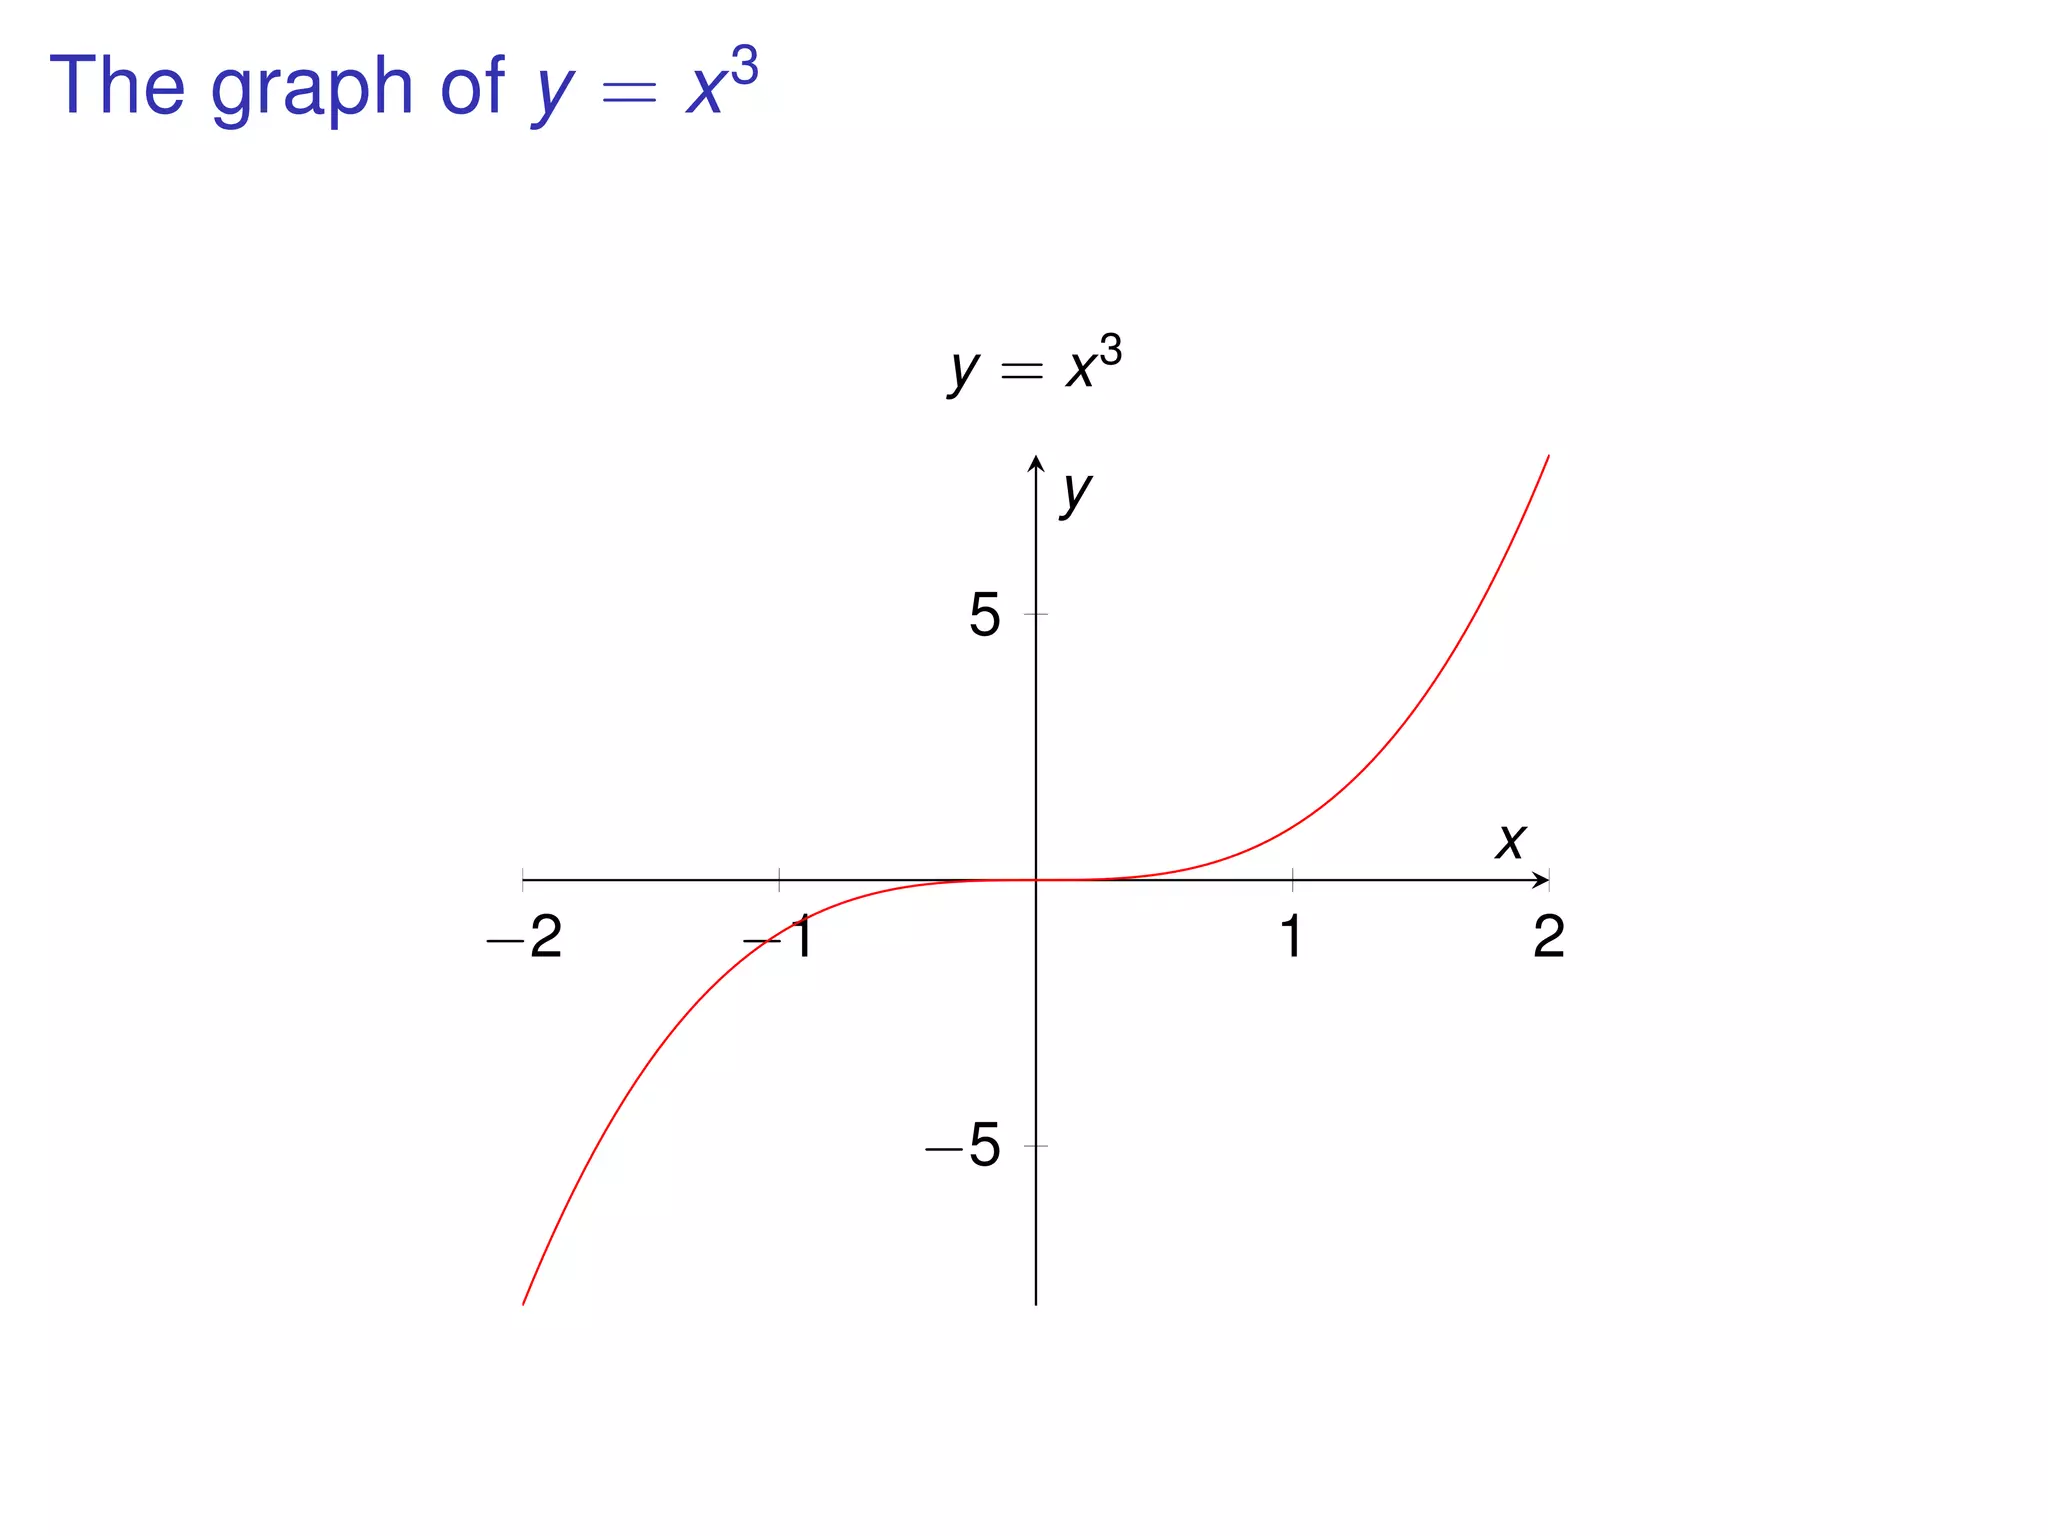
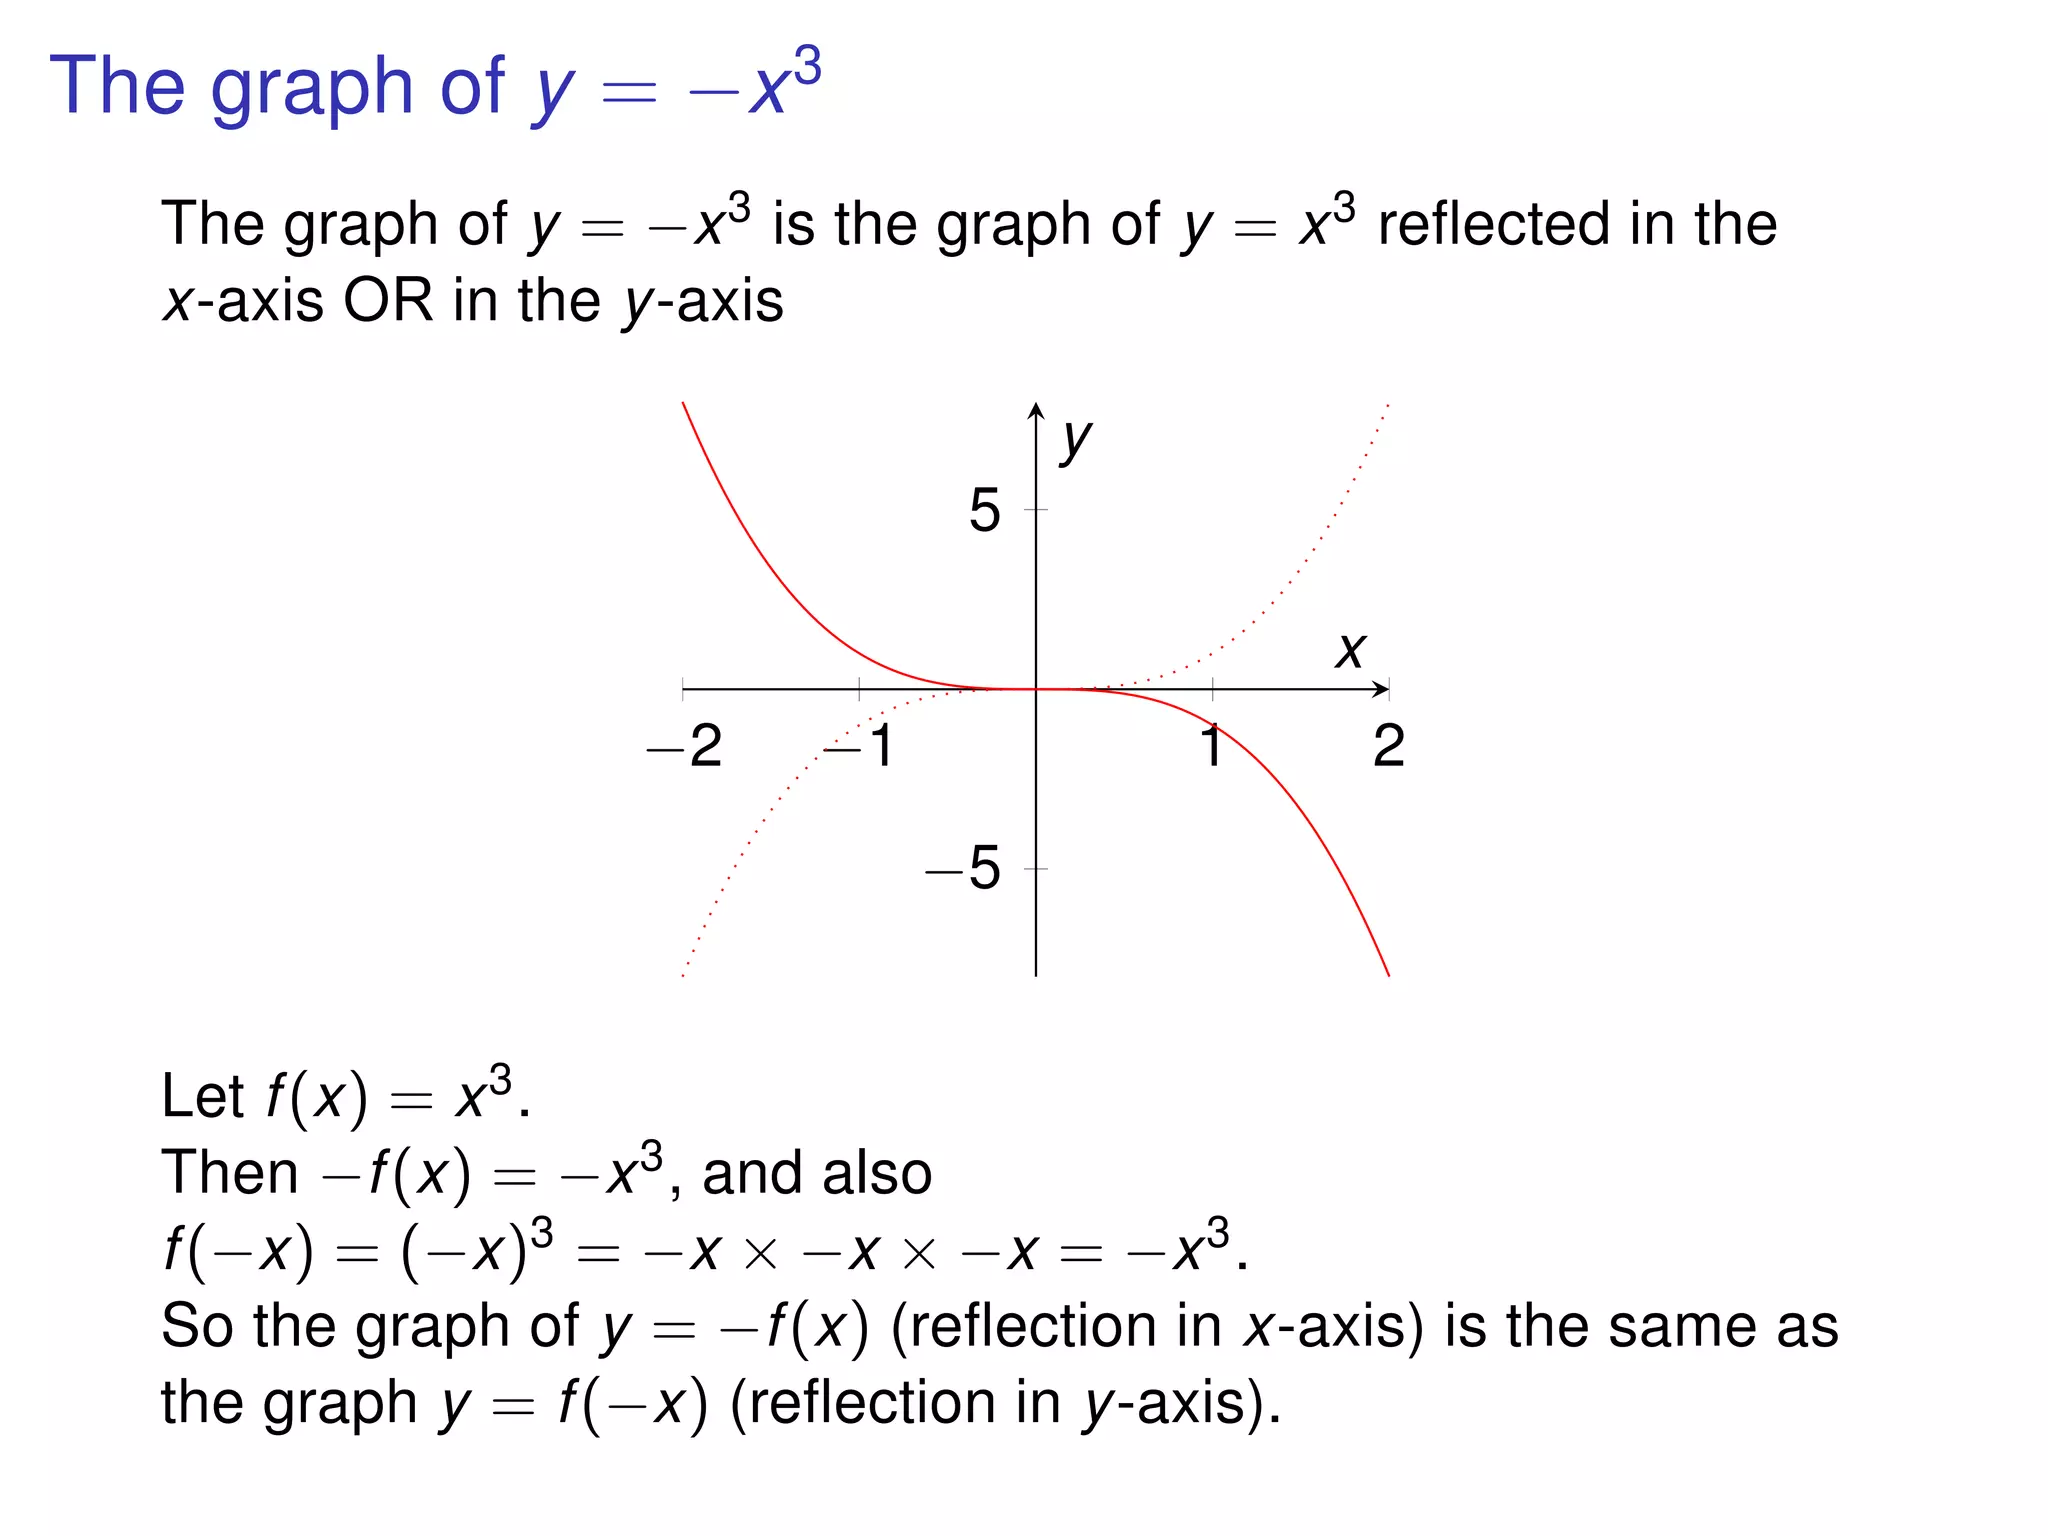
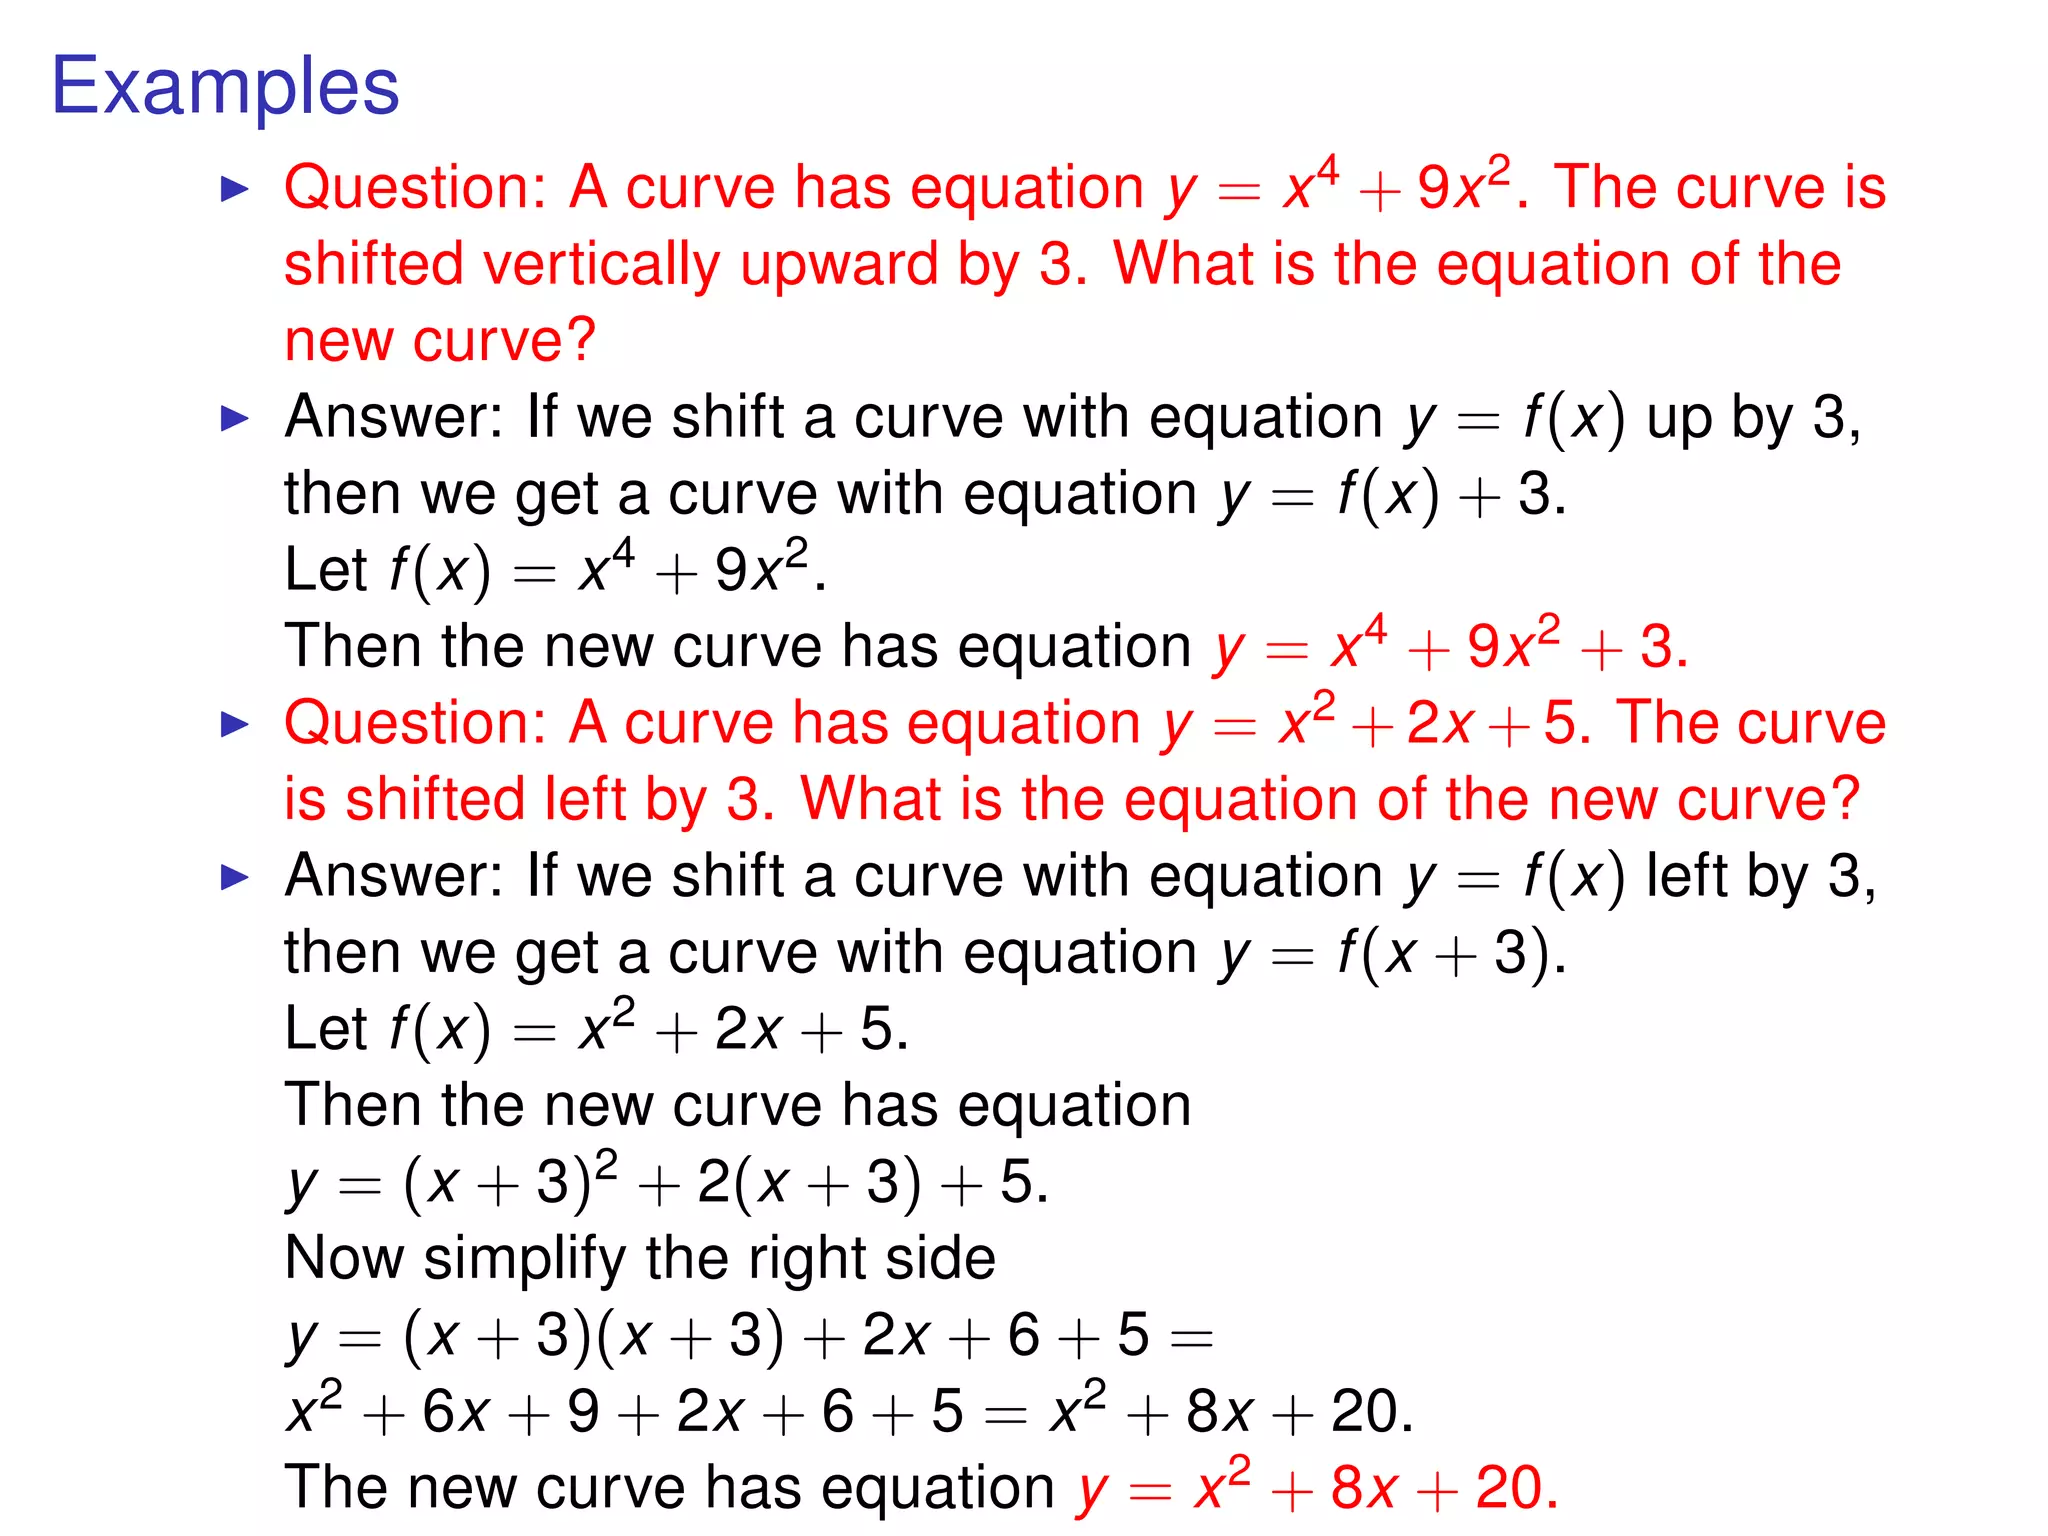
2) It provides examples of how to sketch the graph of a function after a transformation based on the original function and explains how to write the equation of a transformed curve.
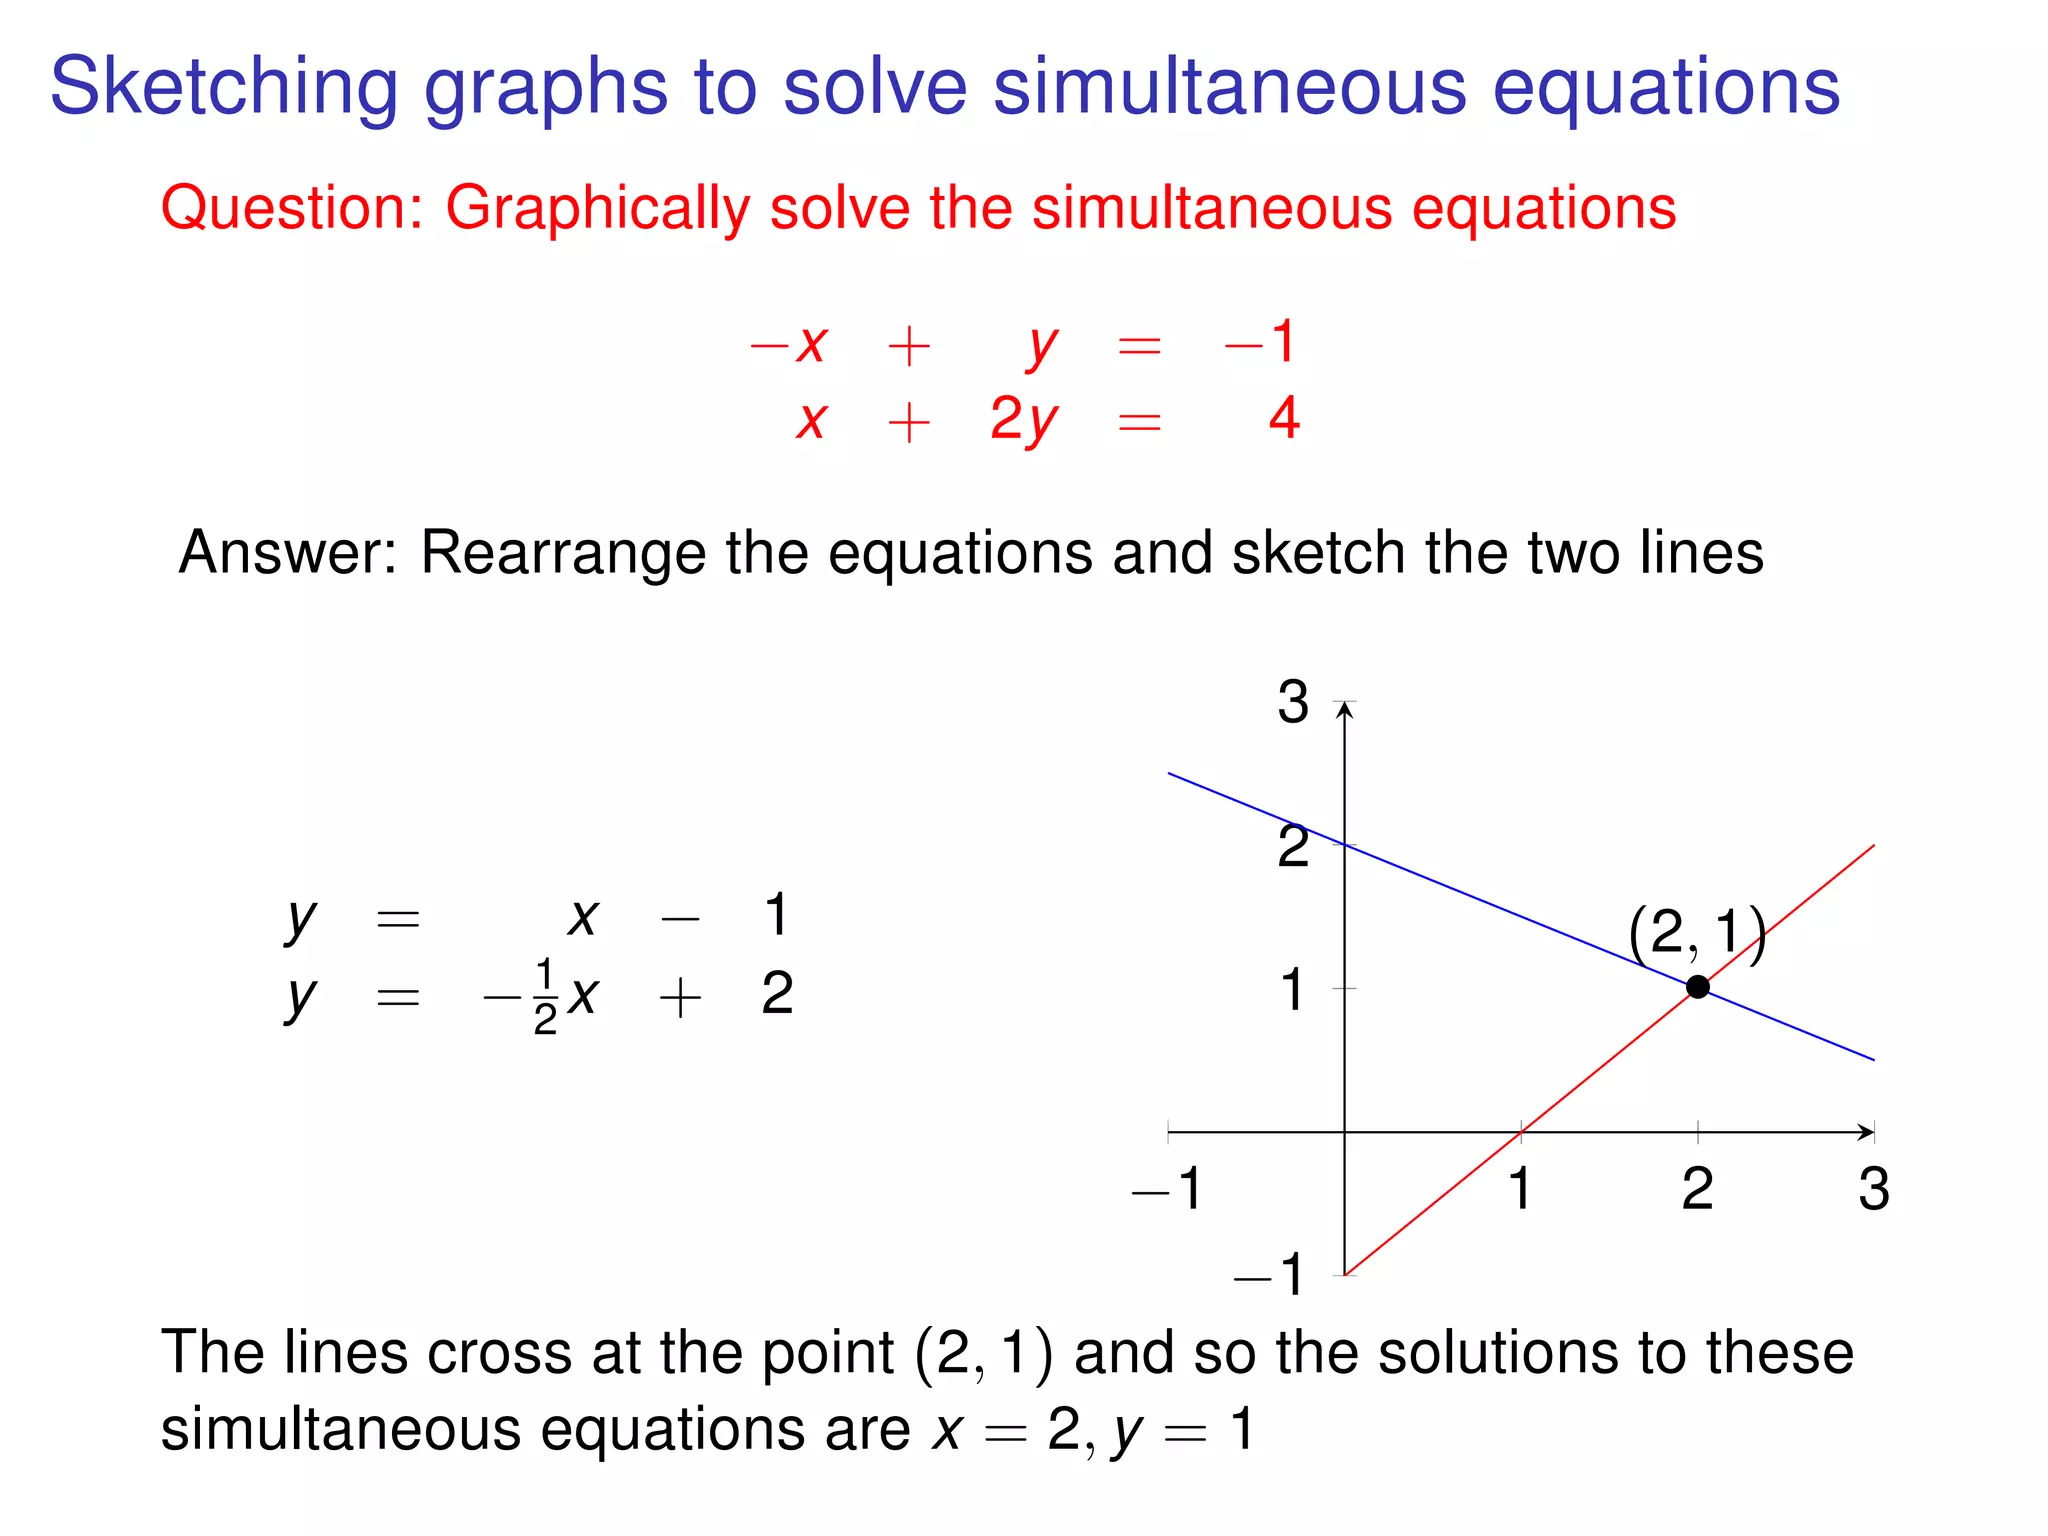
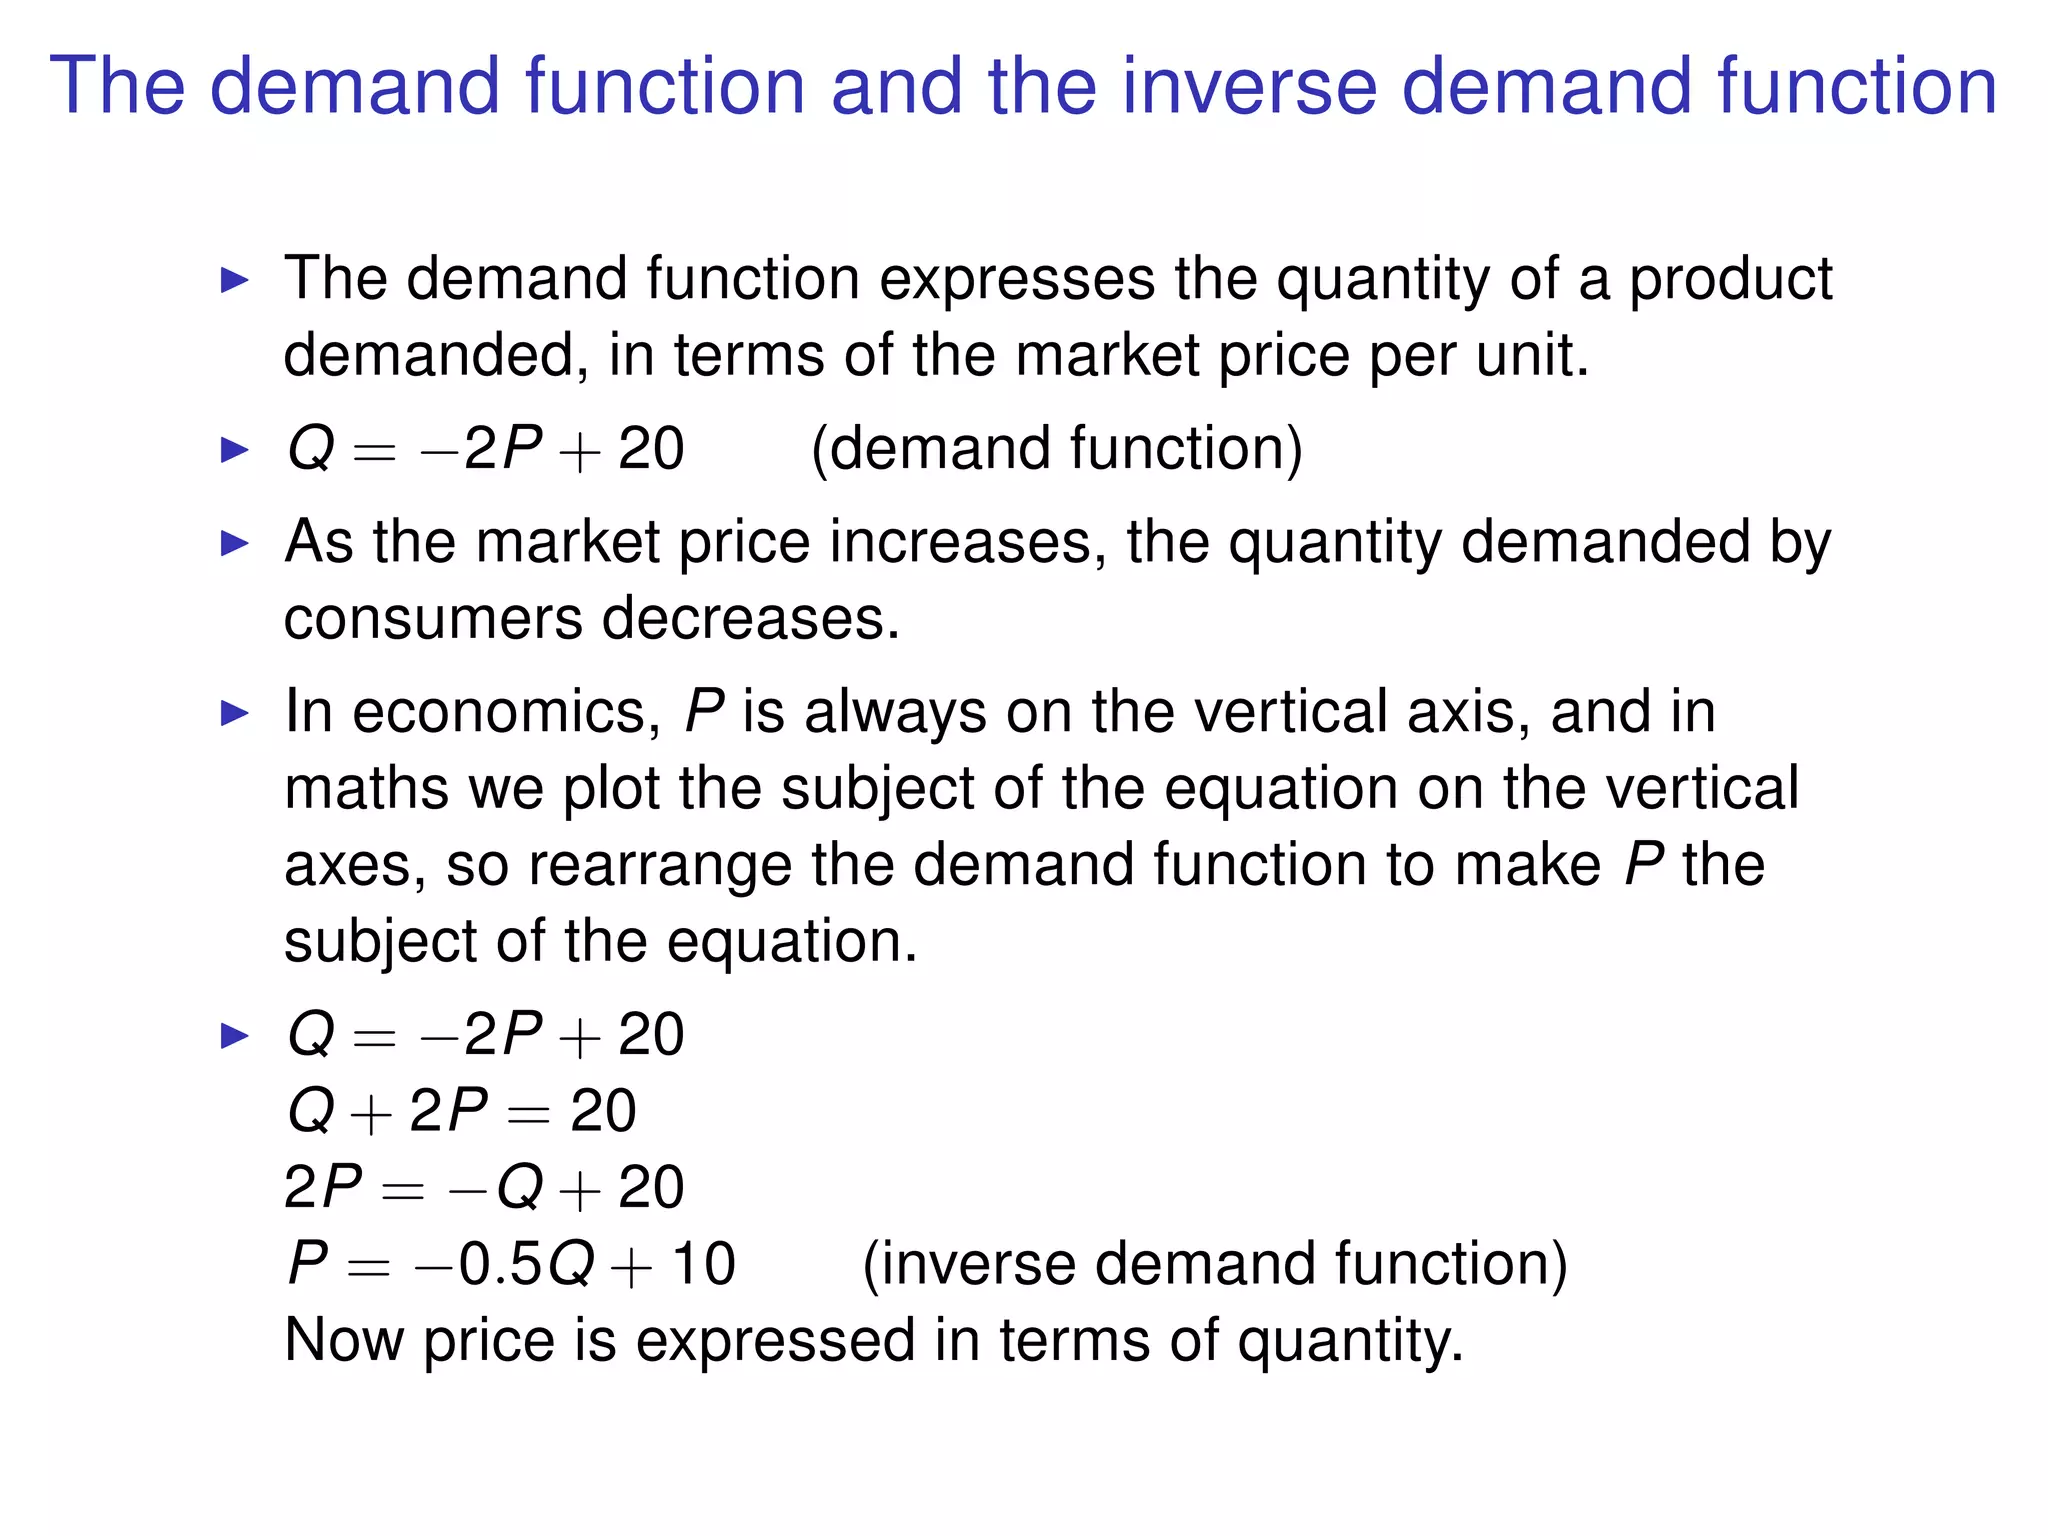
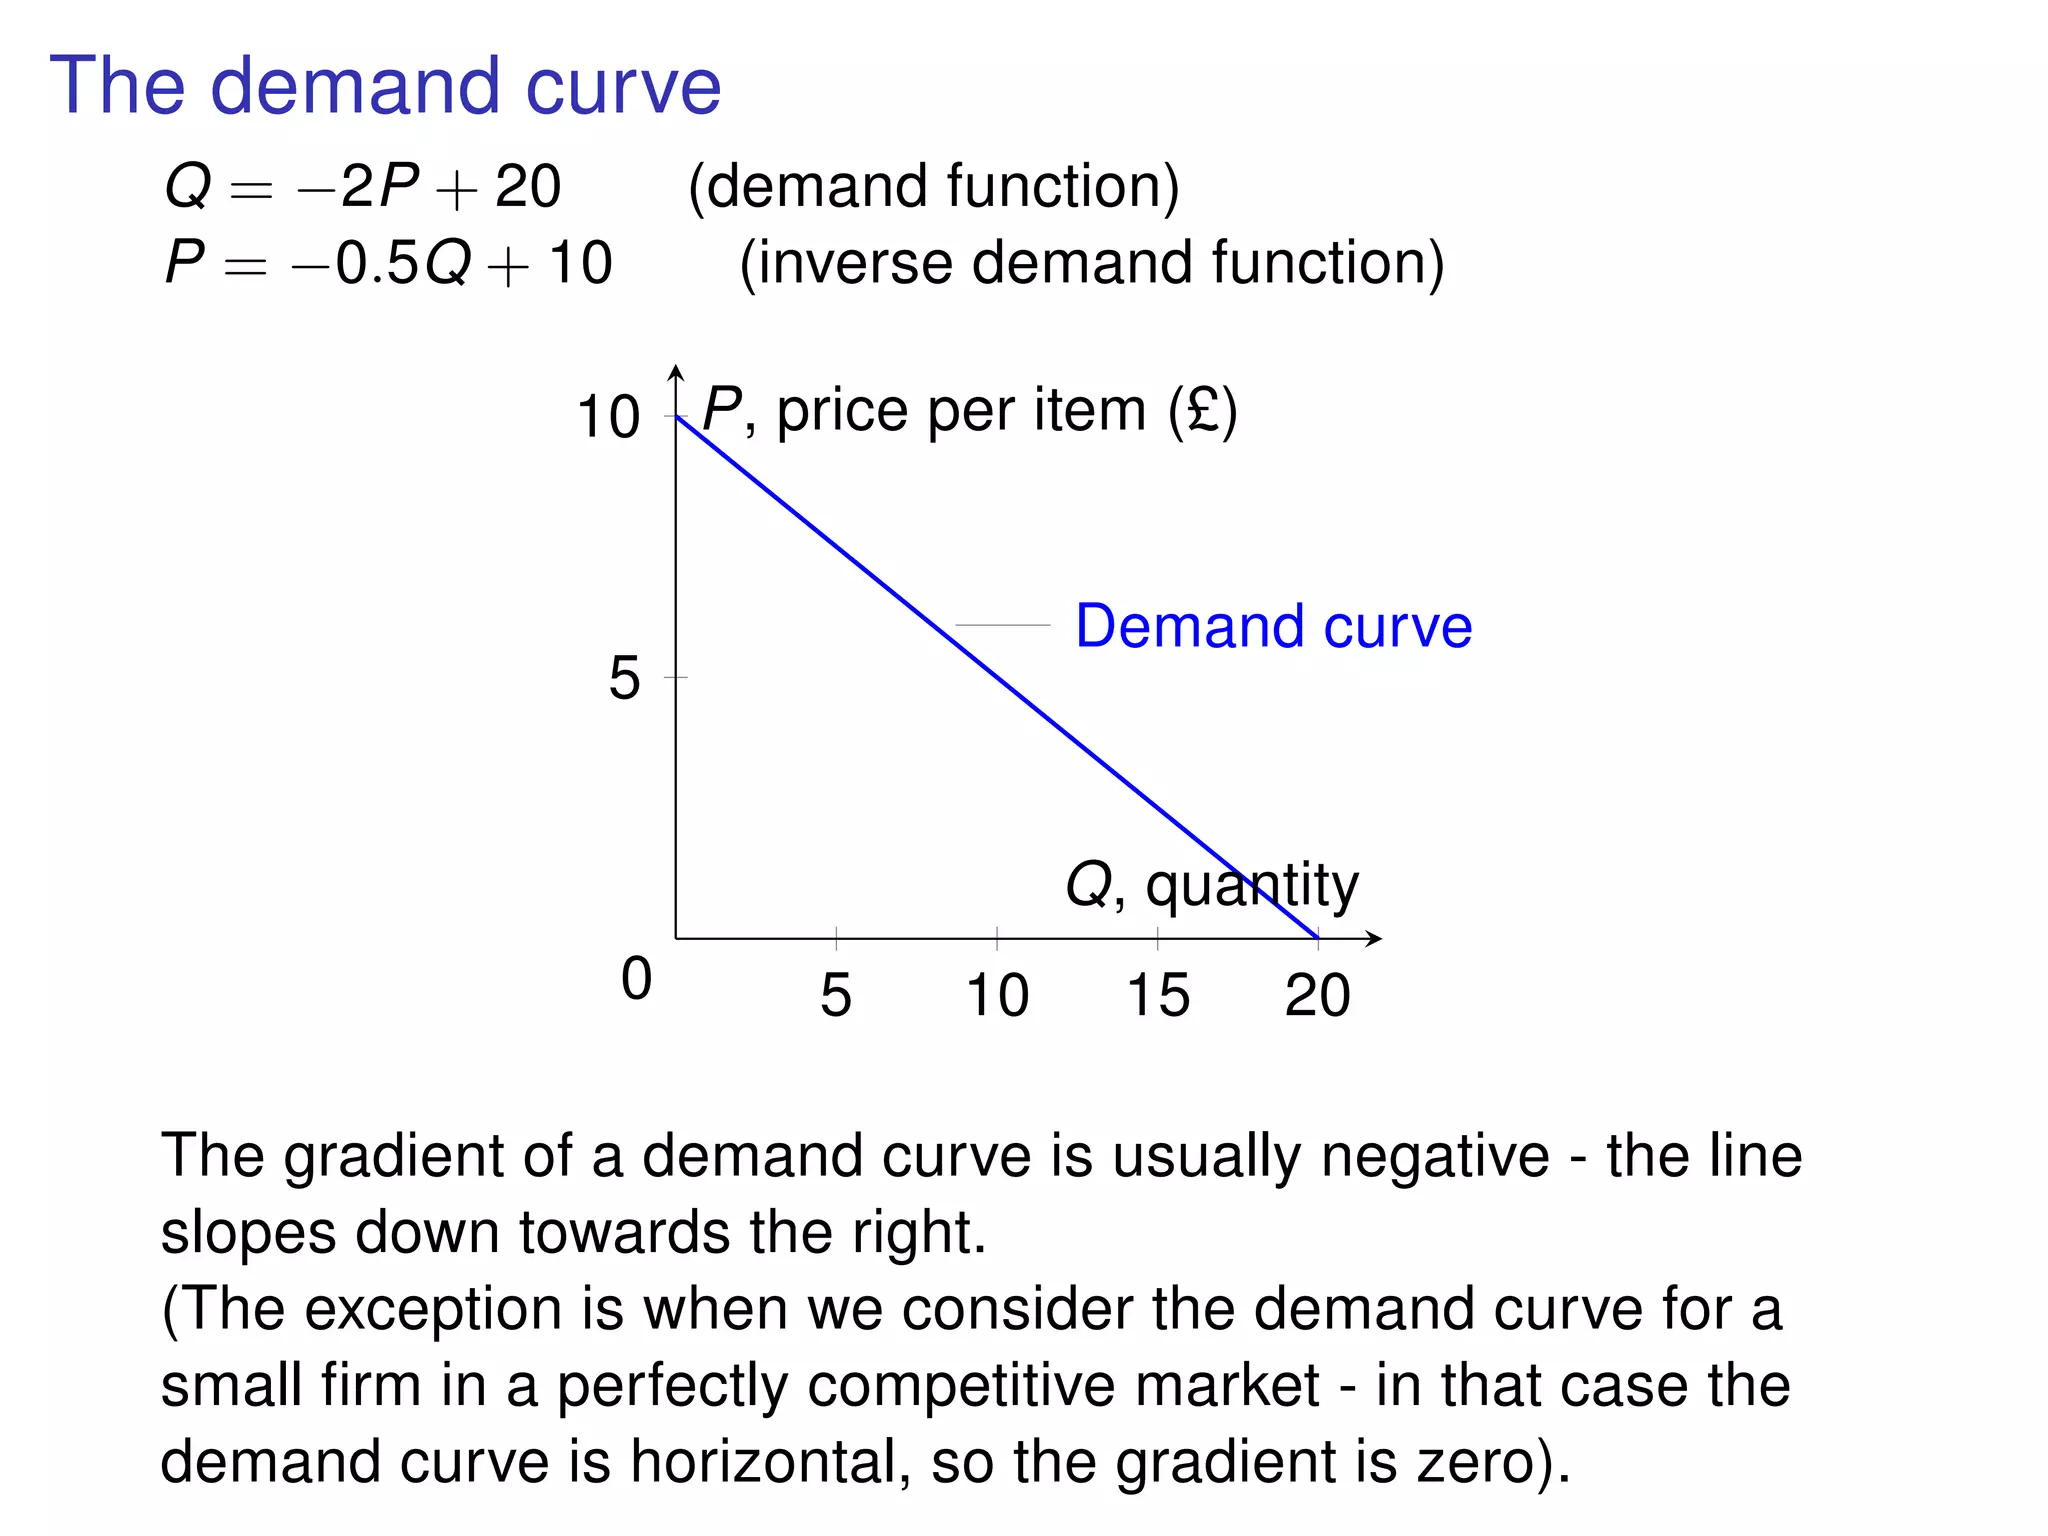
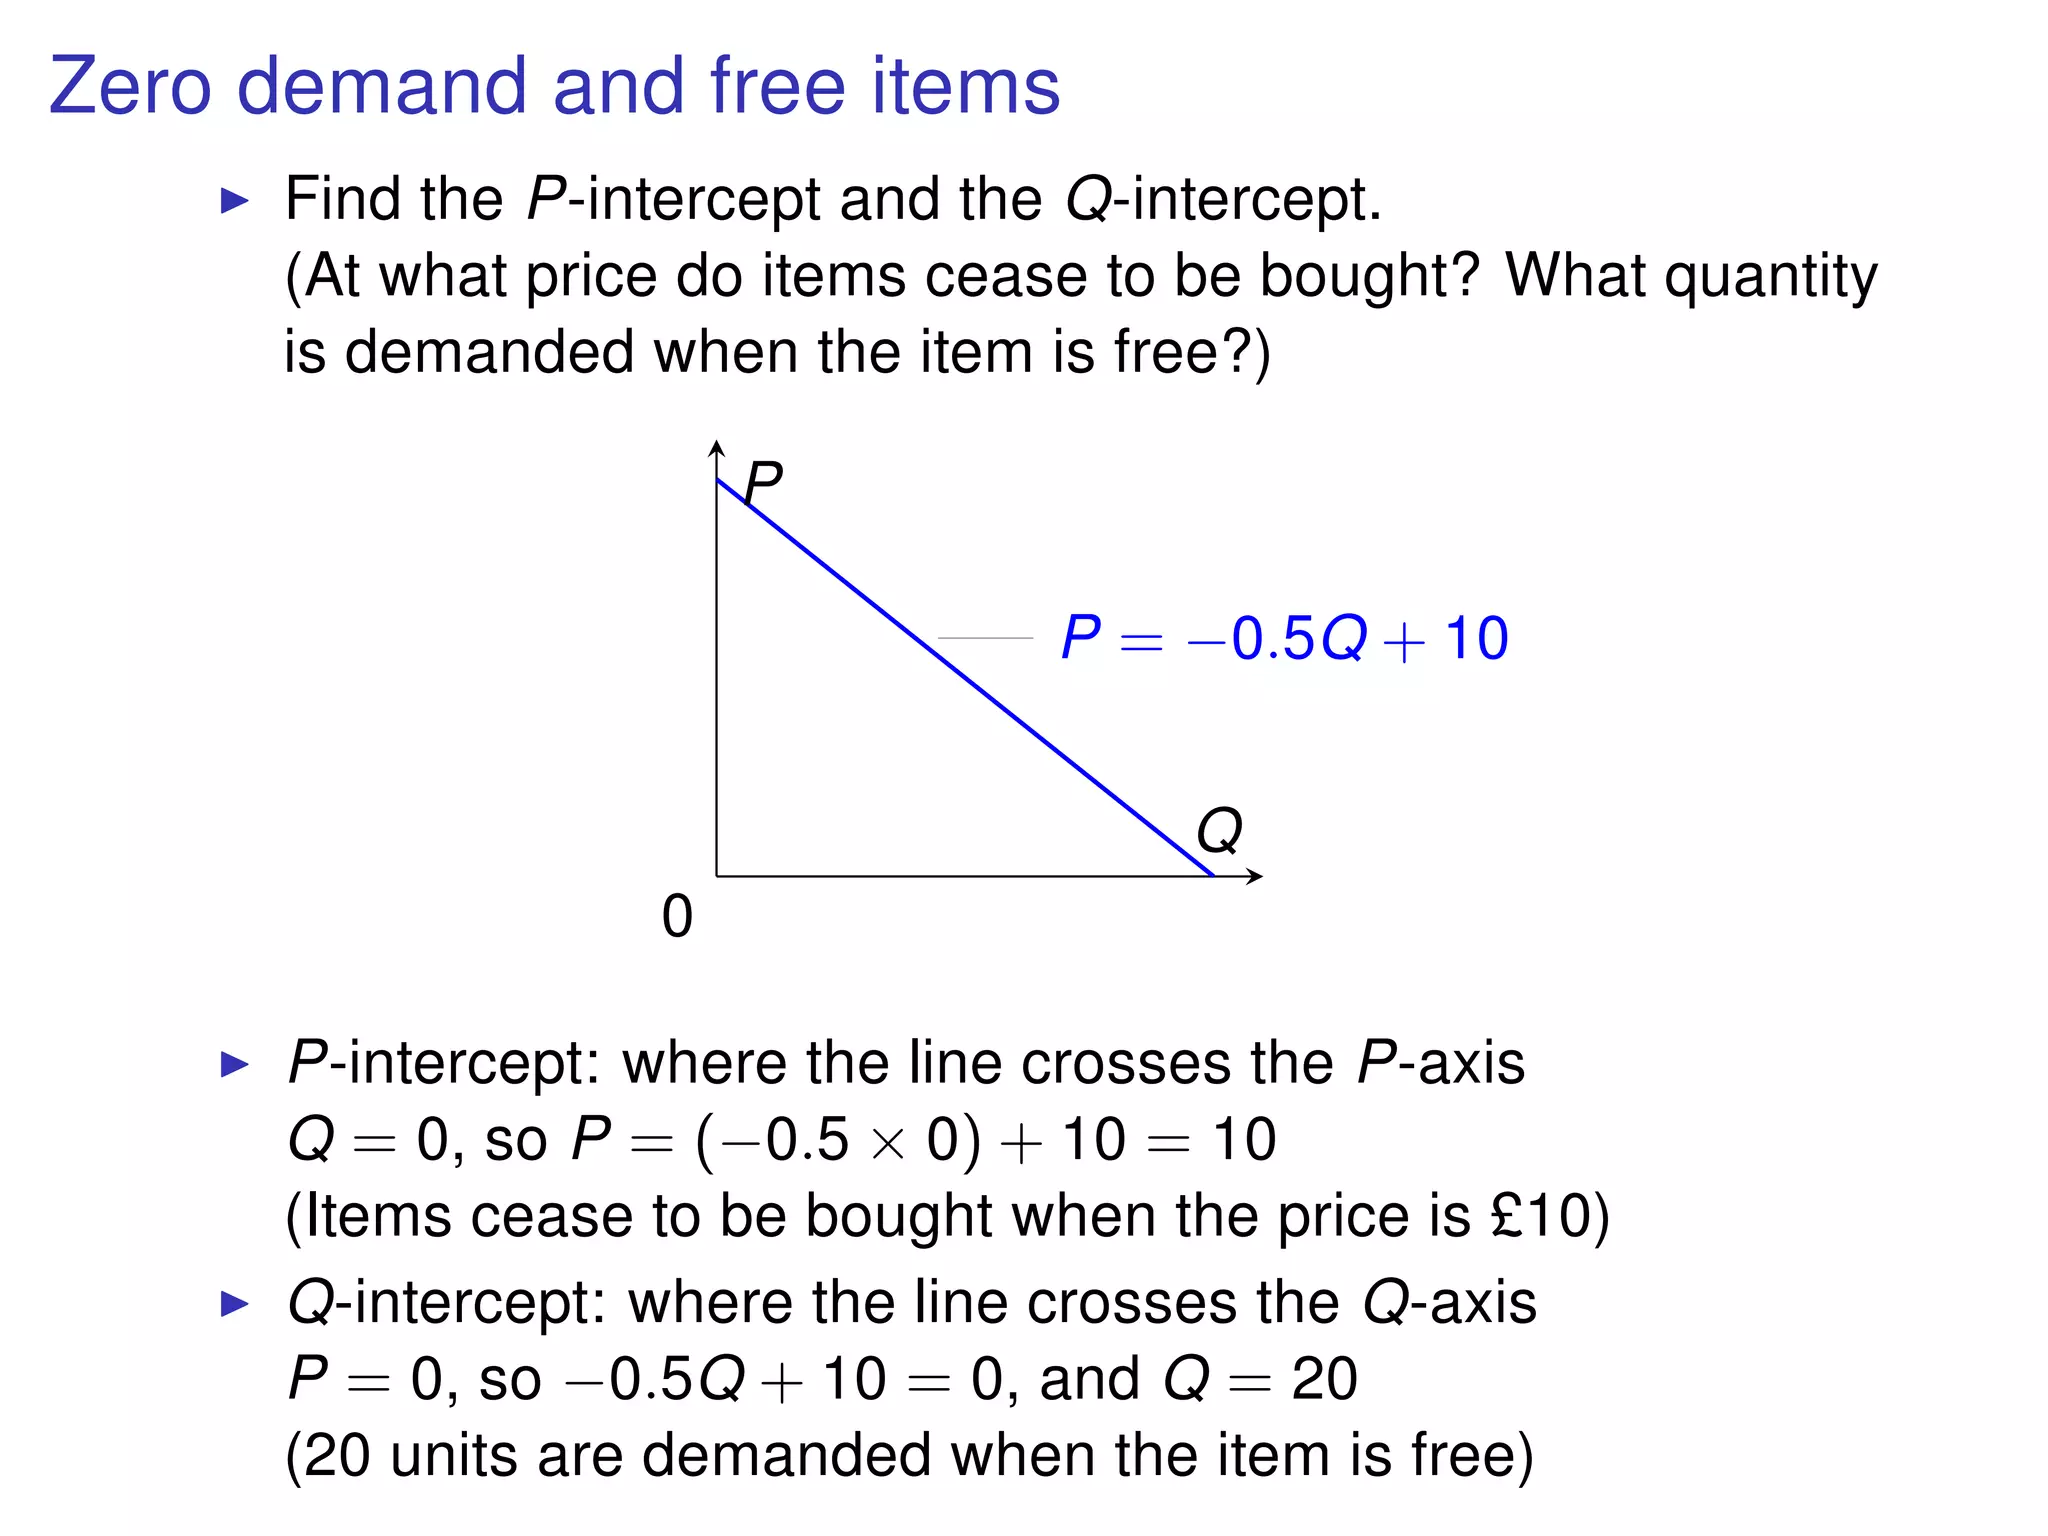
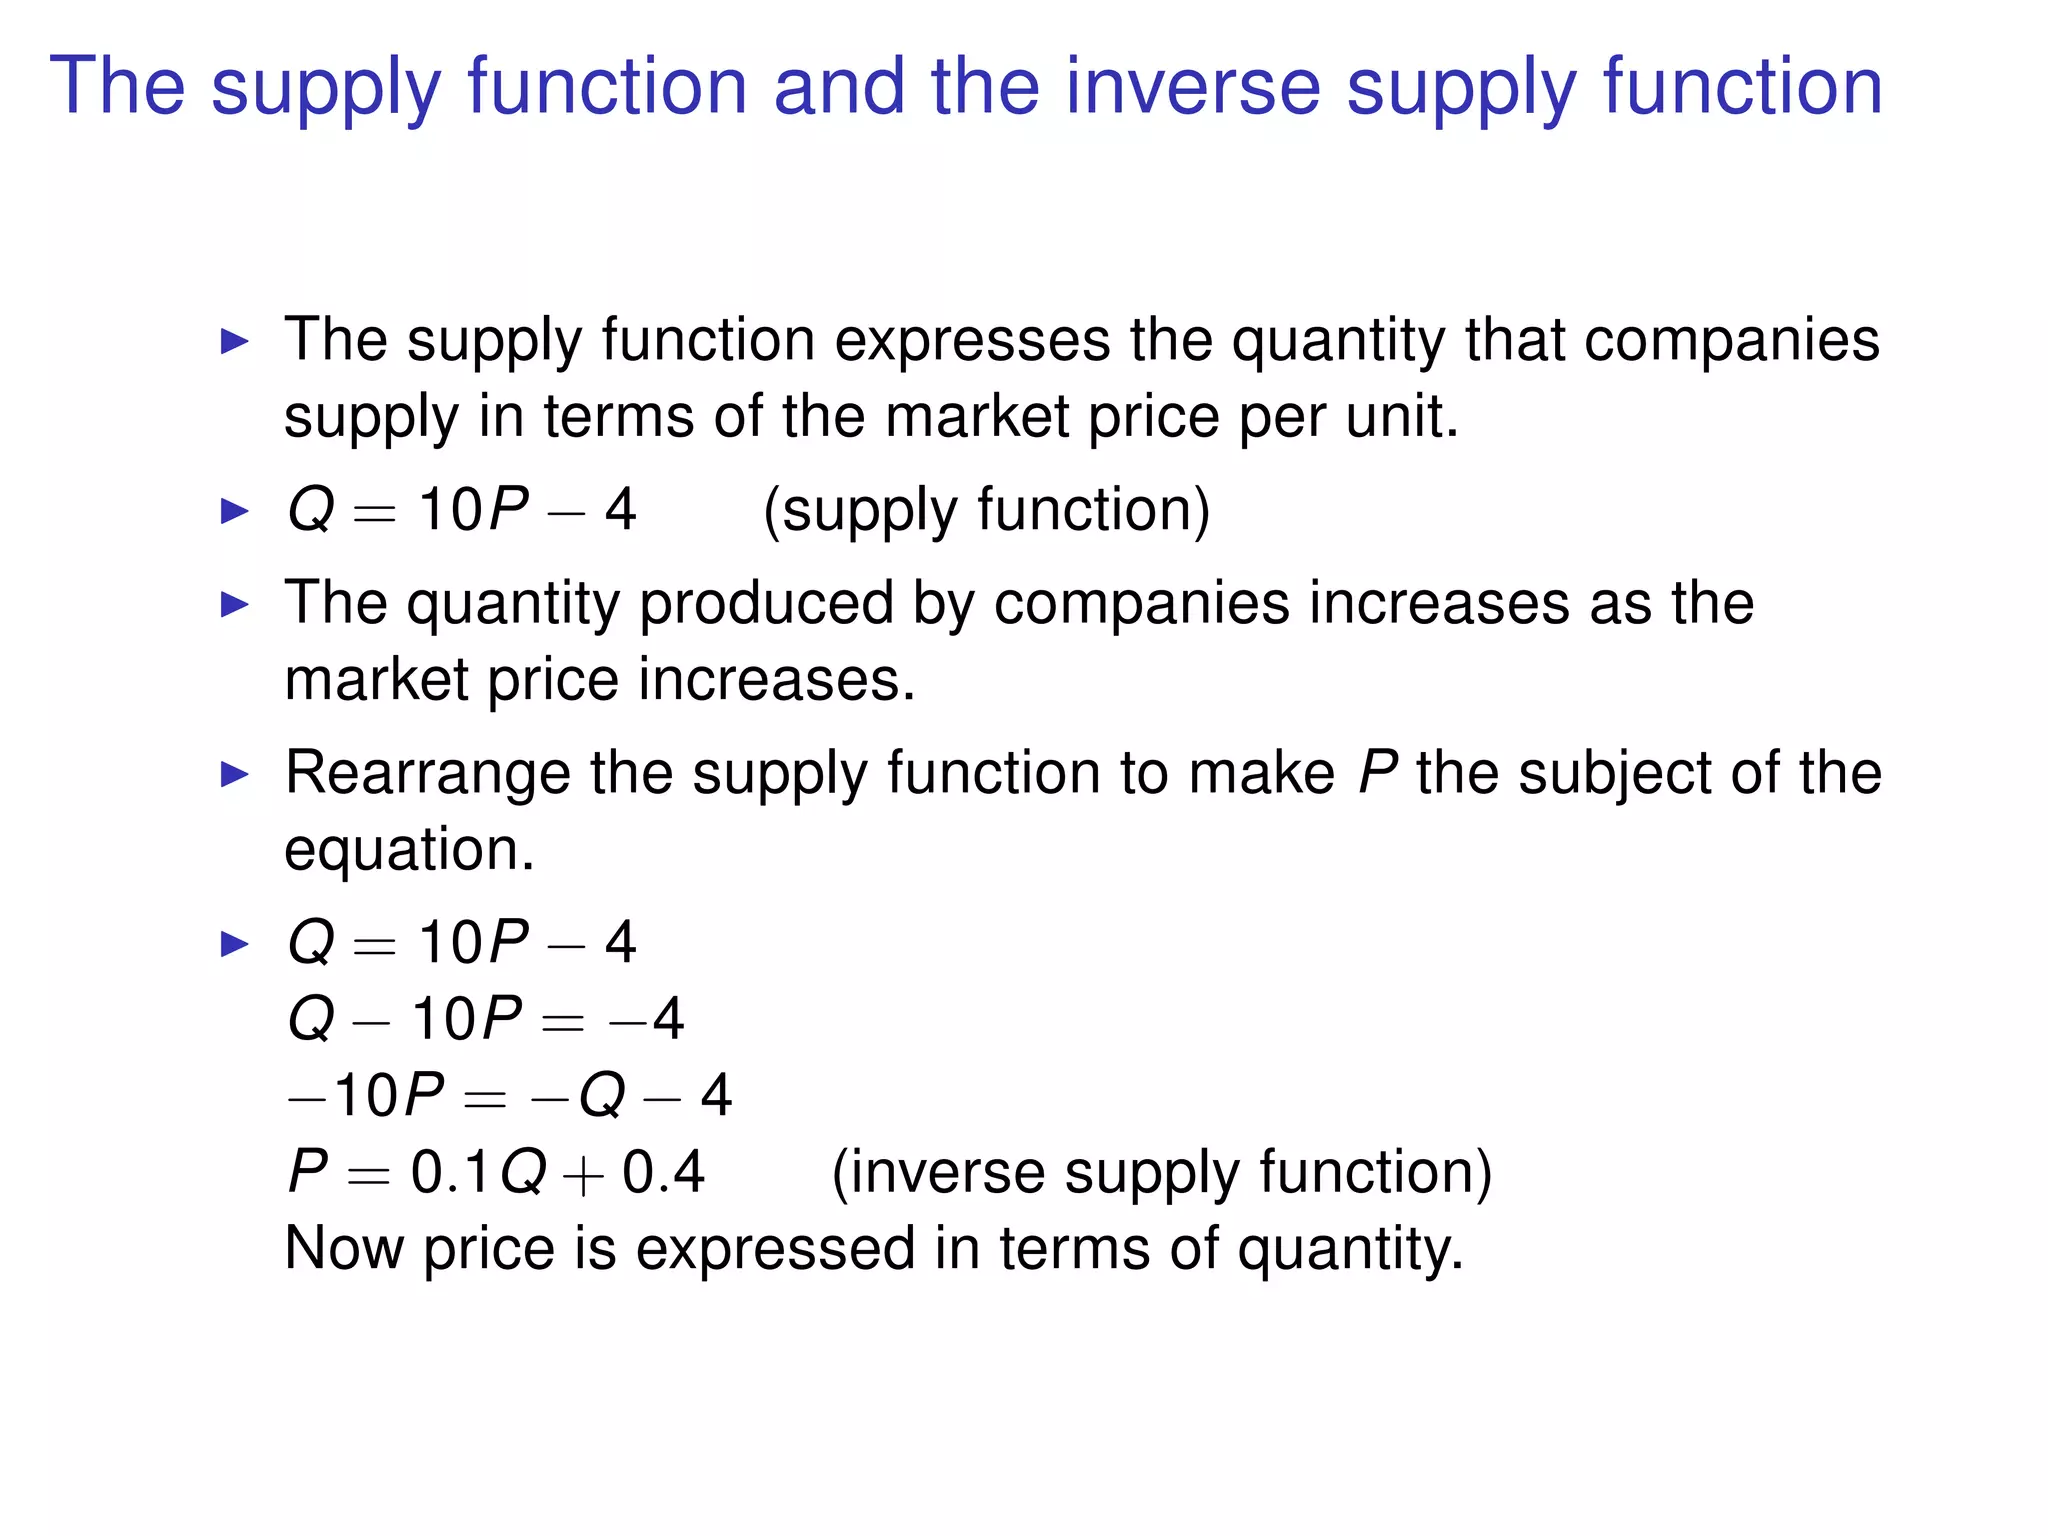
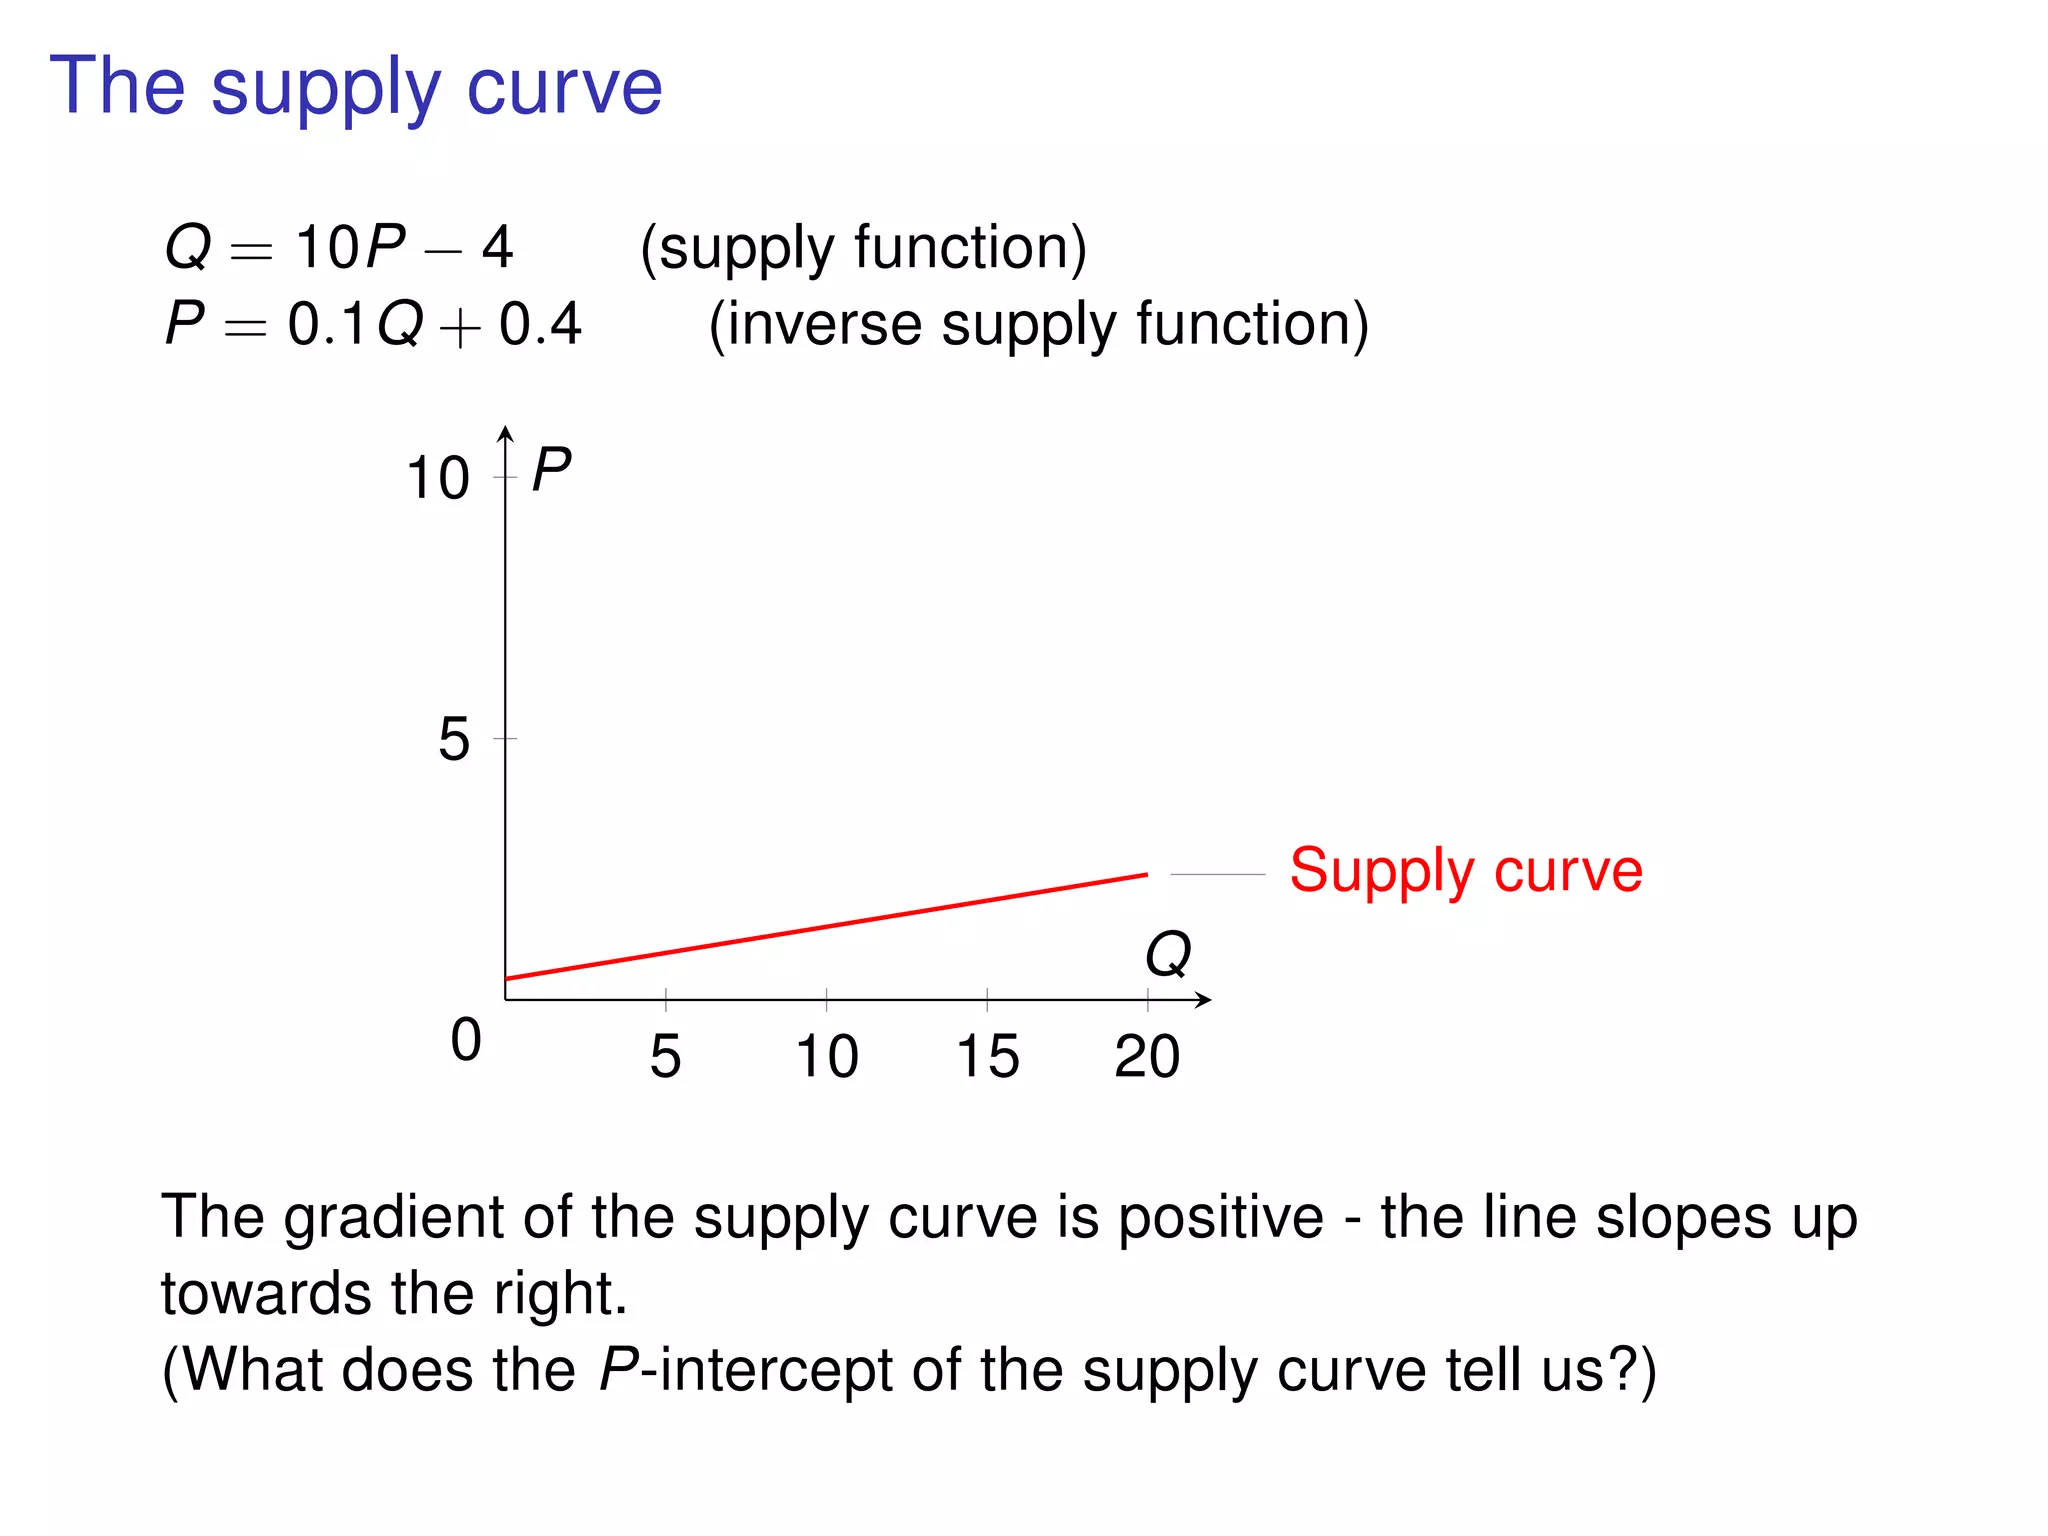
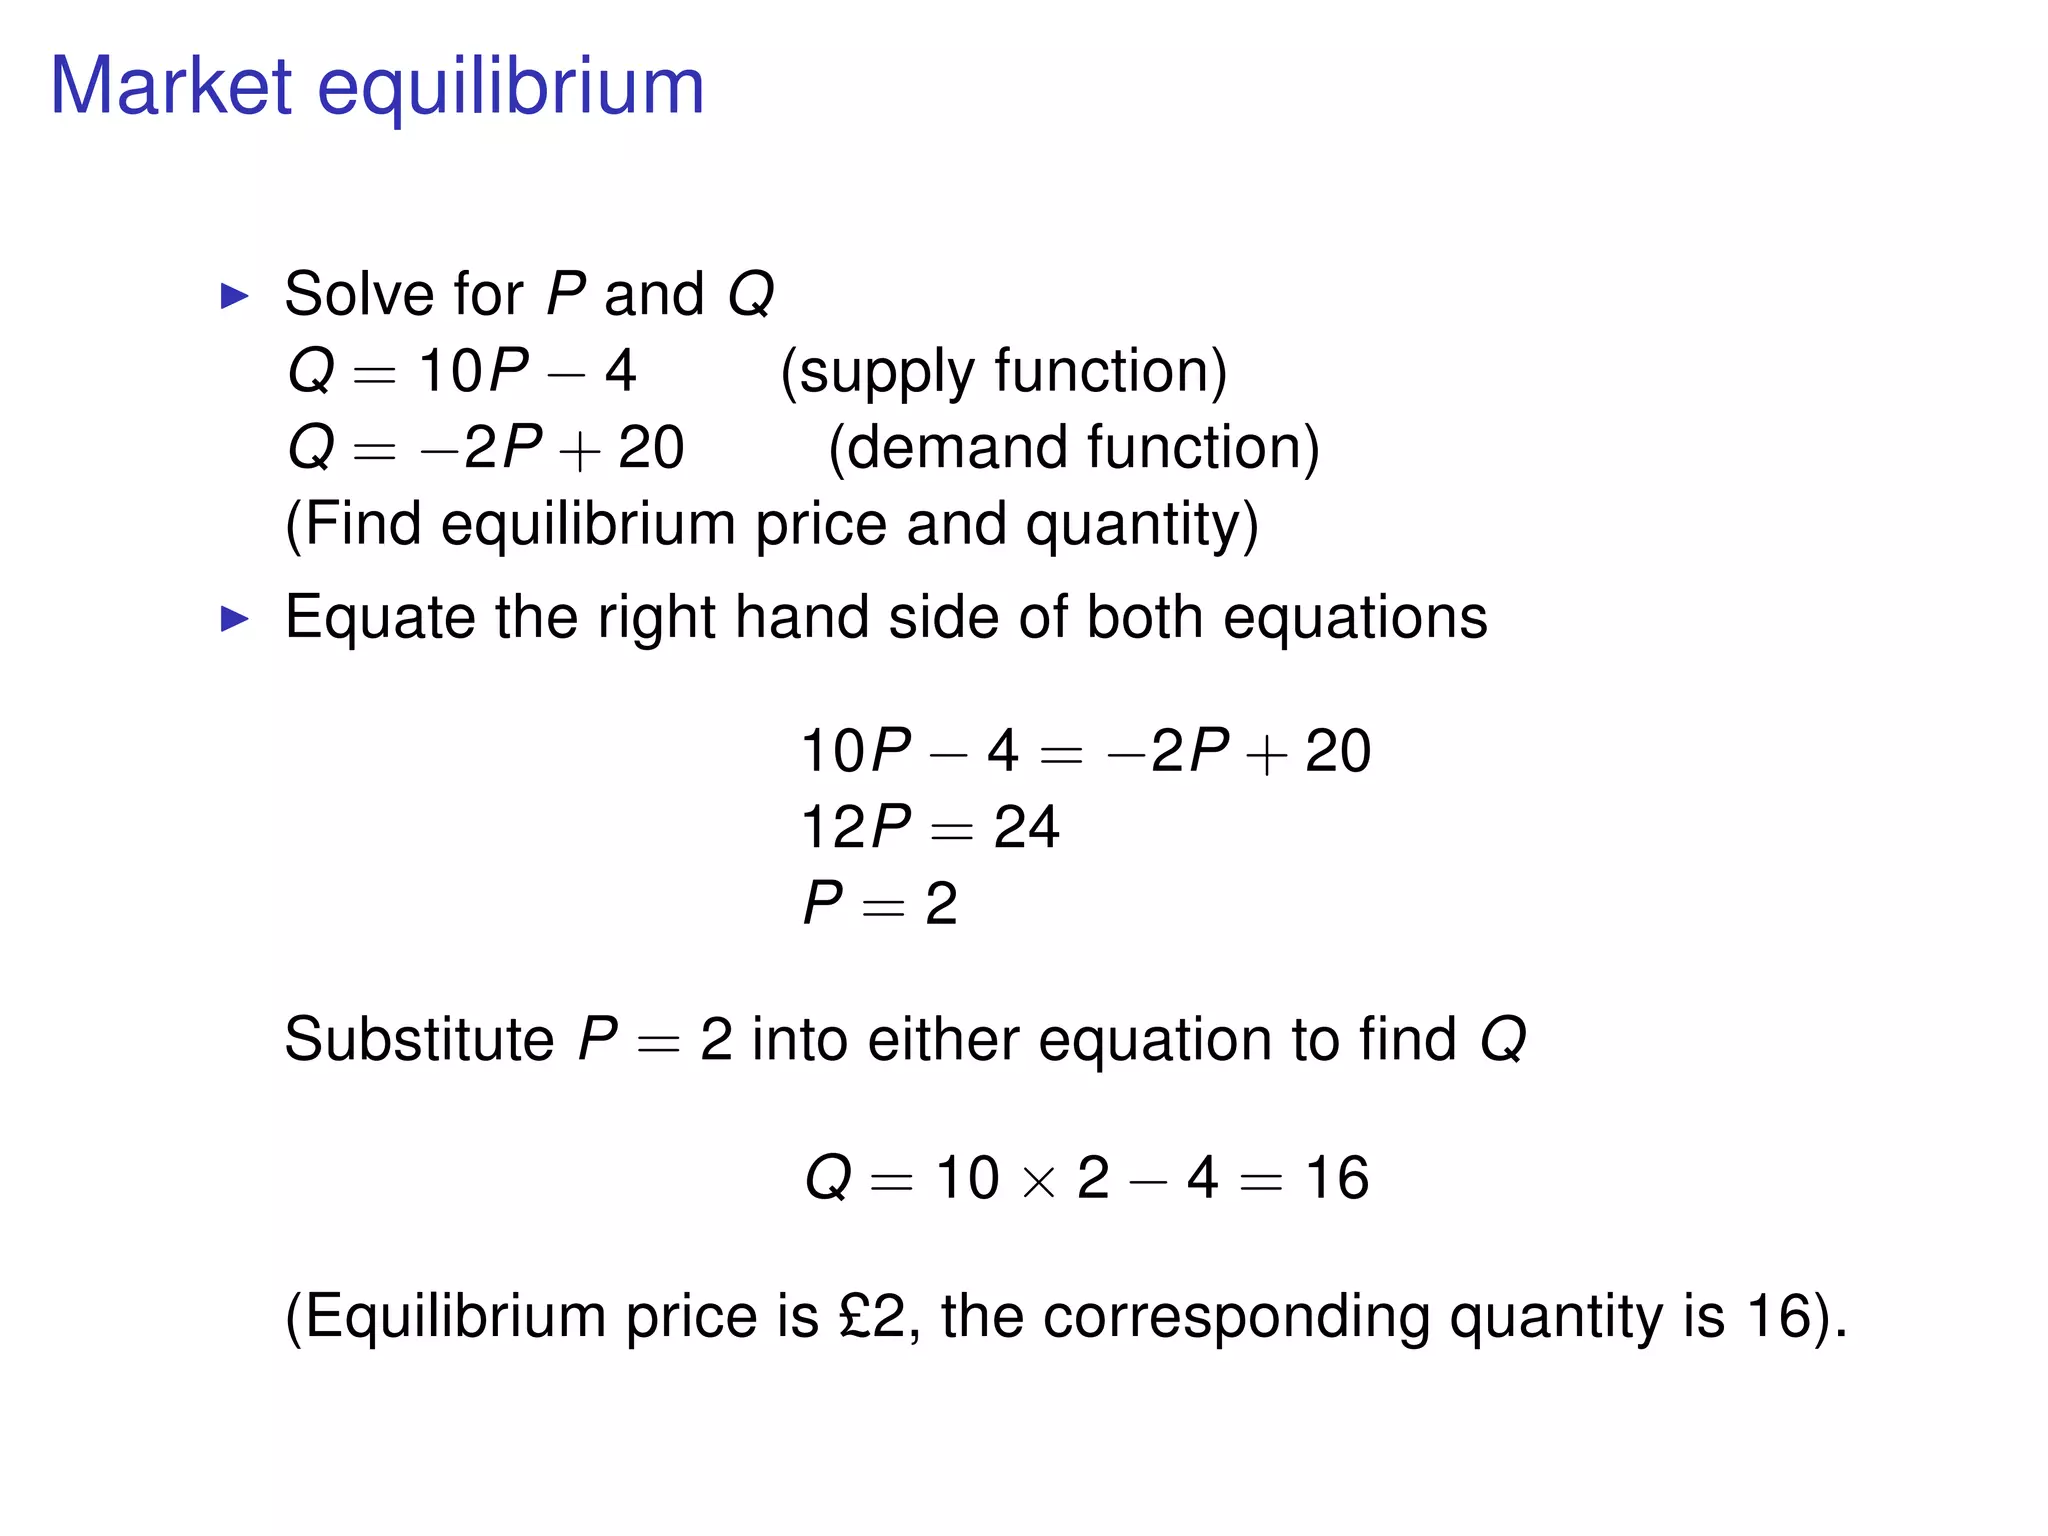
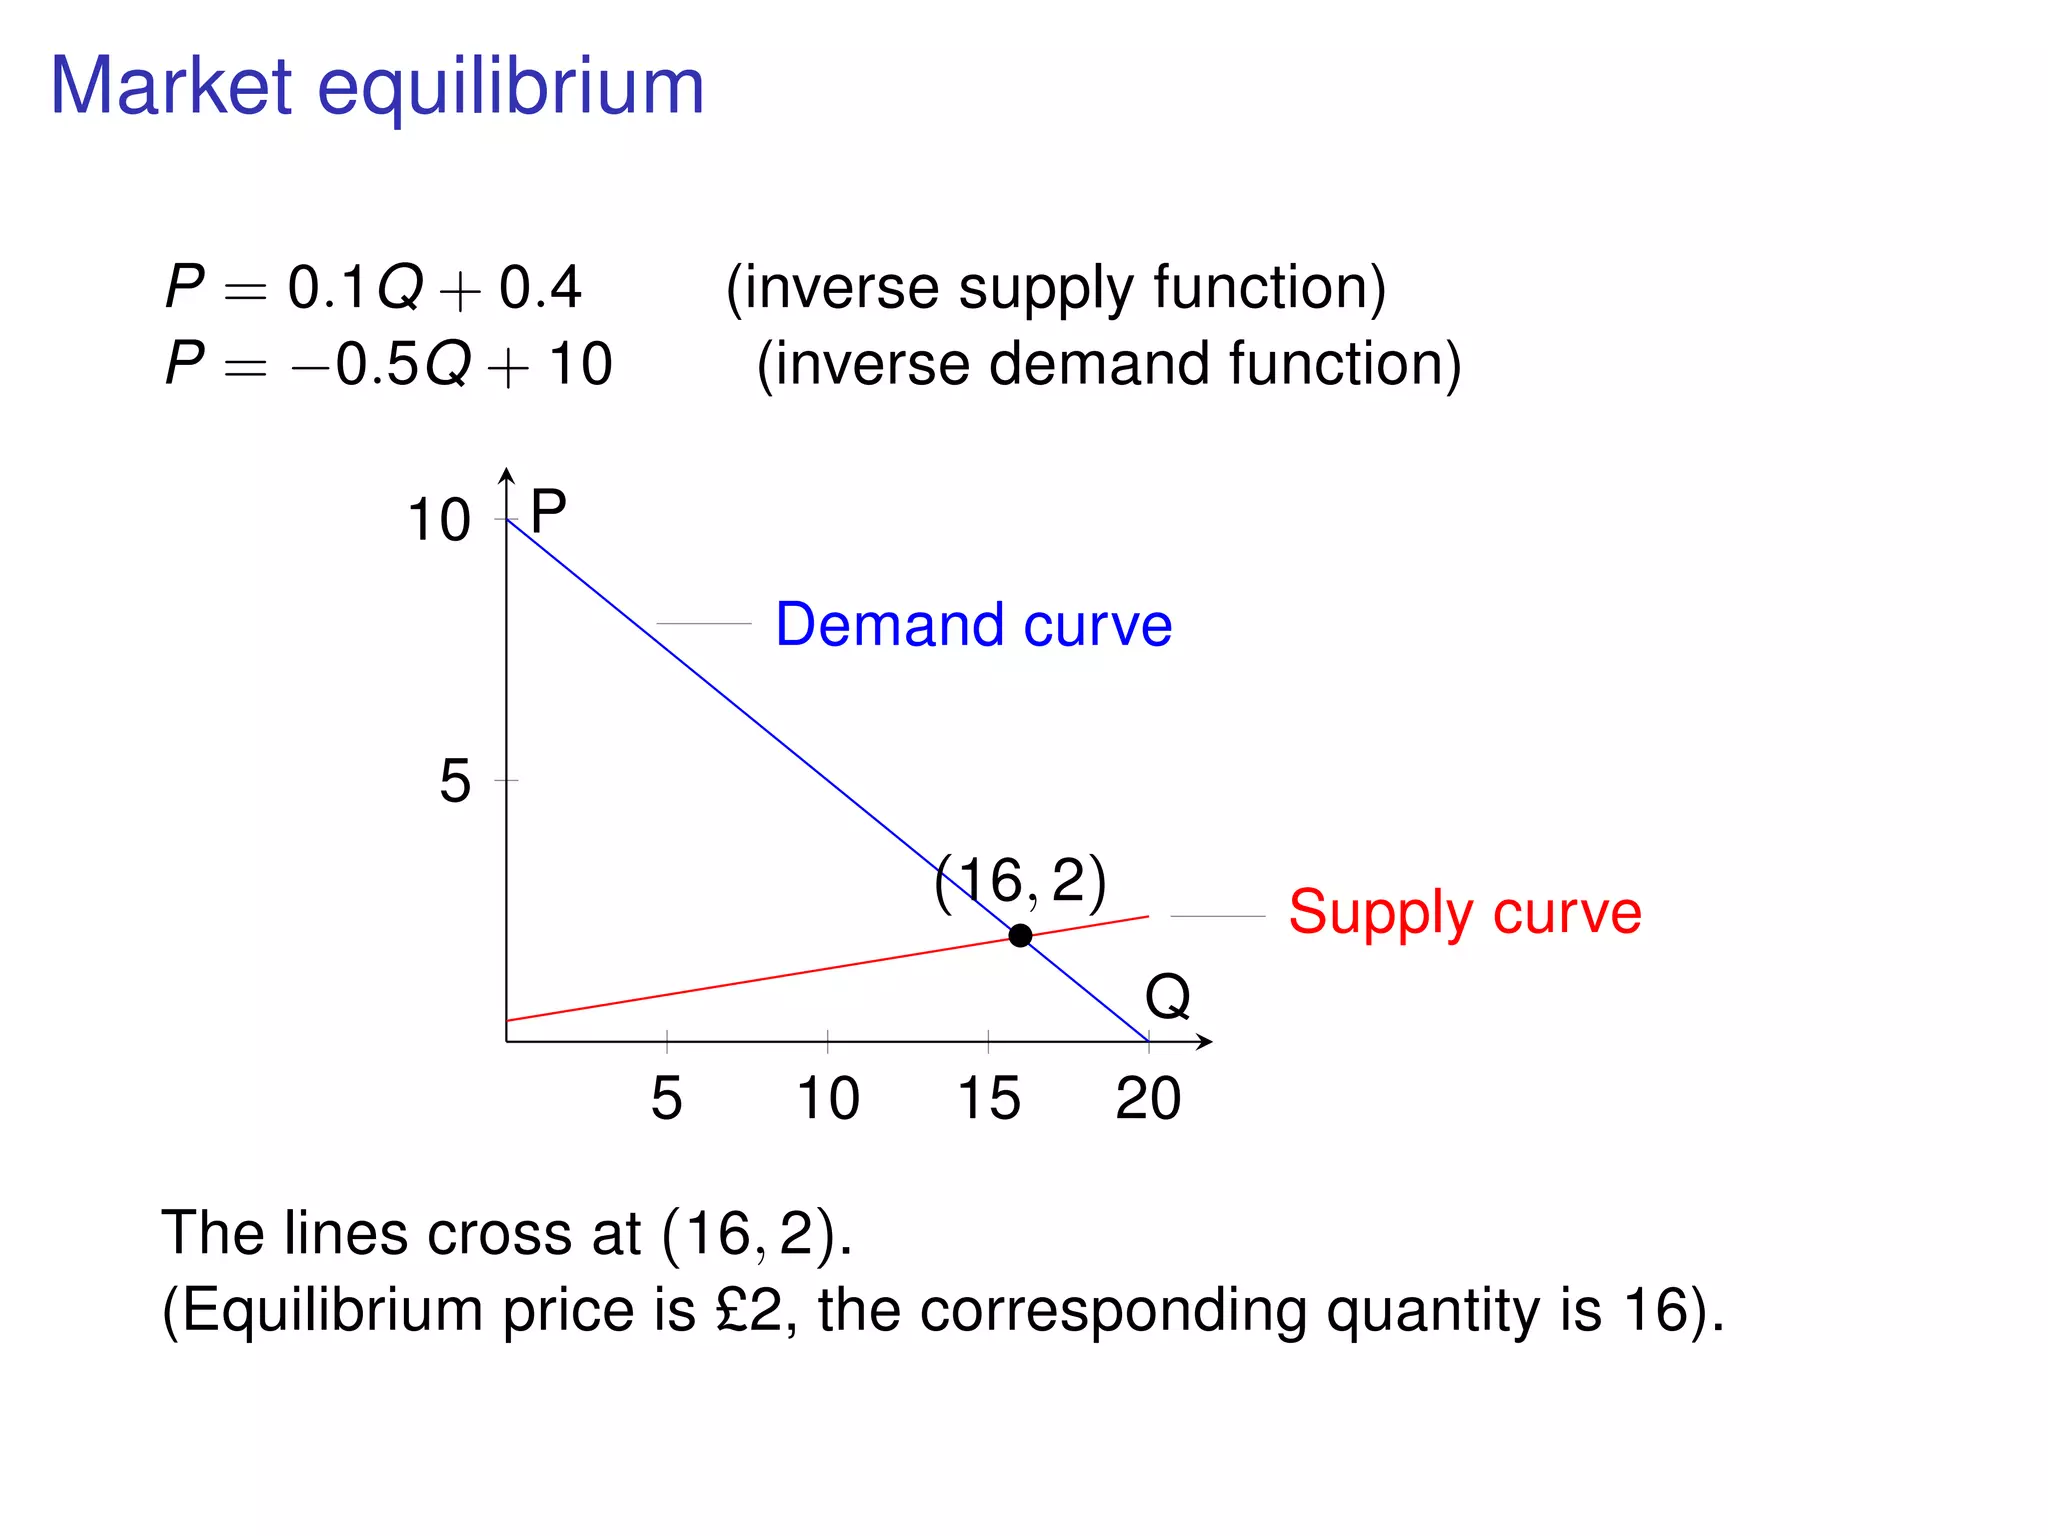
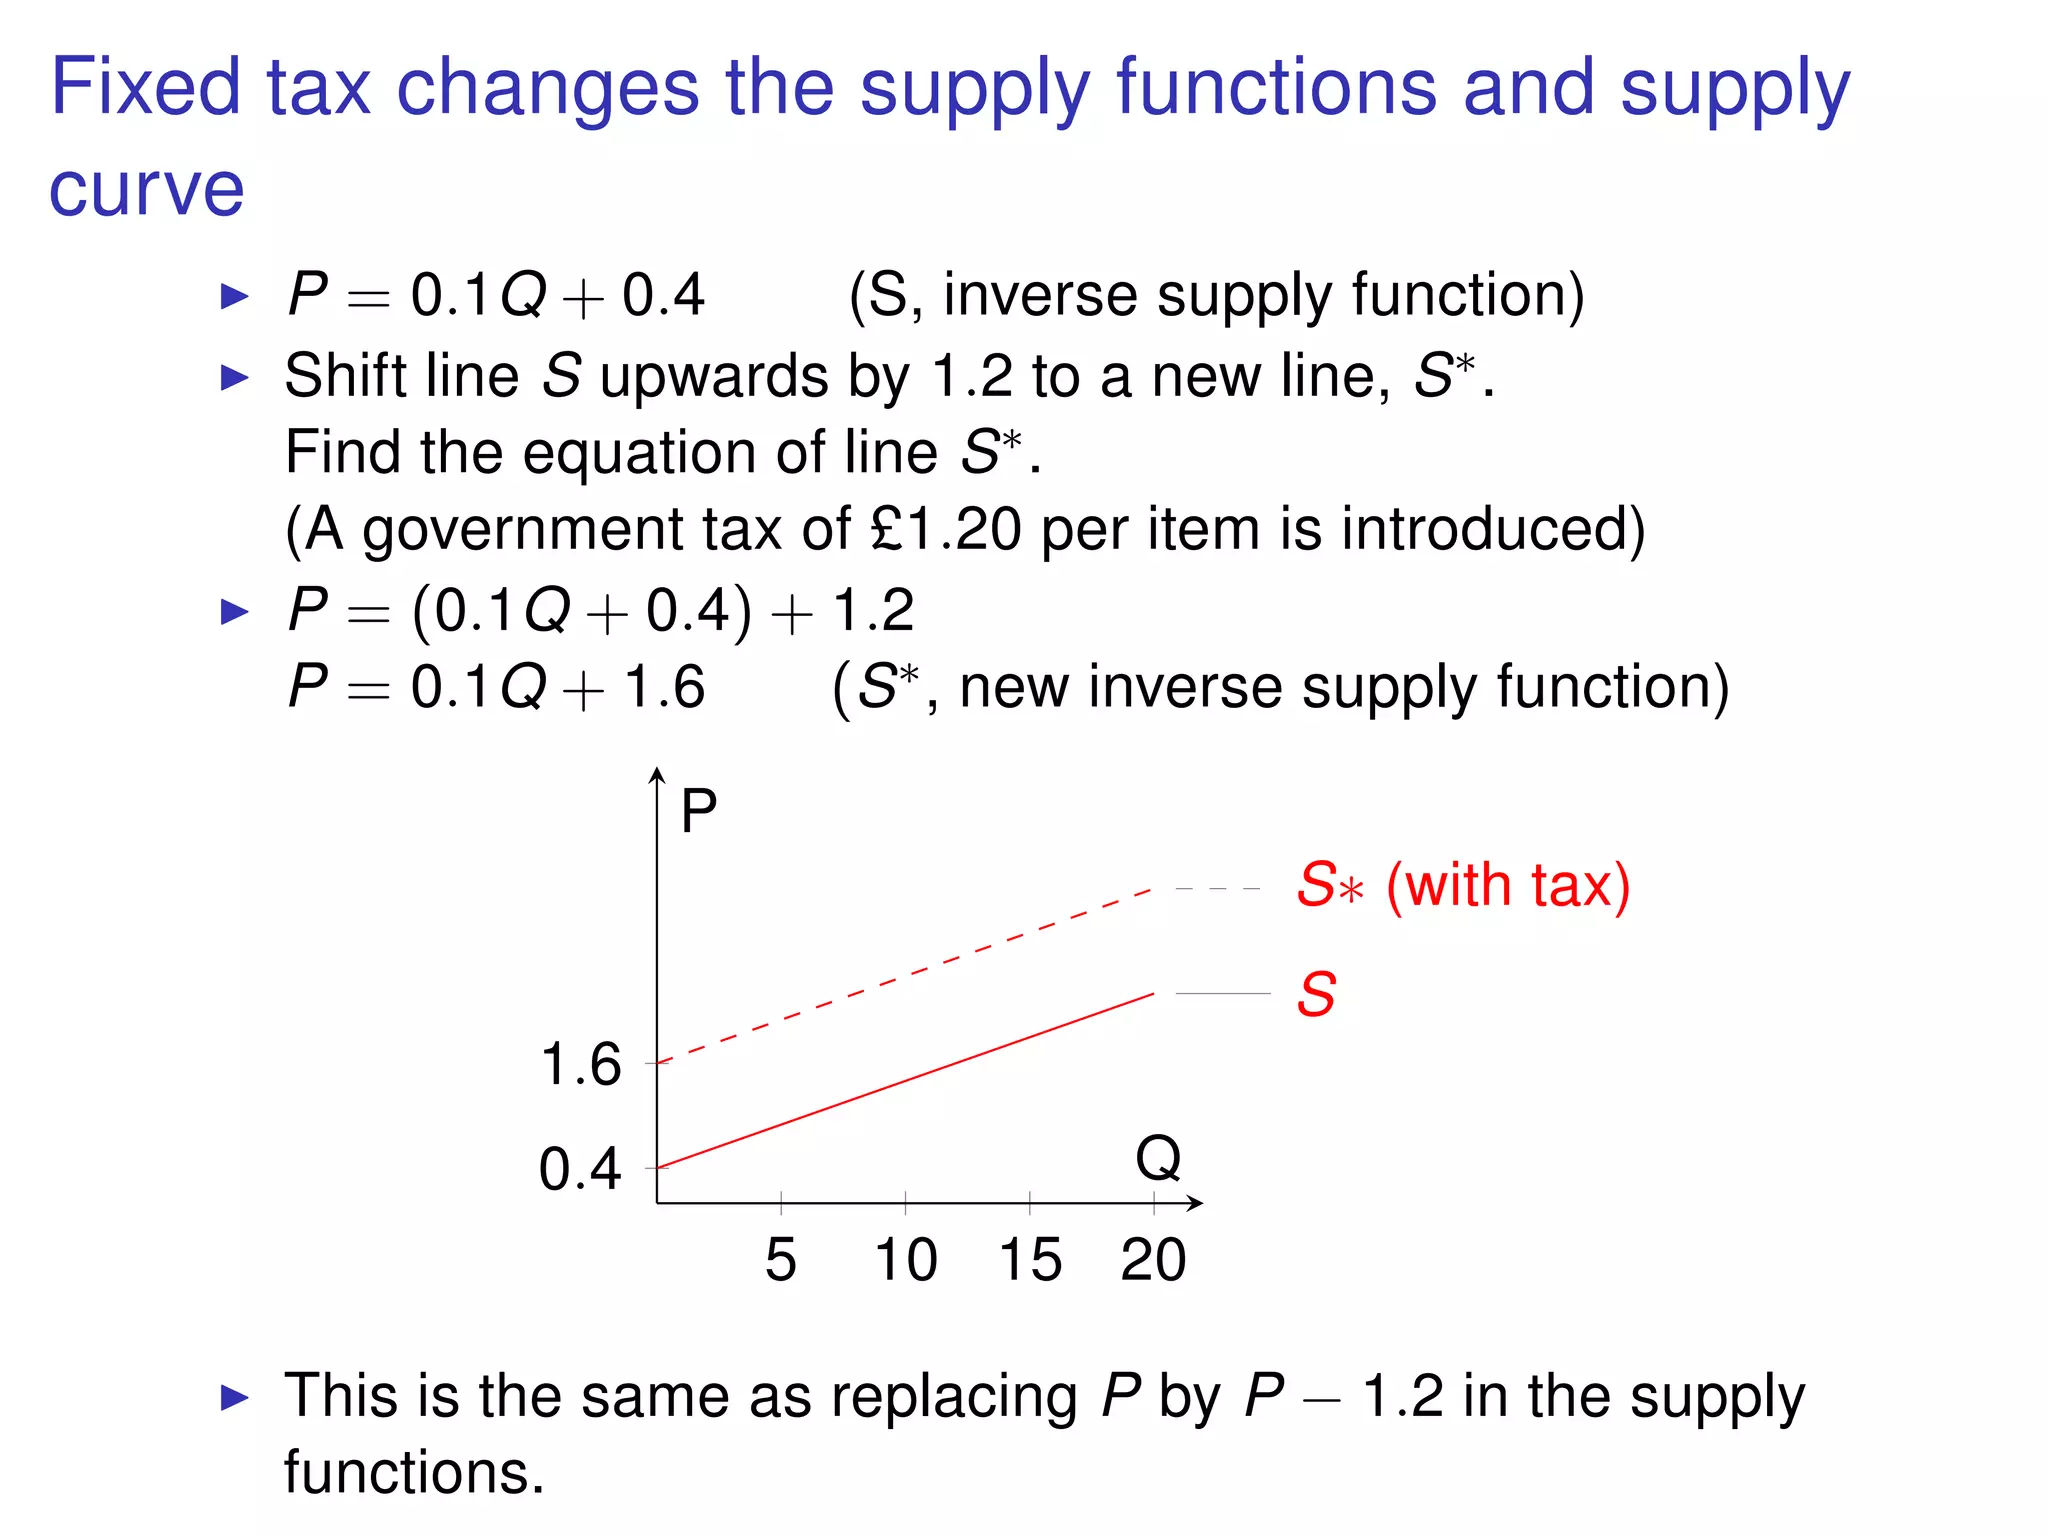
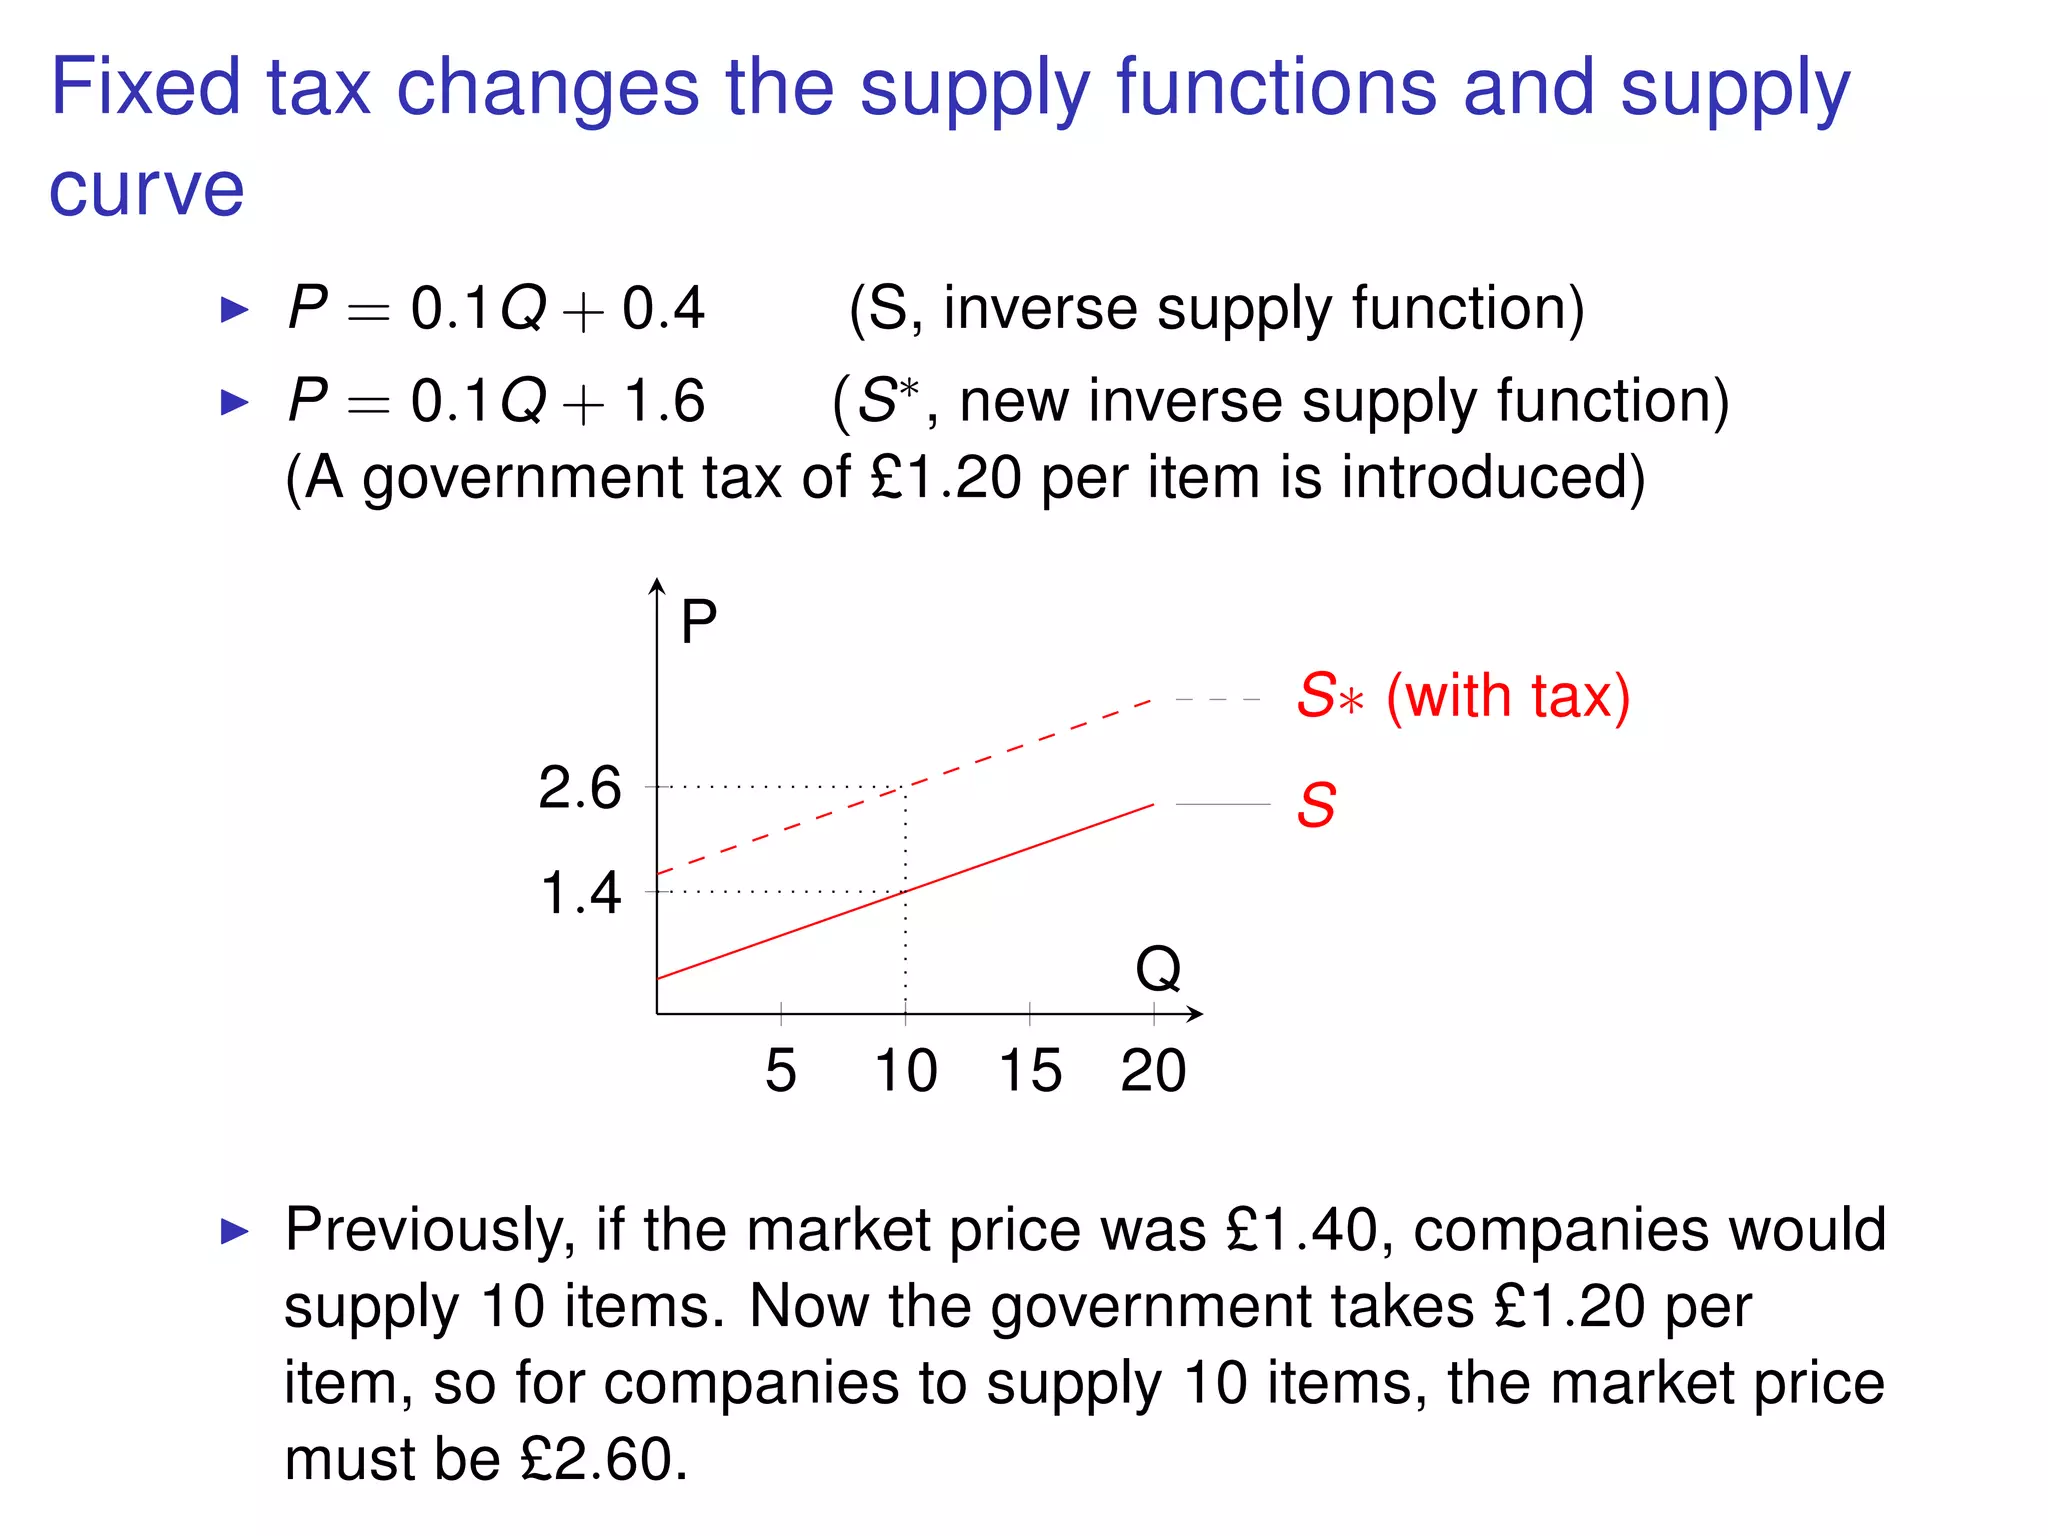
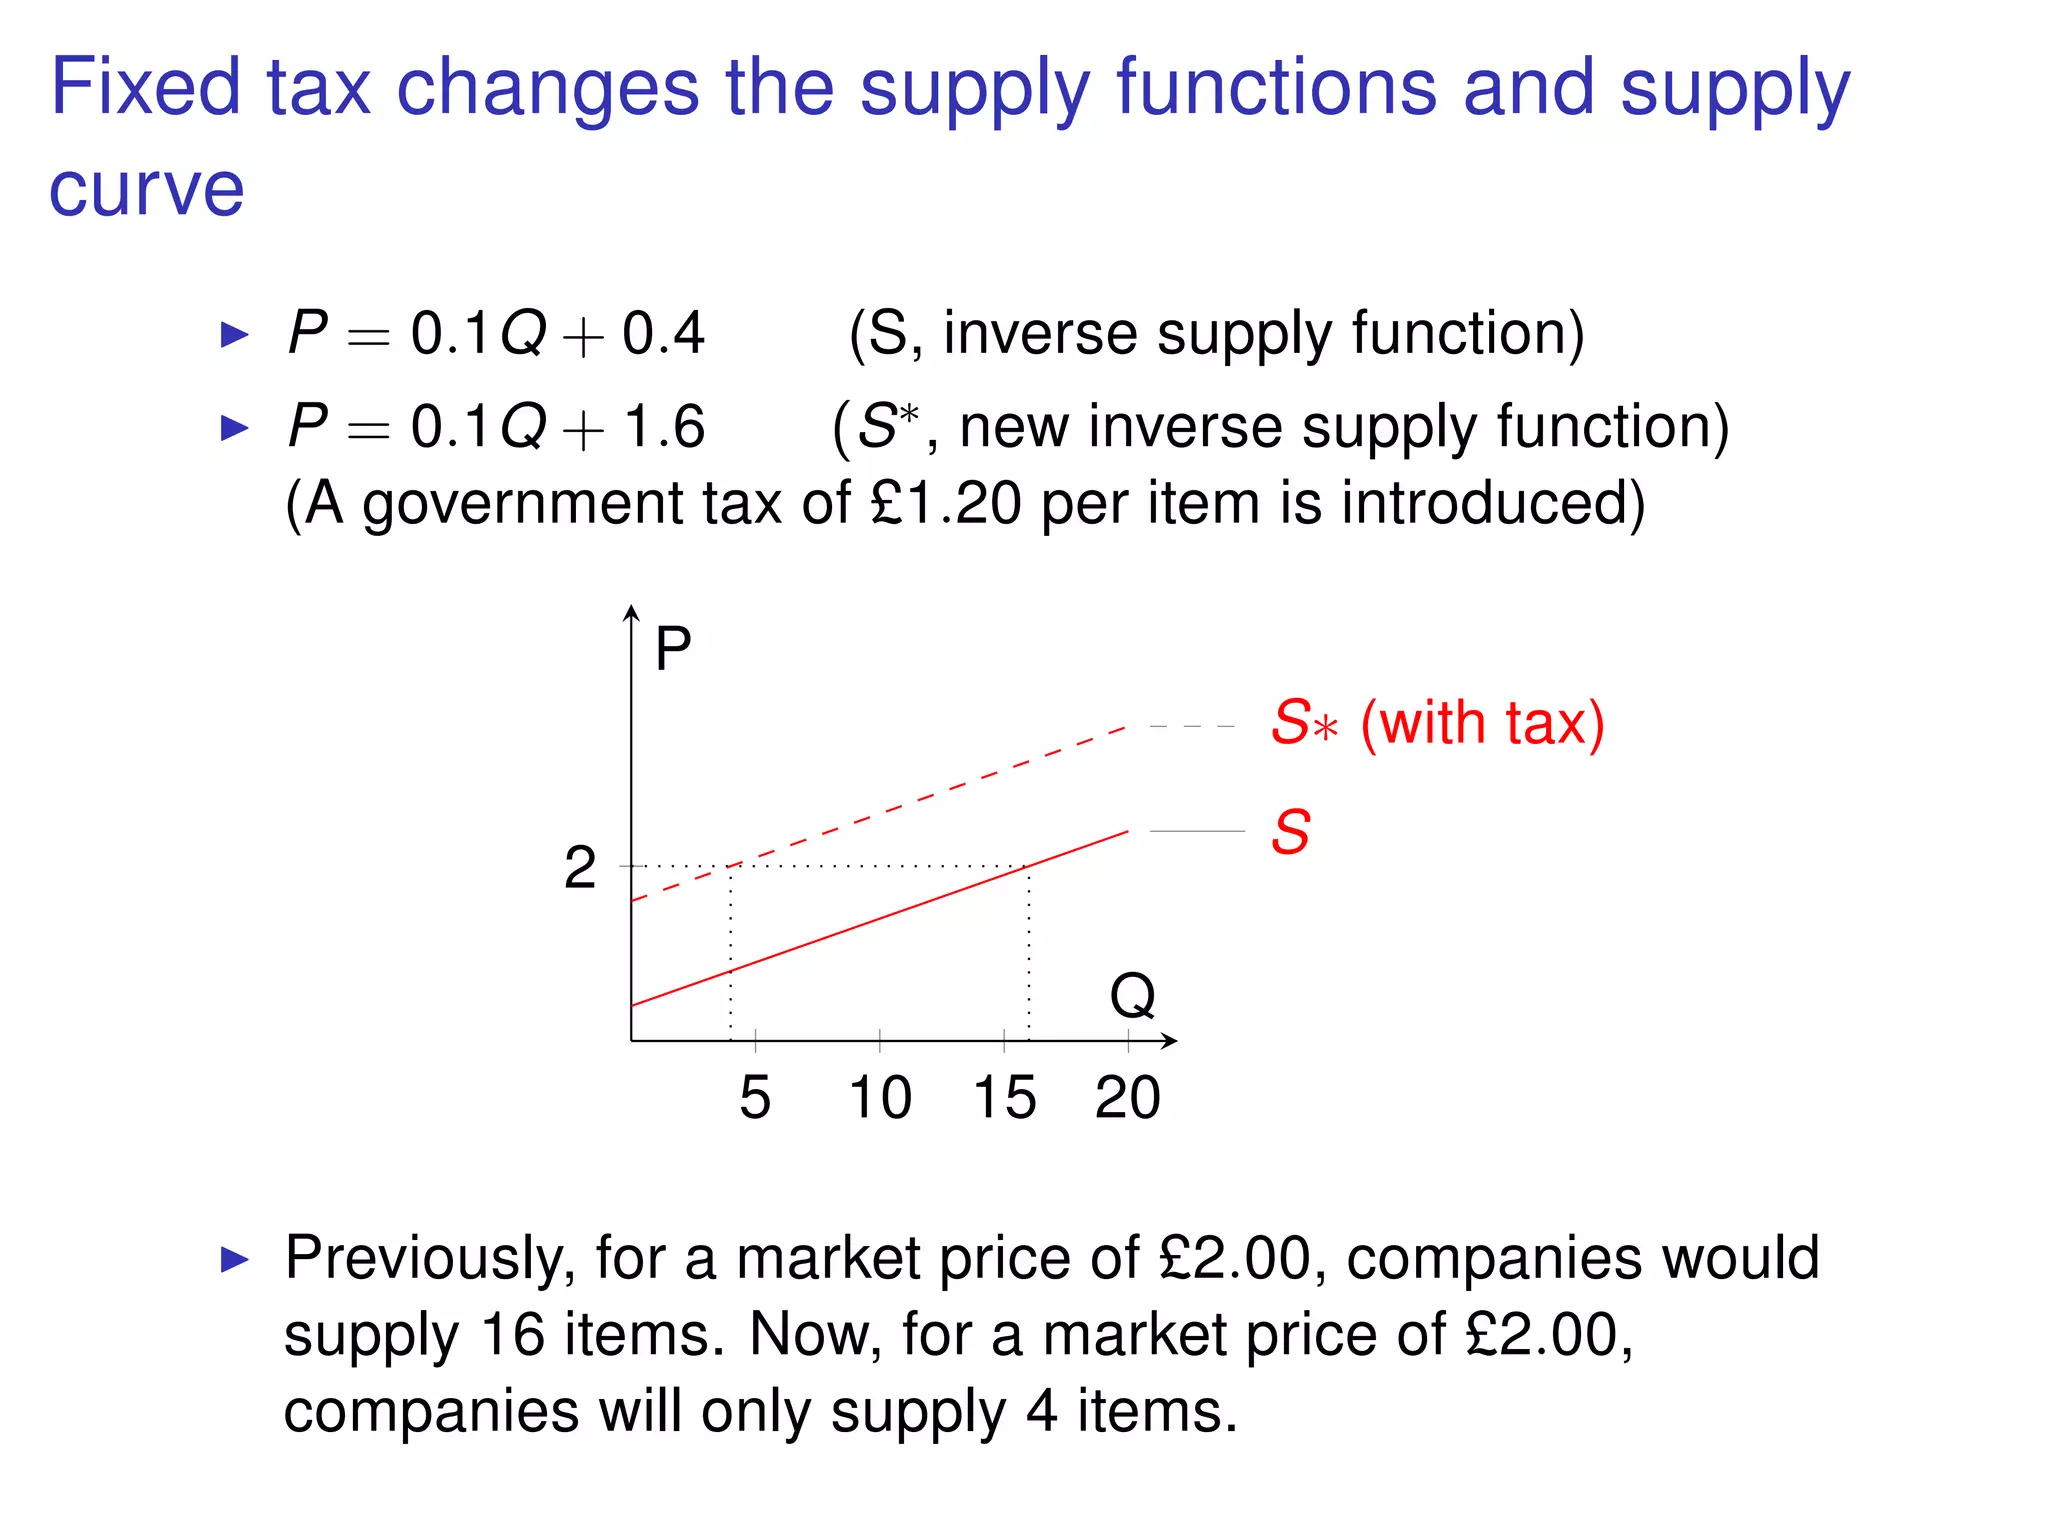
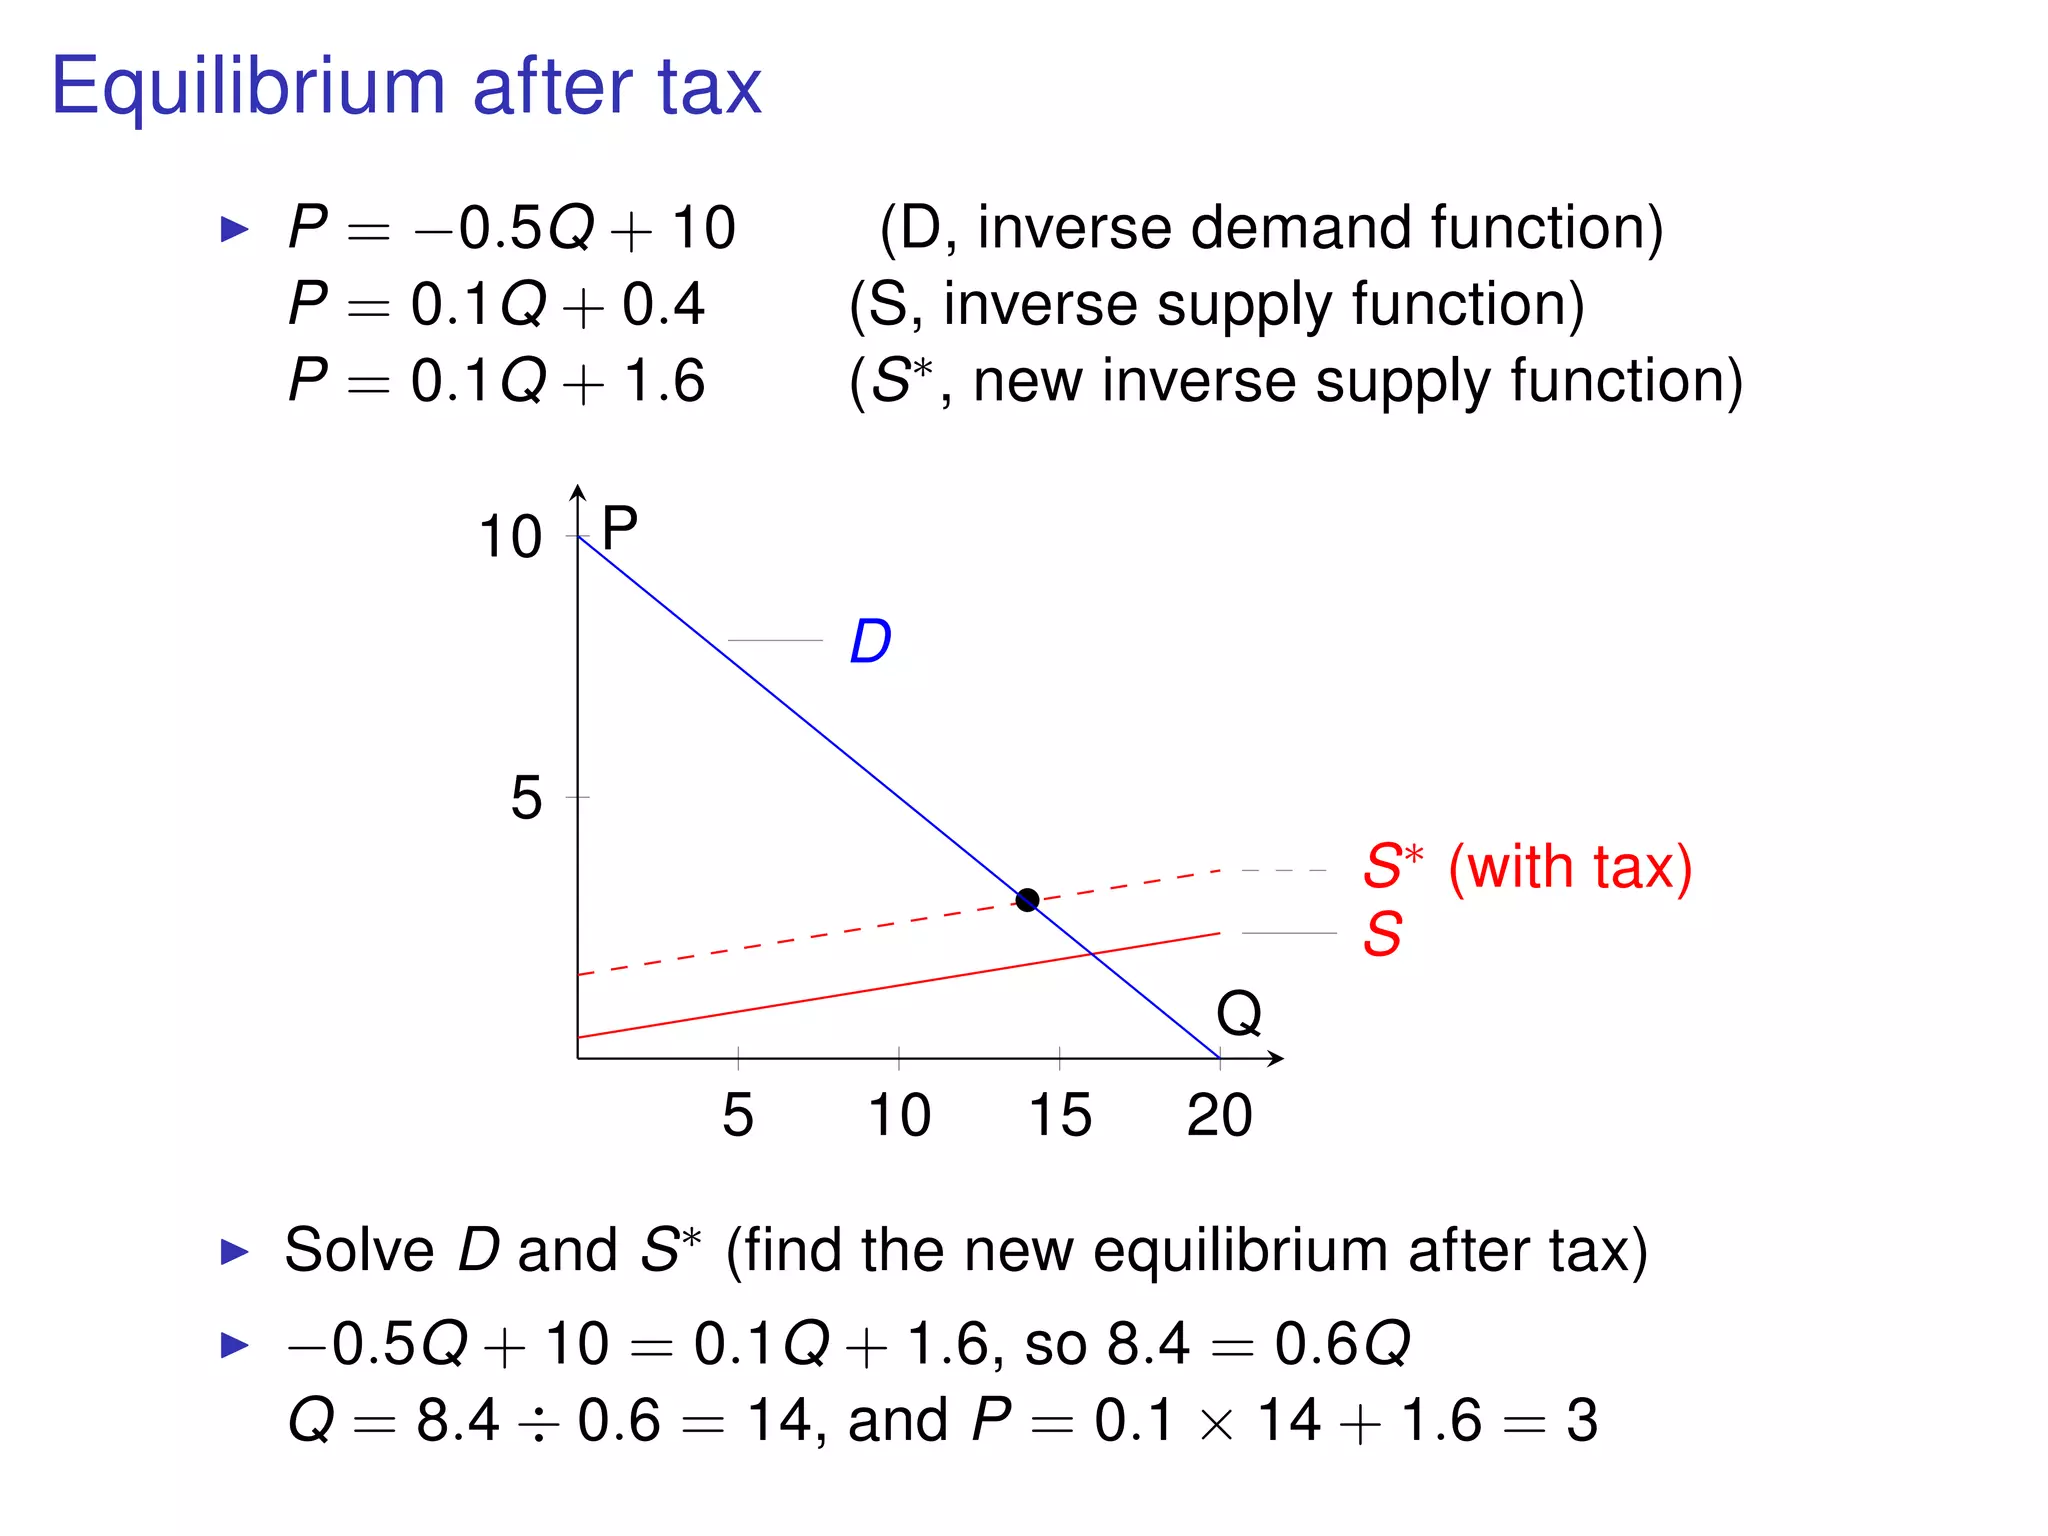
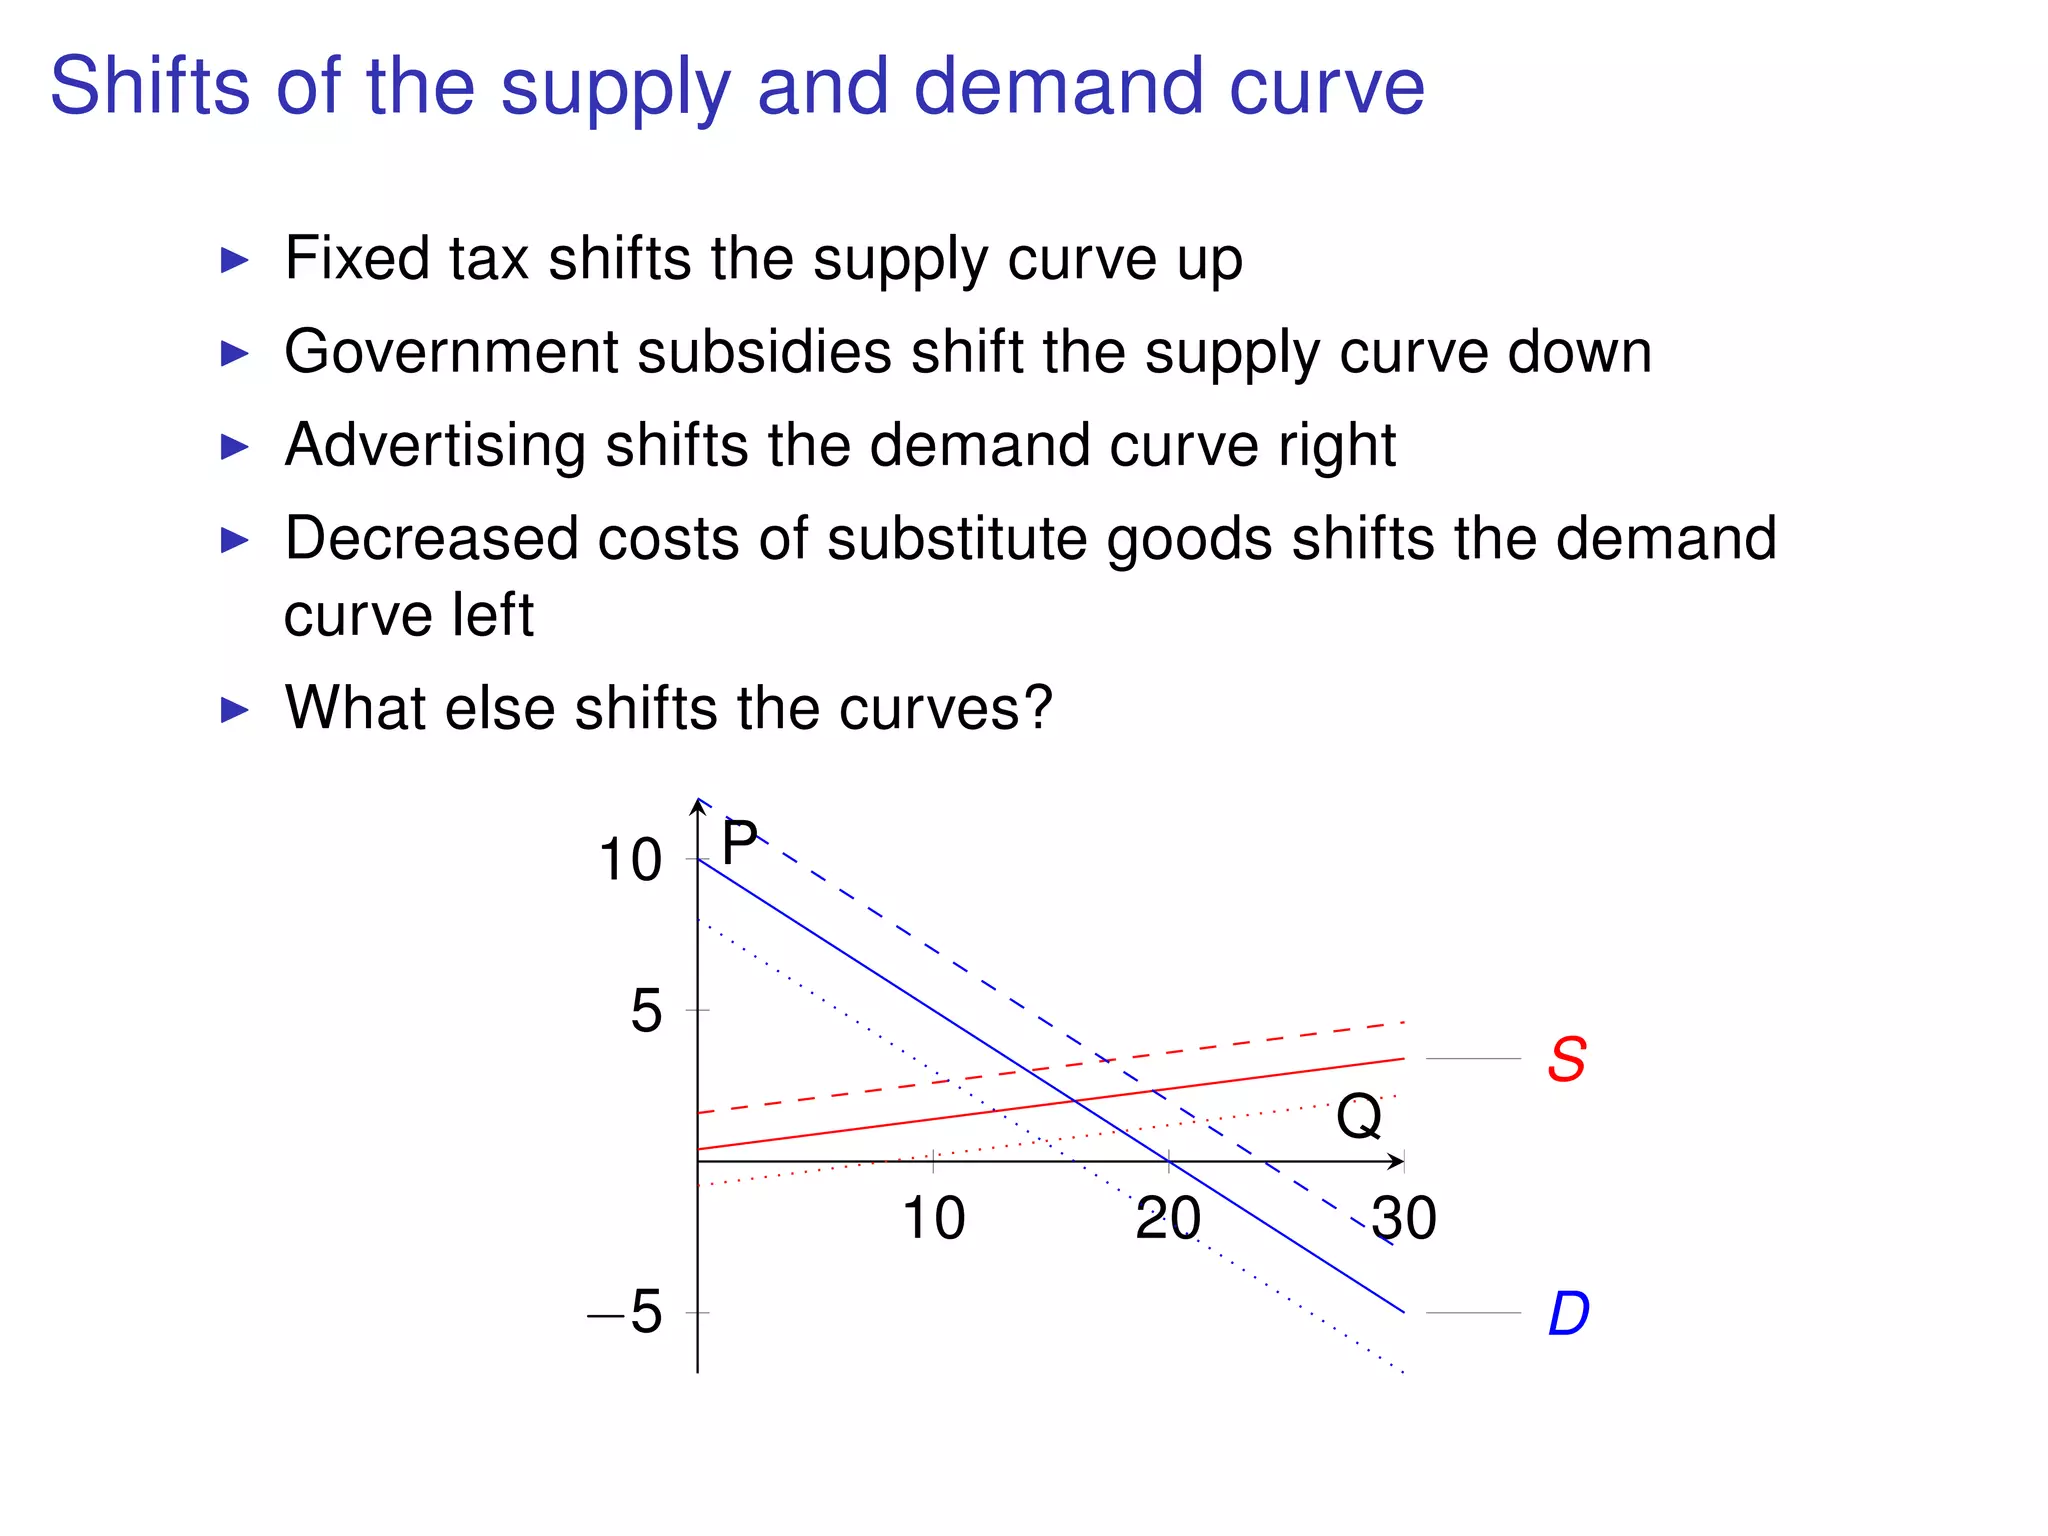
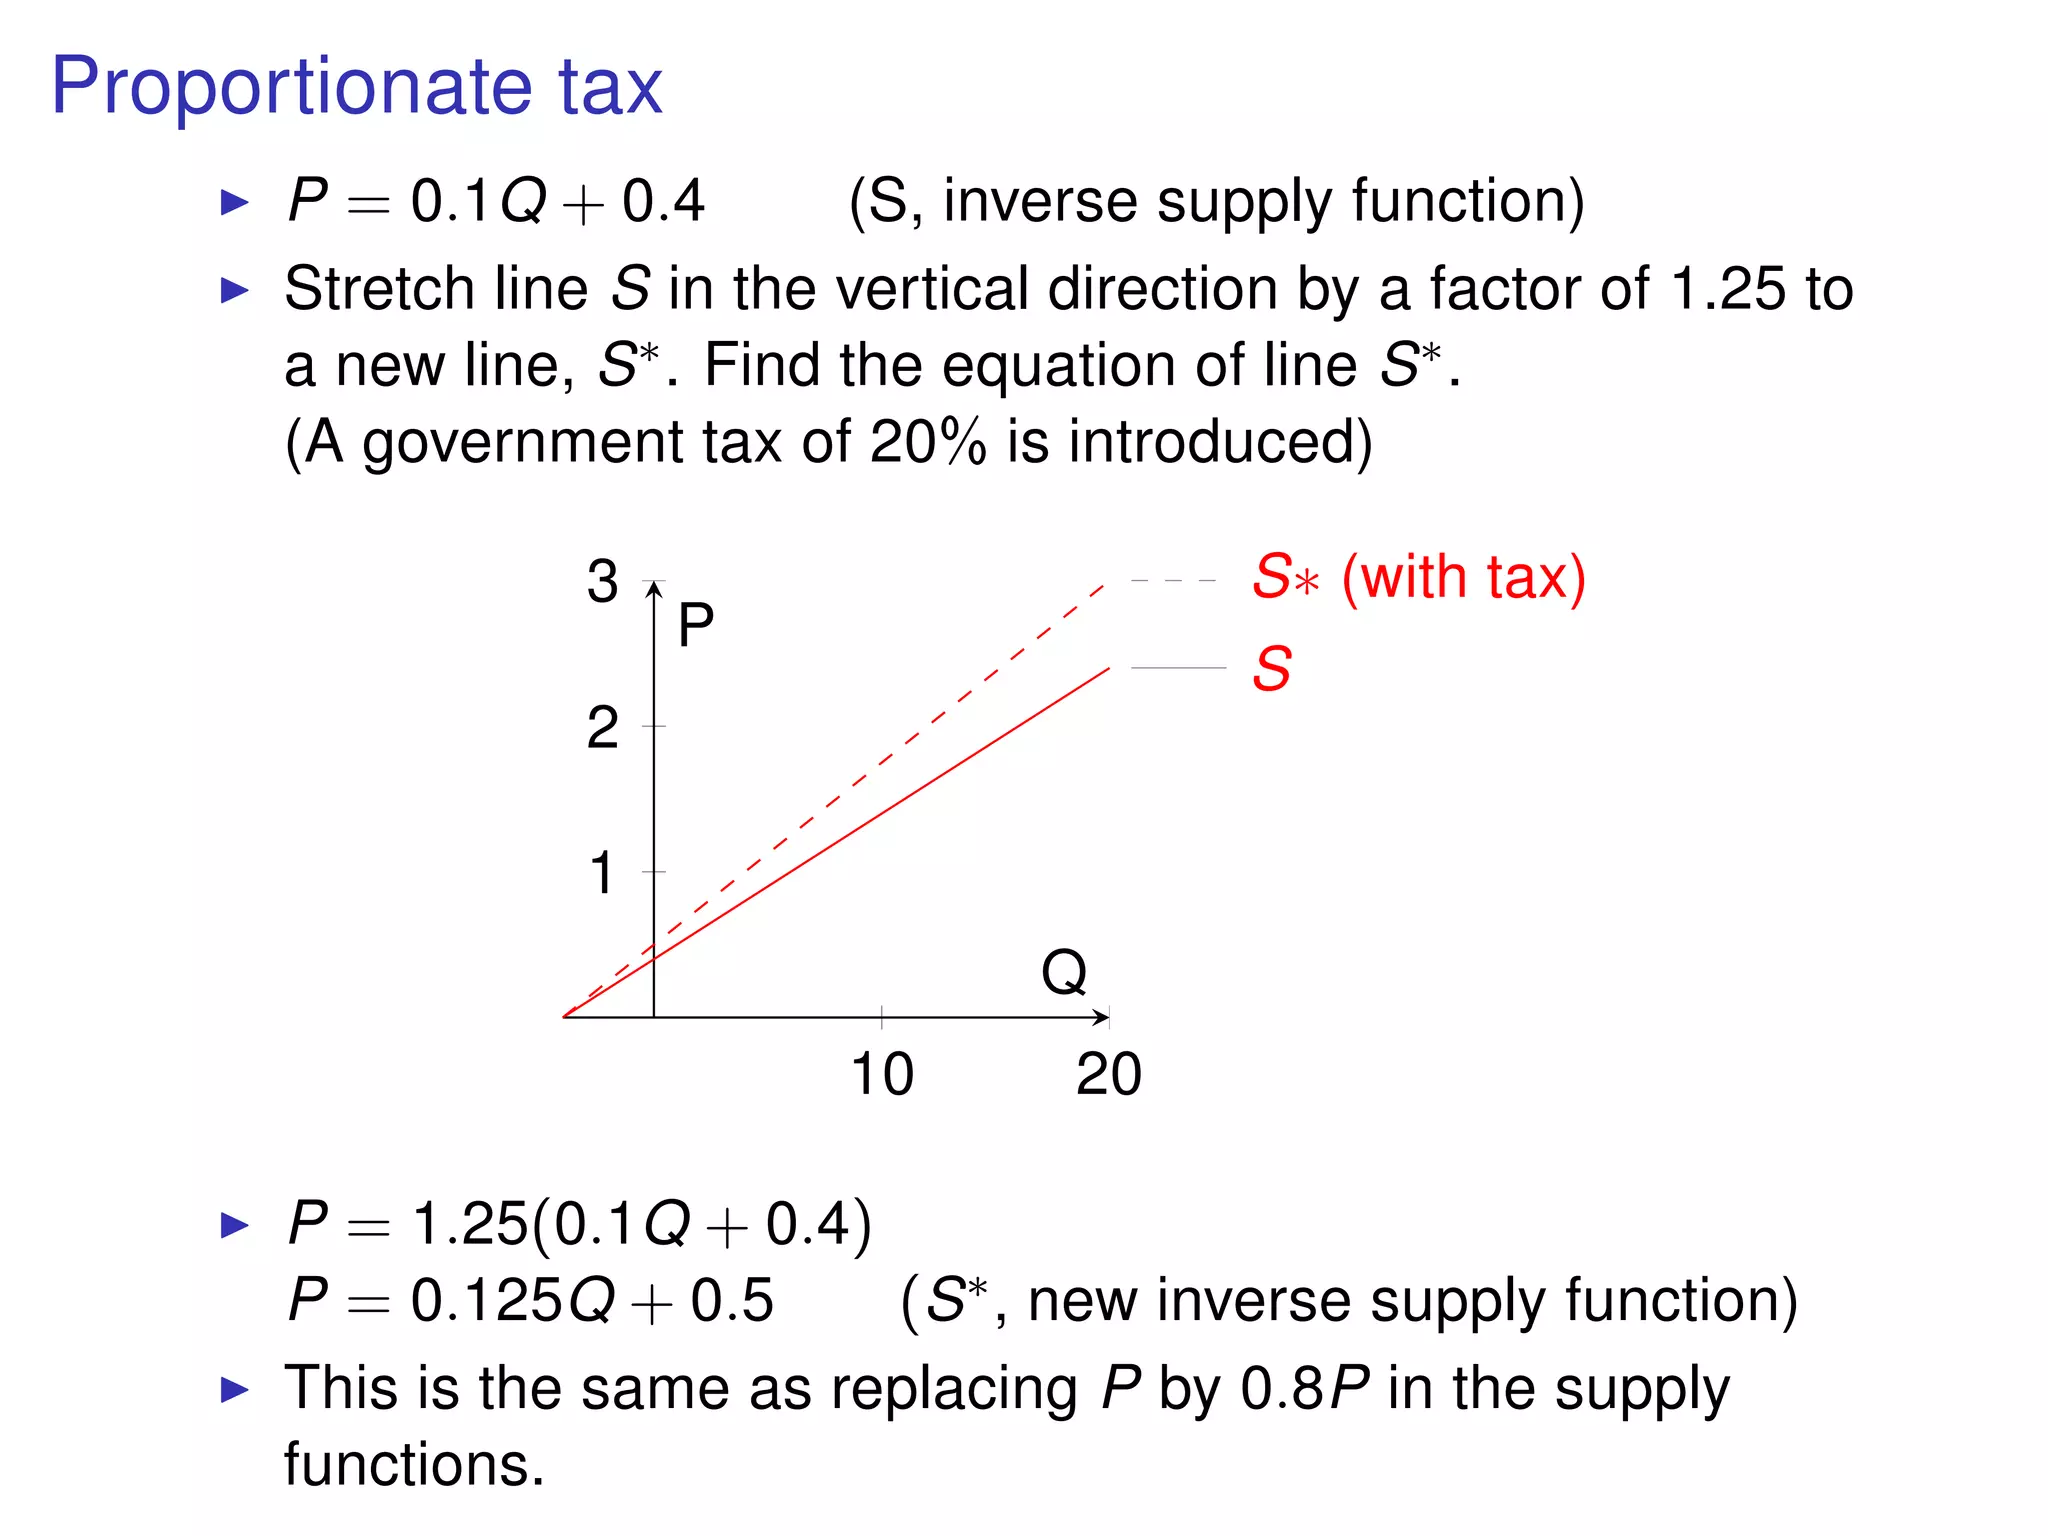
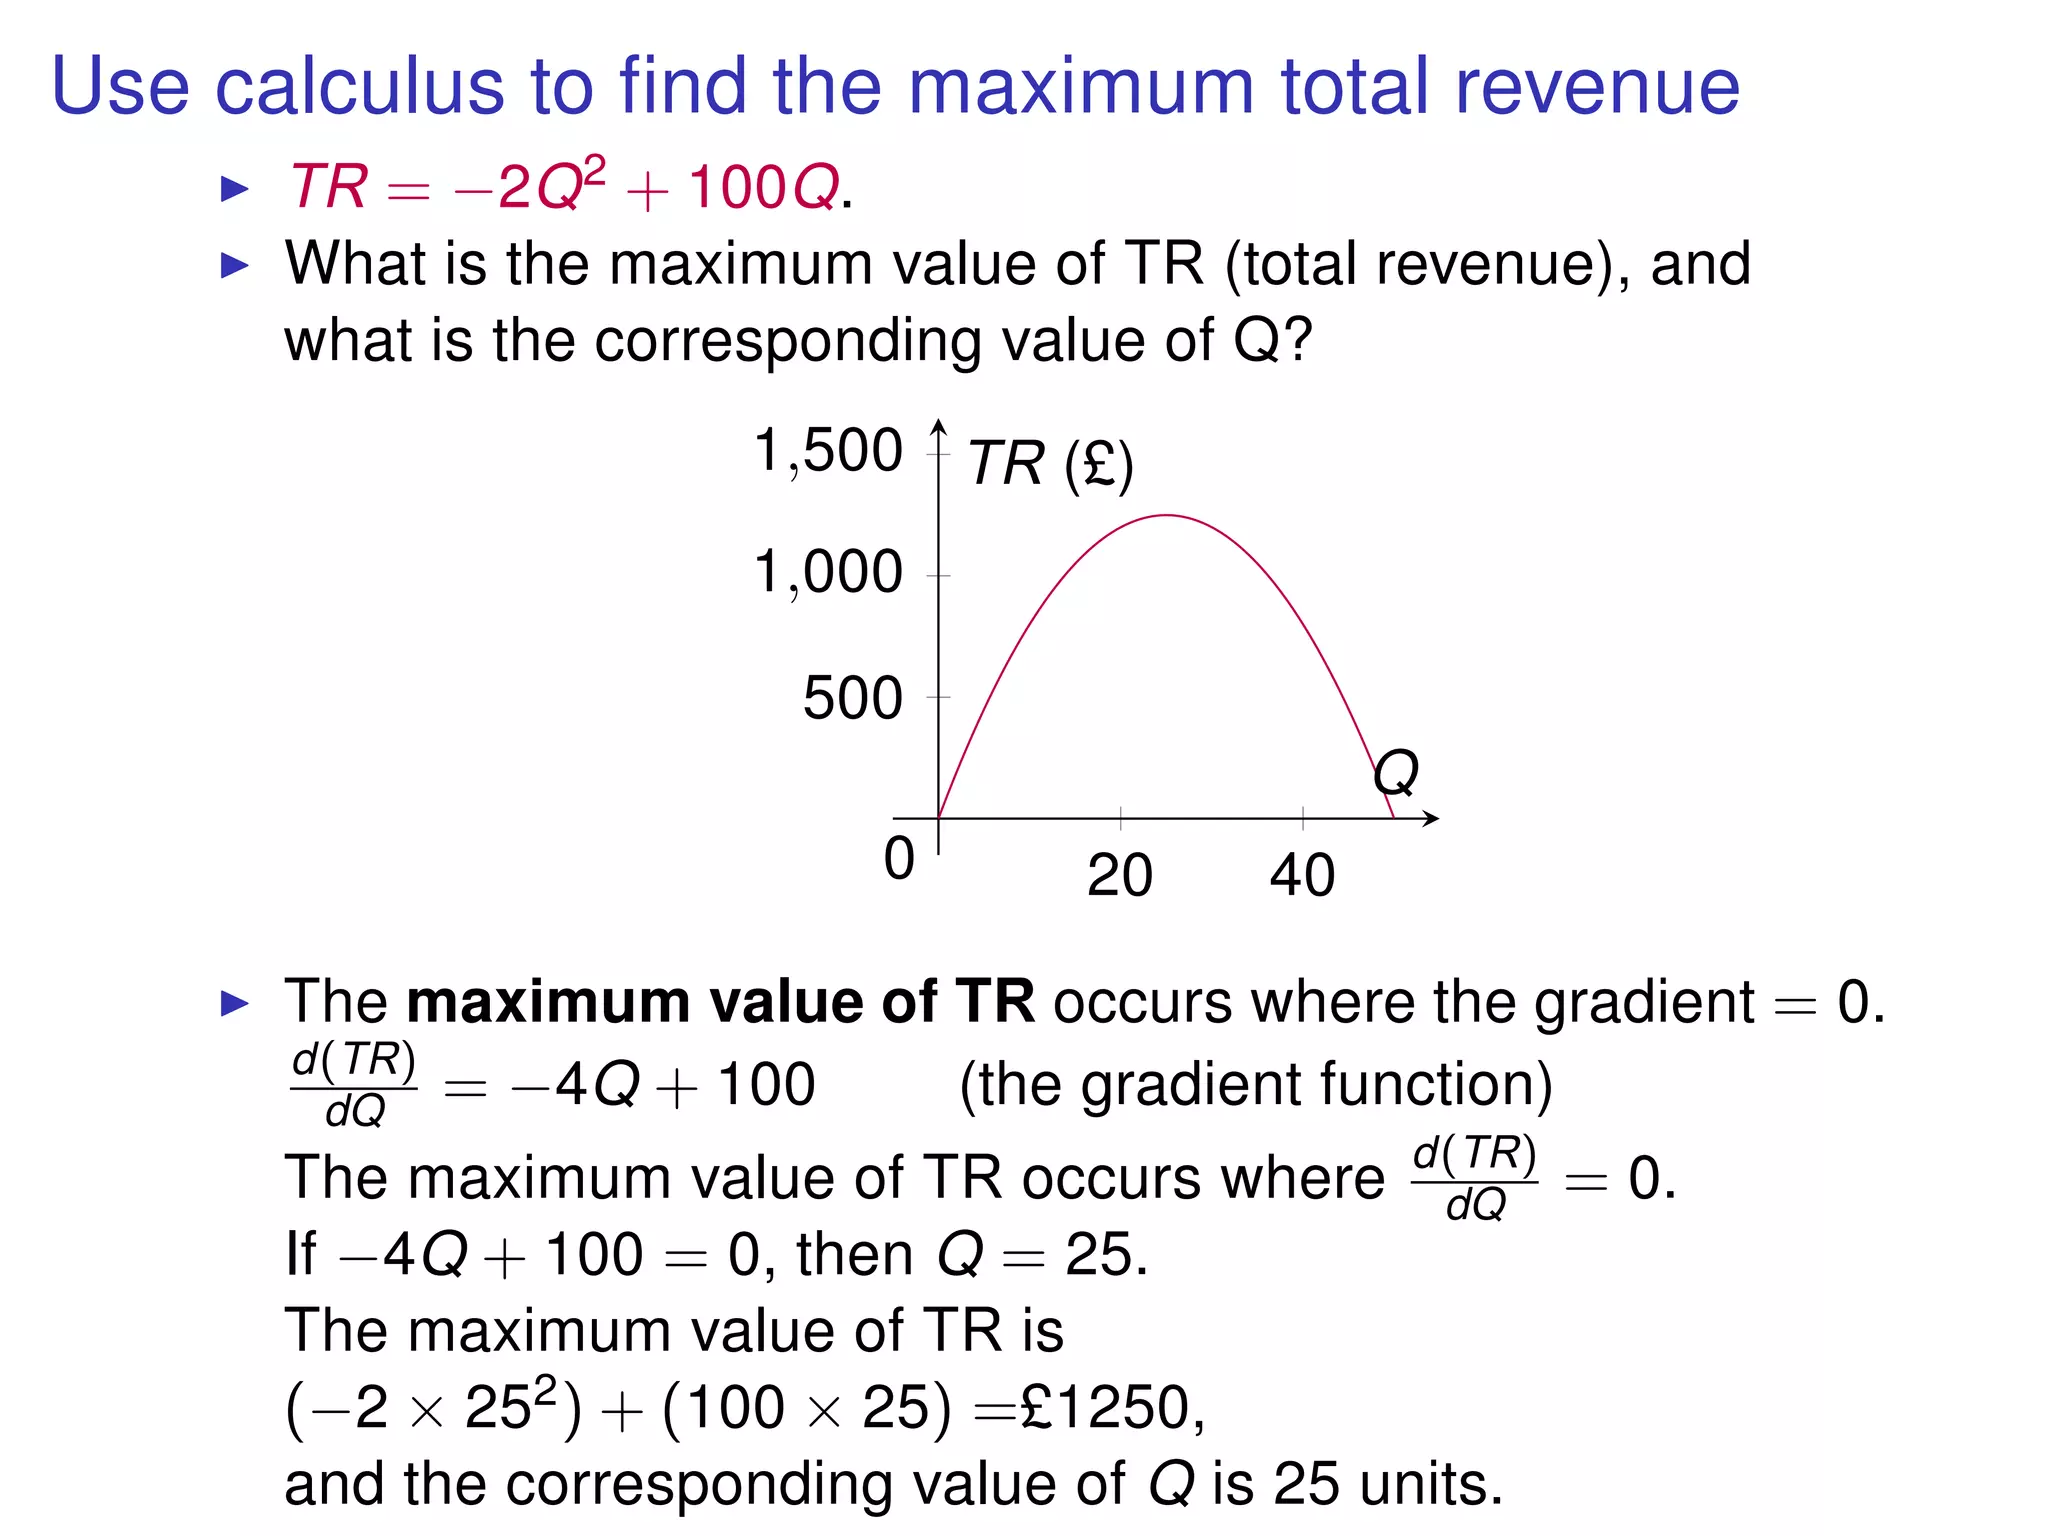
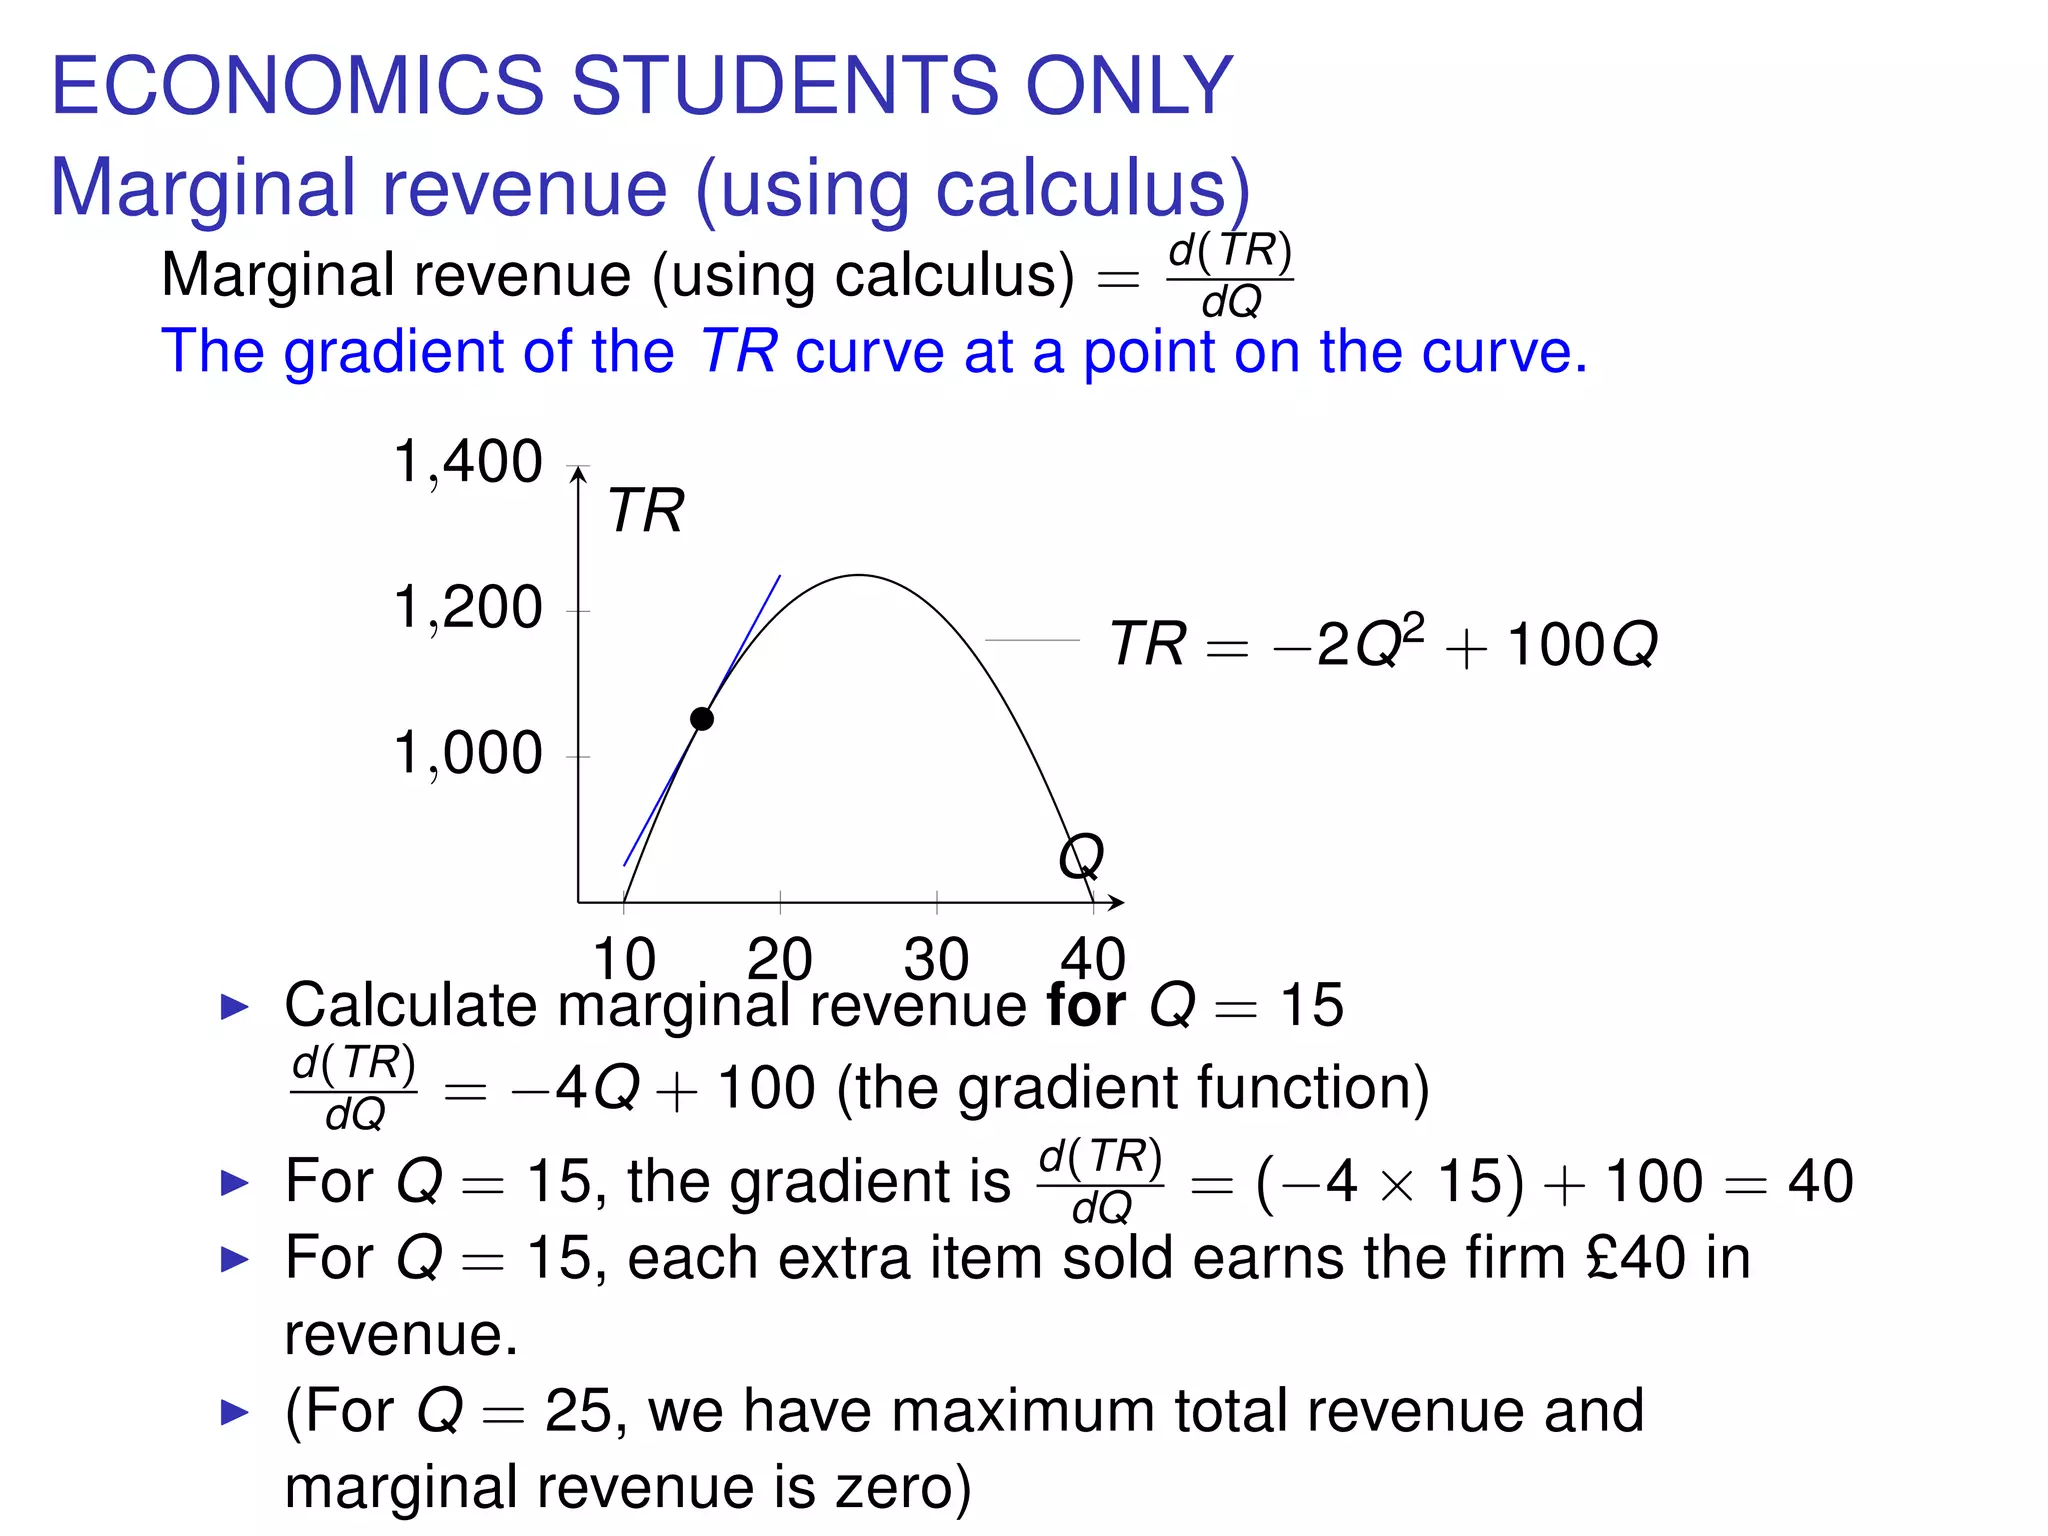
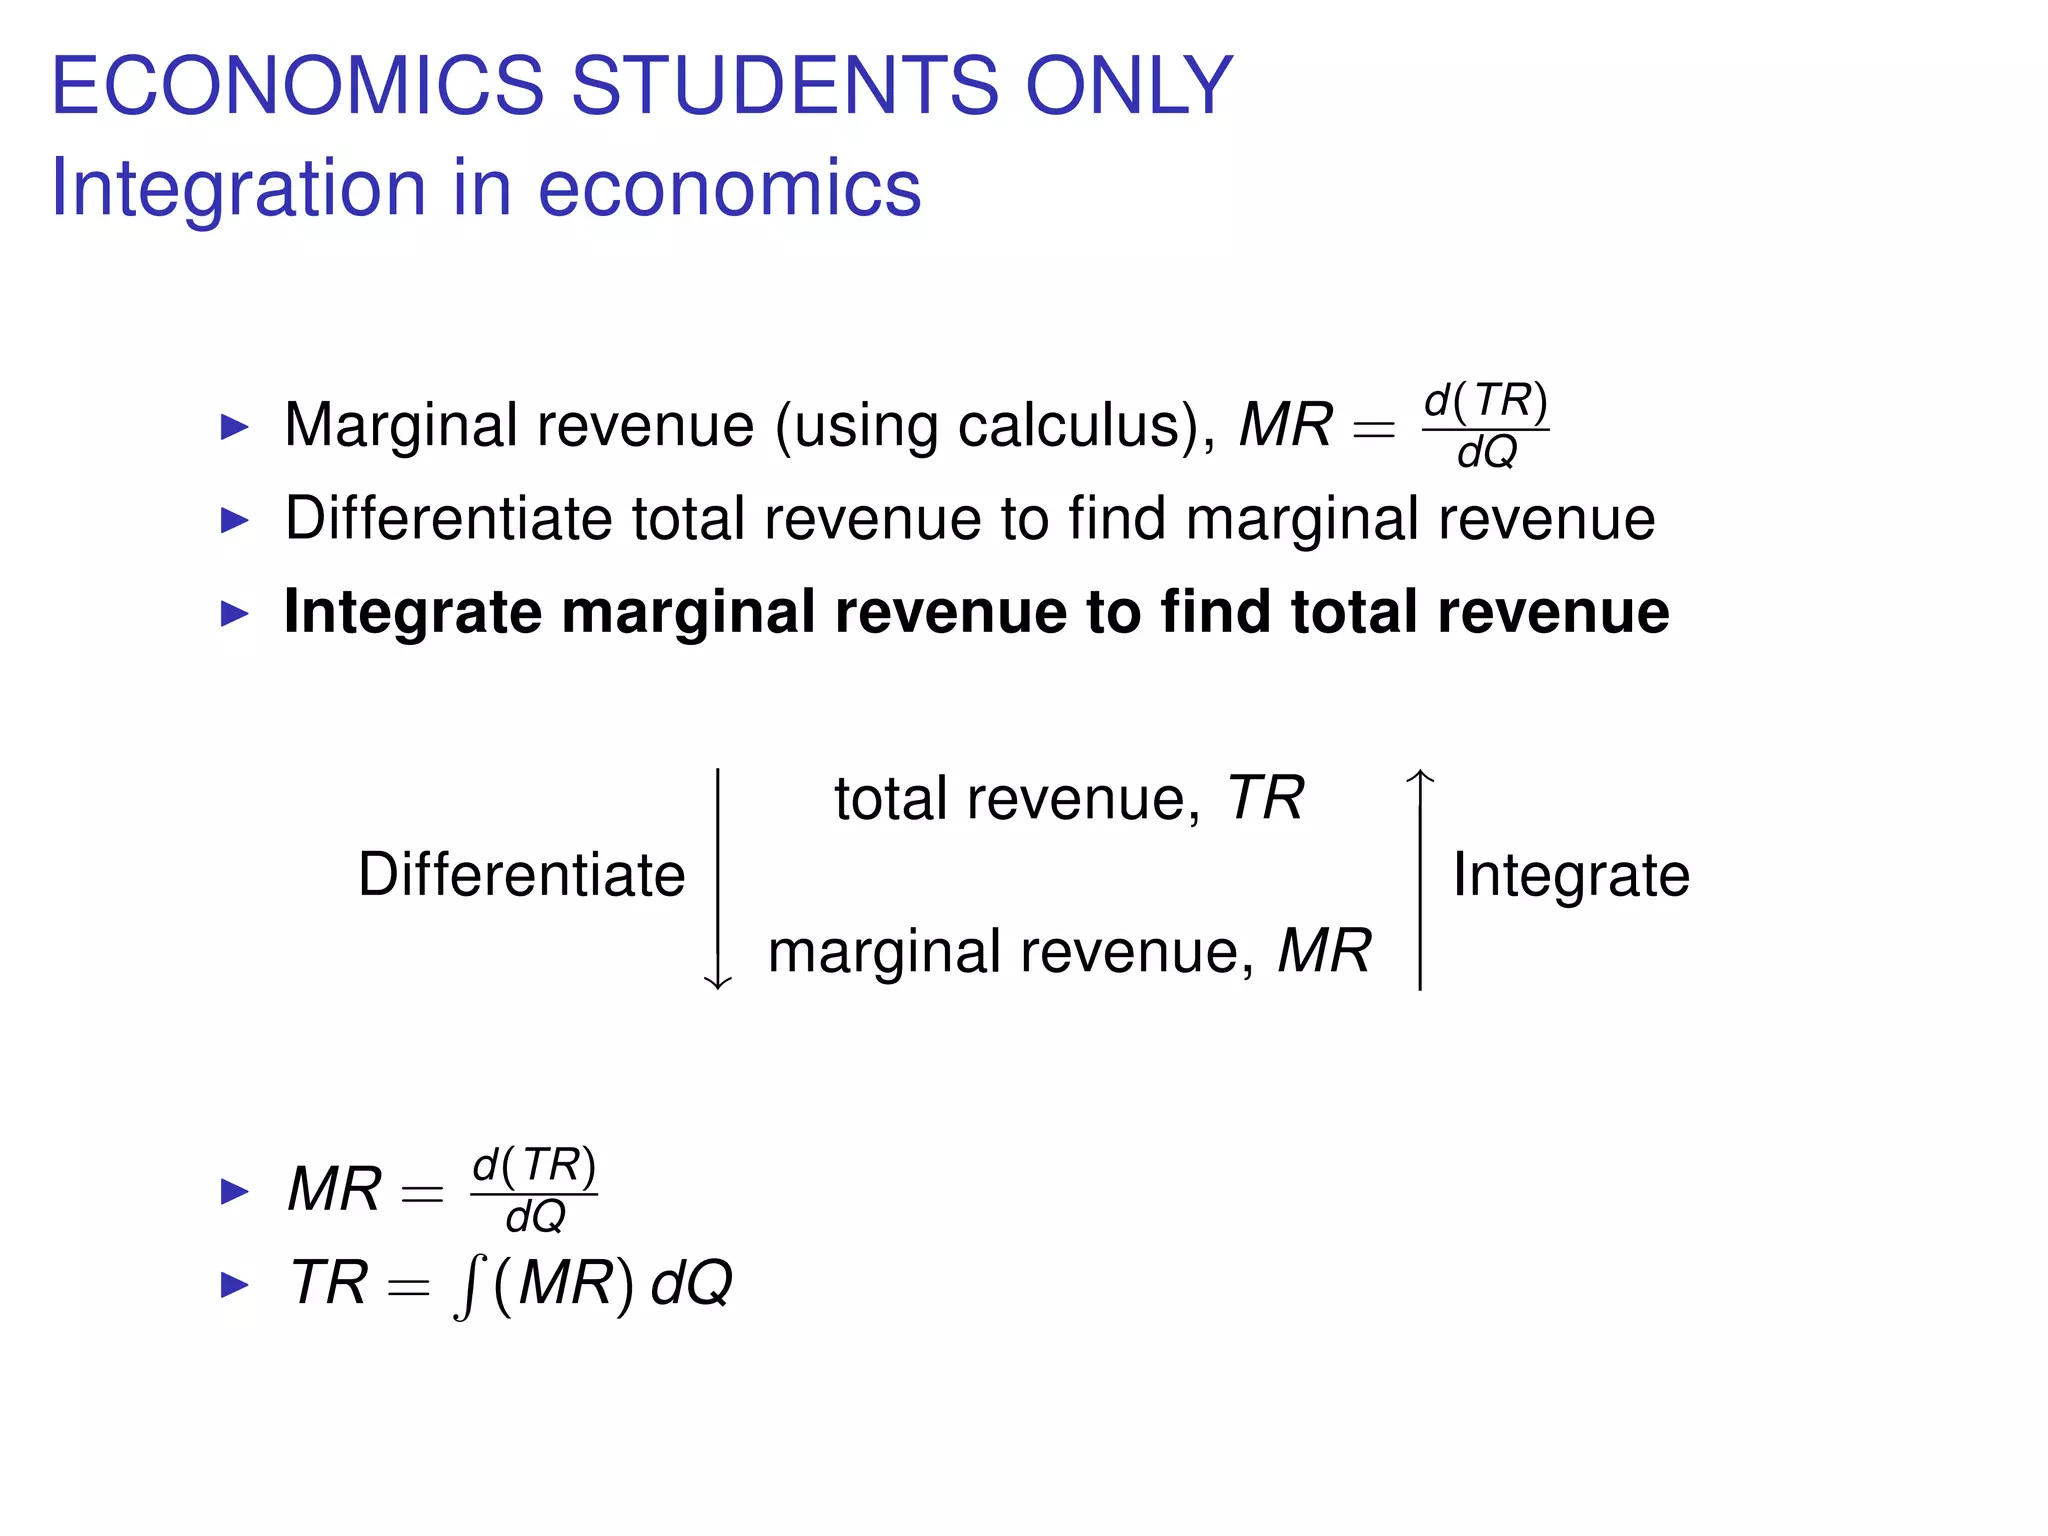
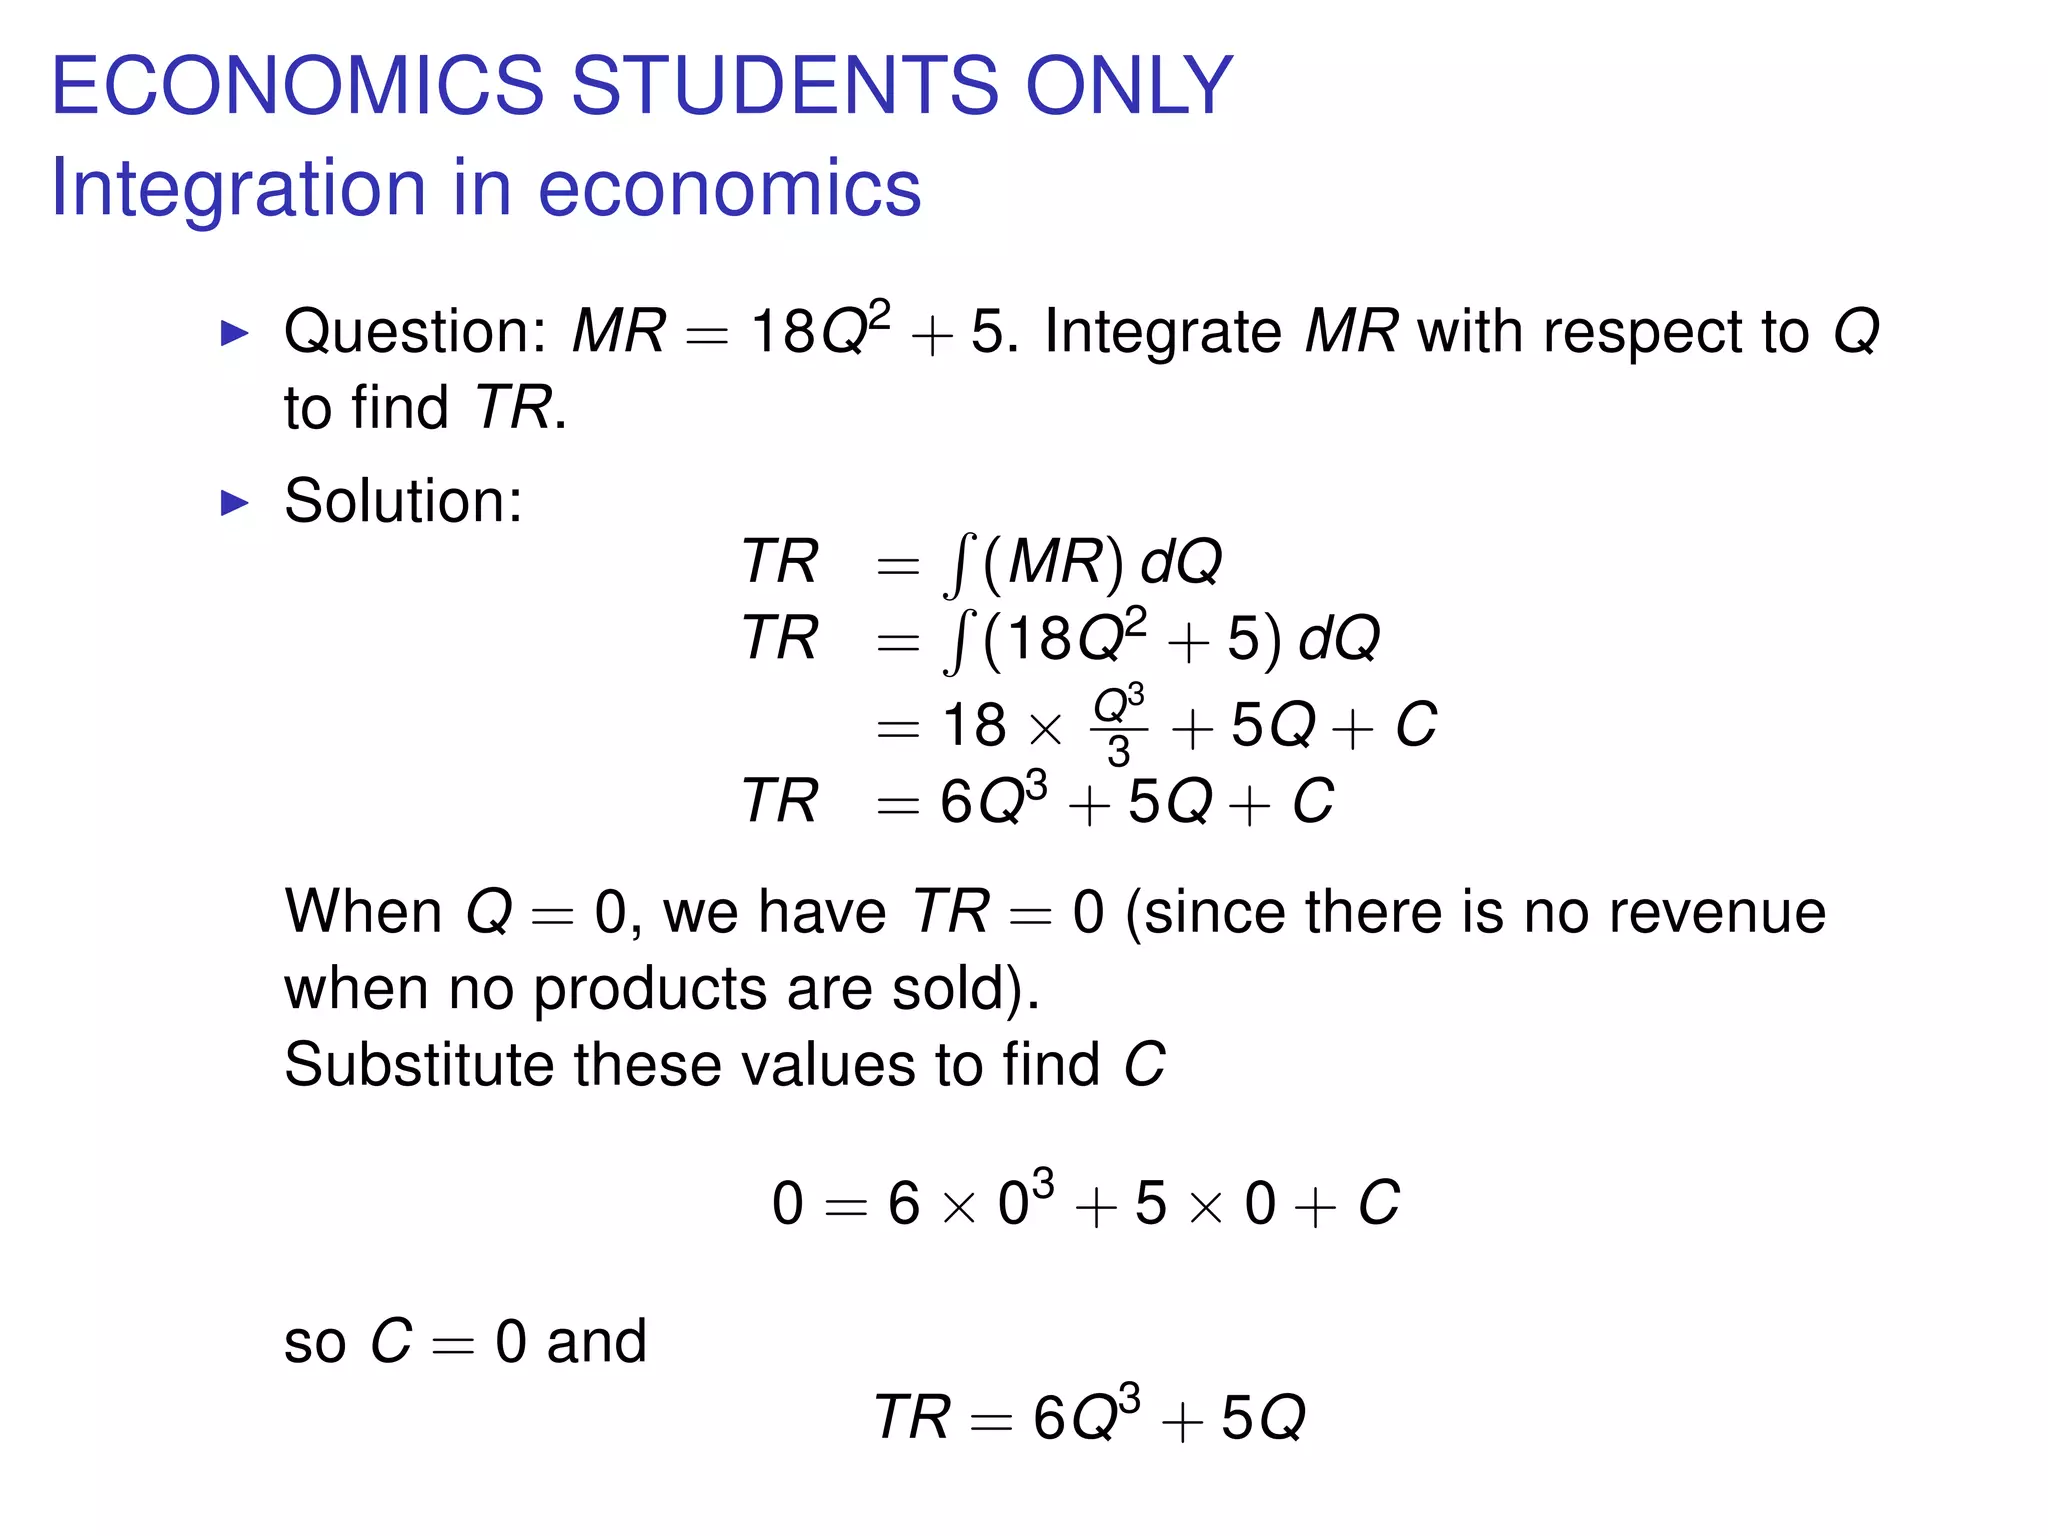
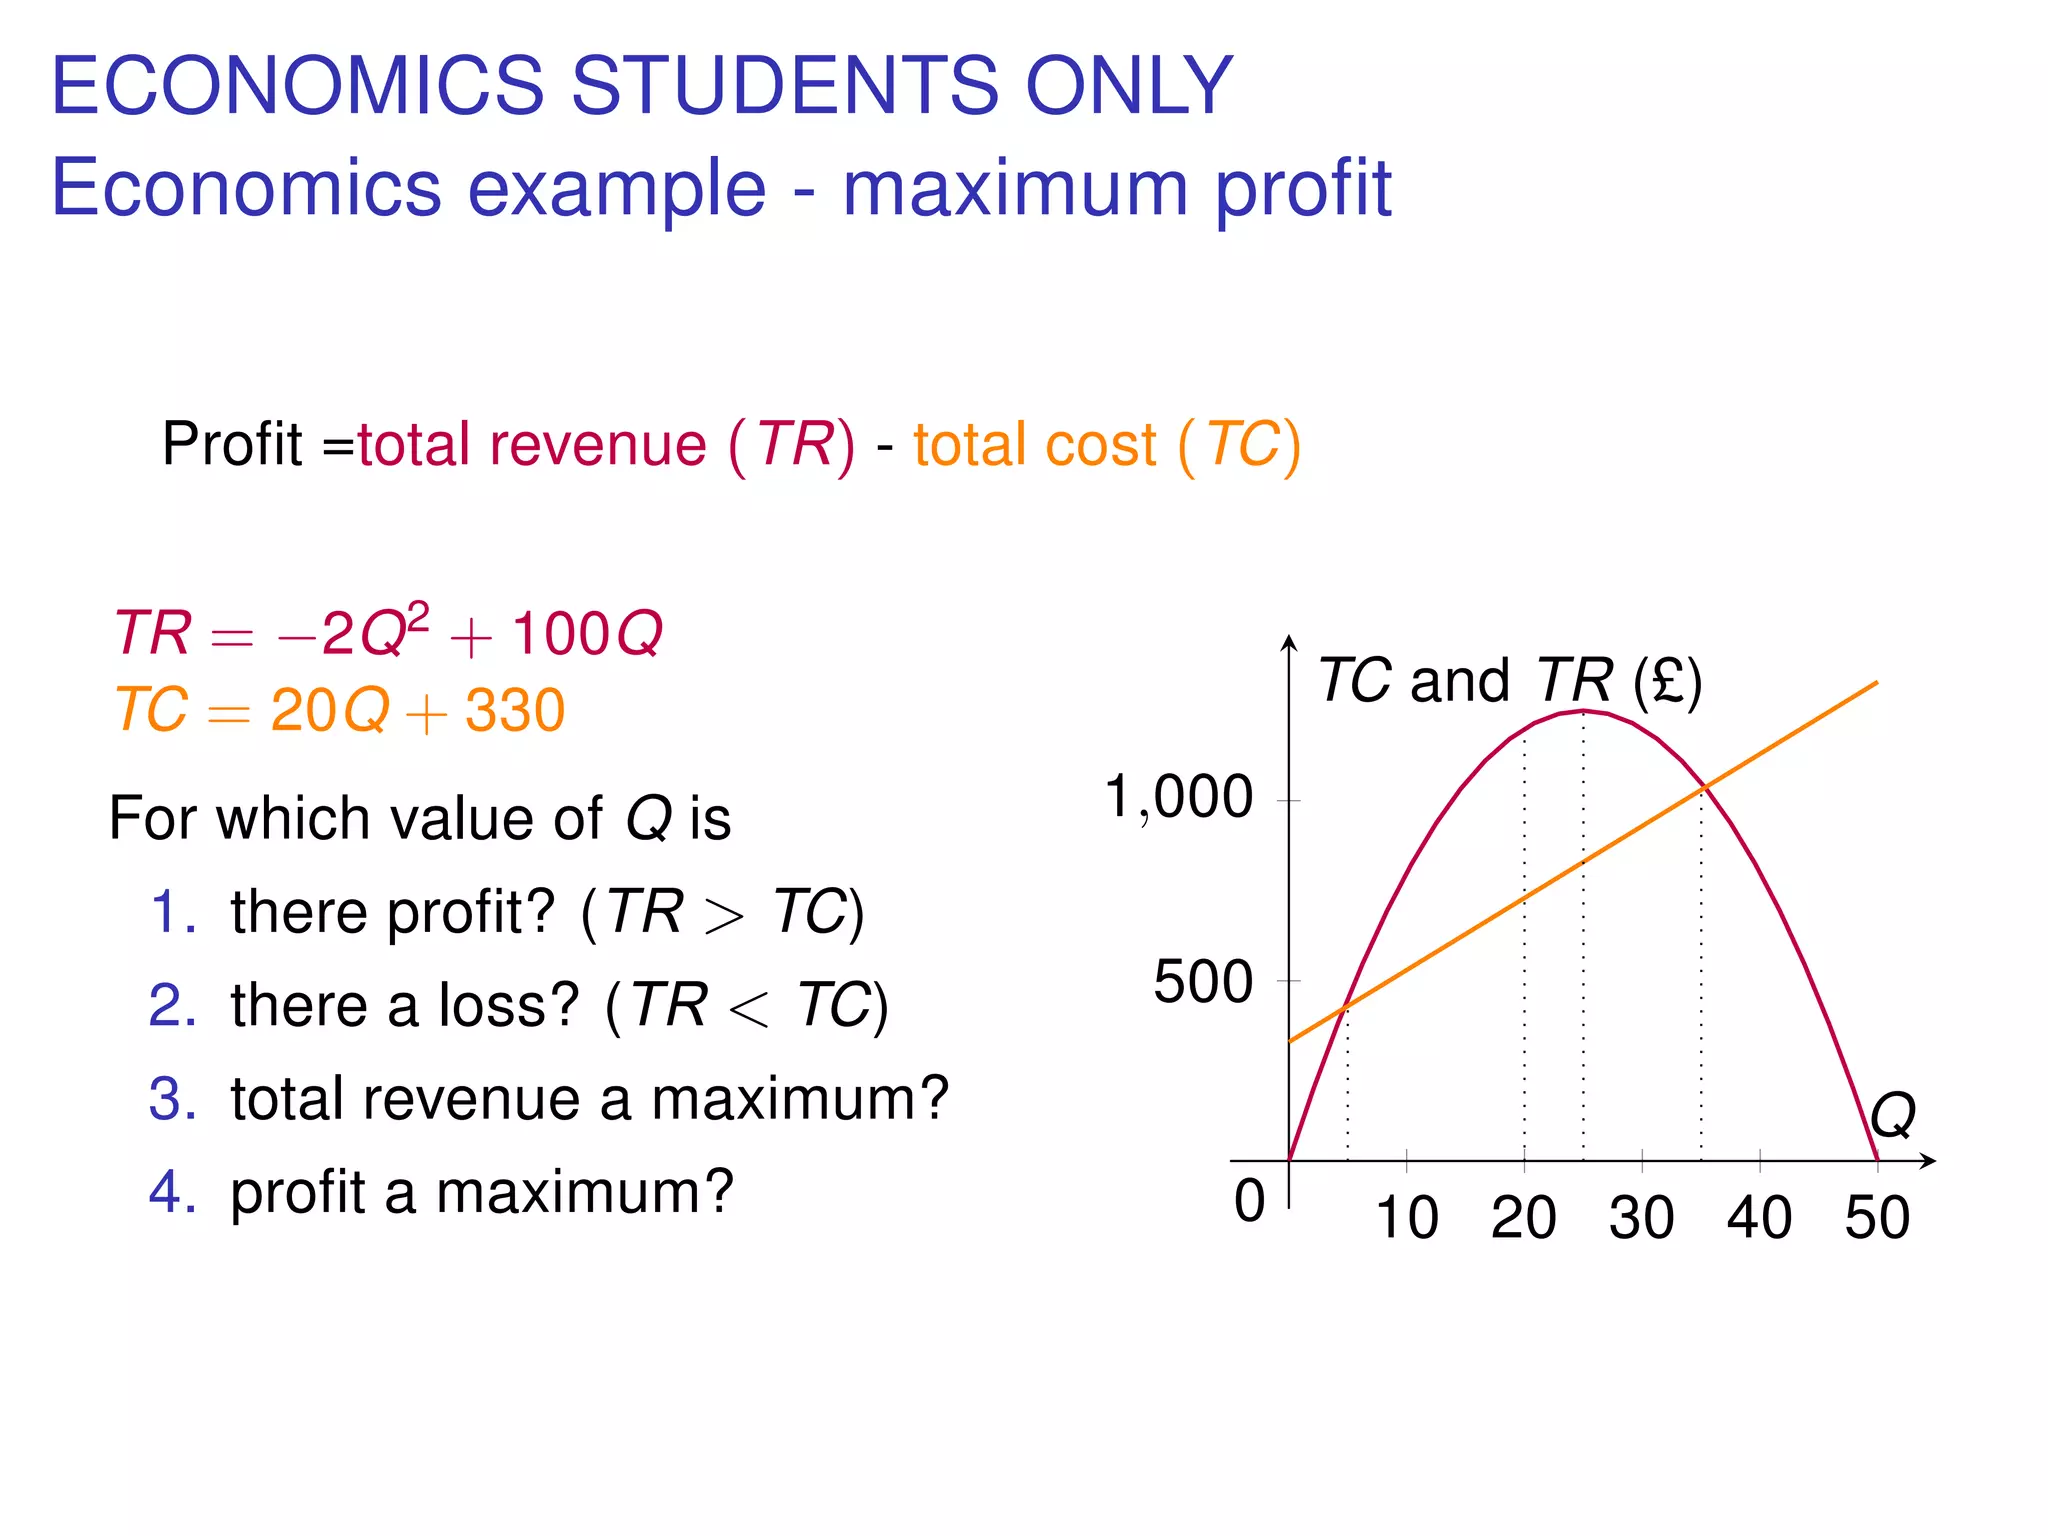
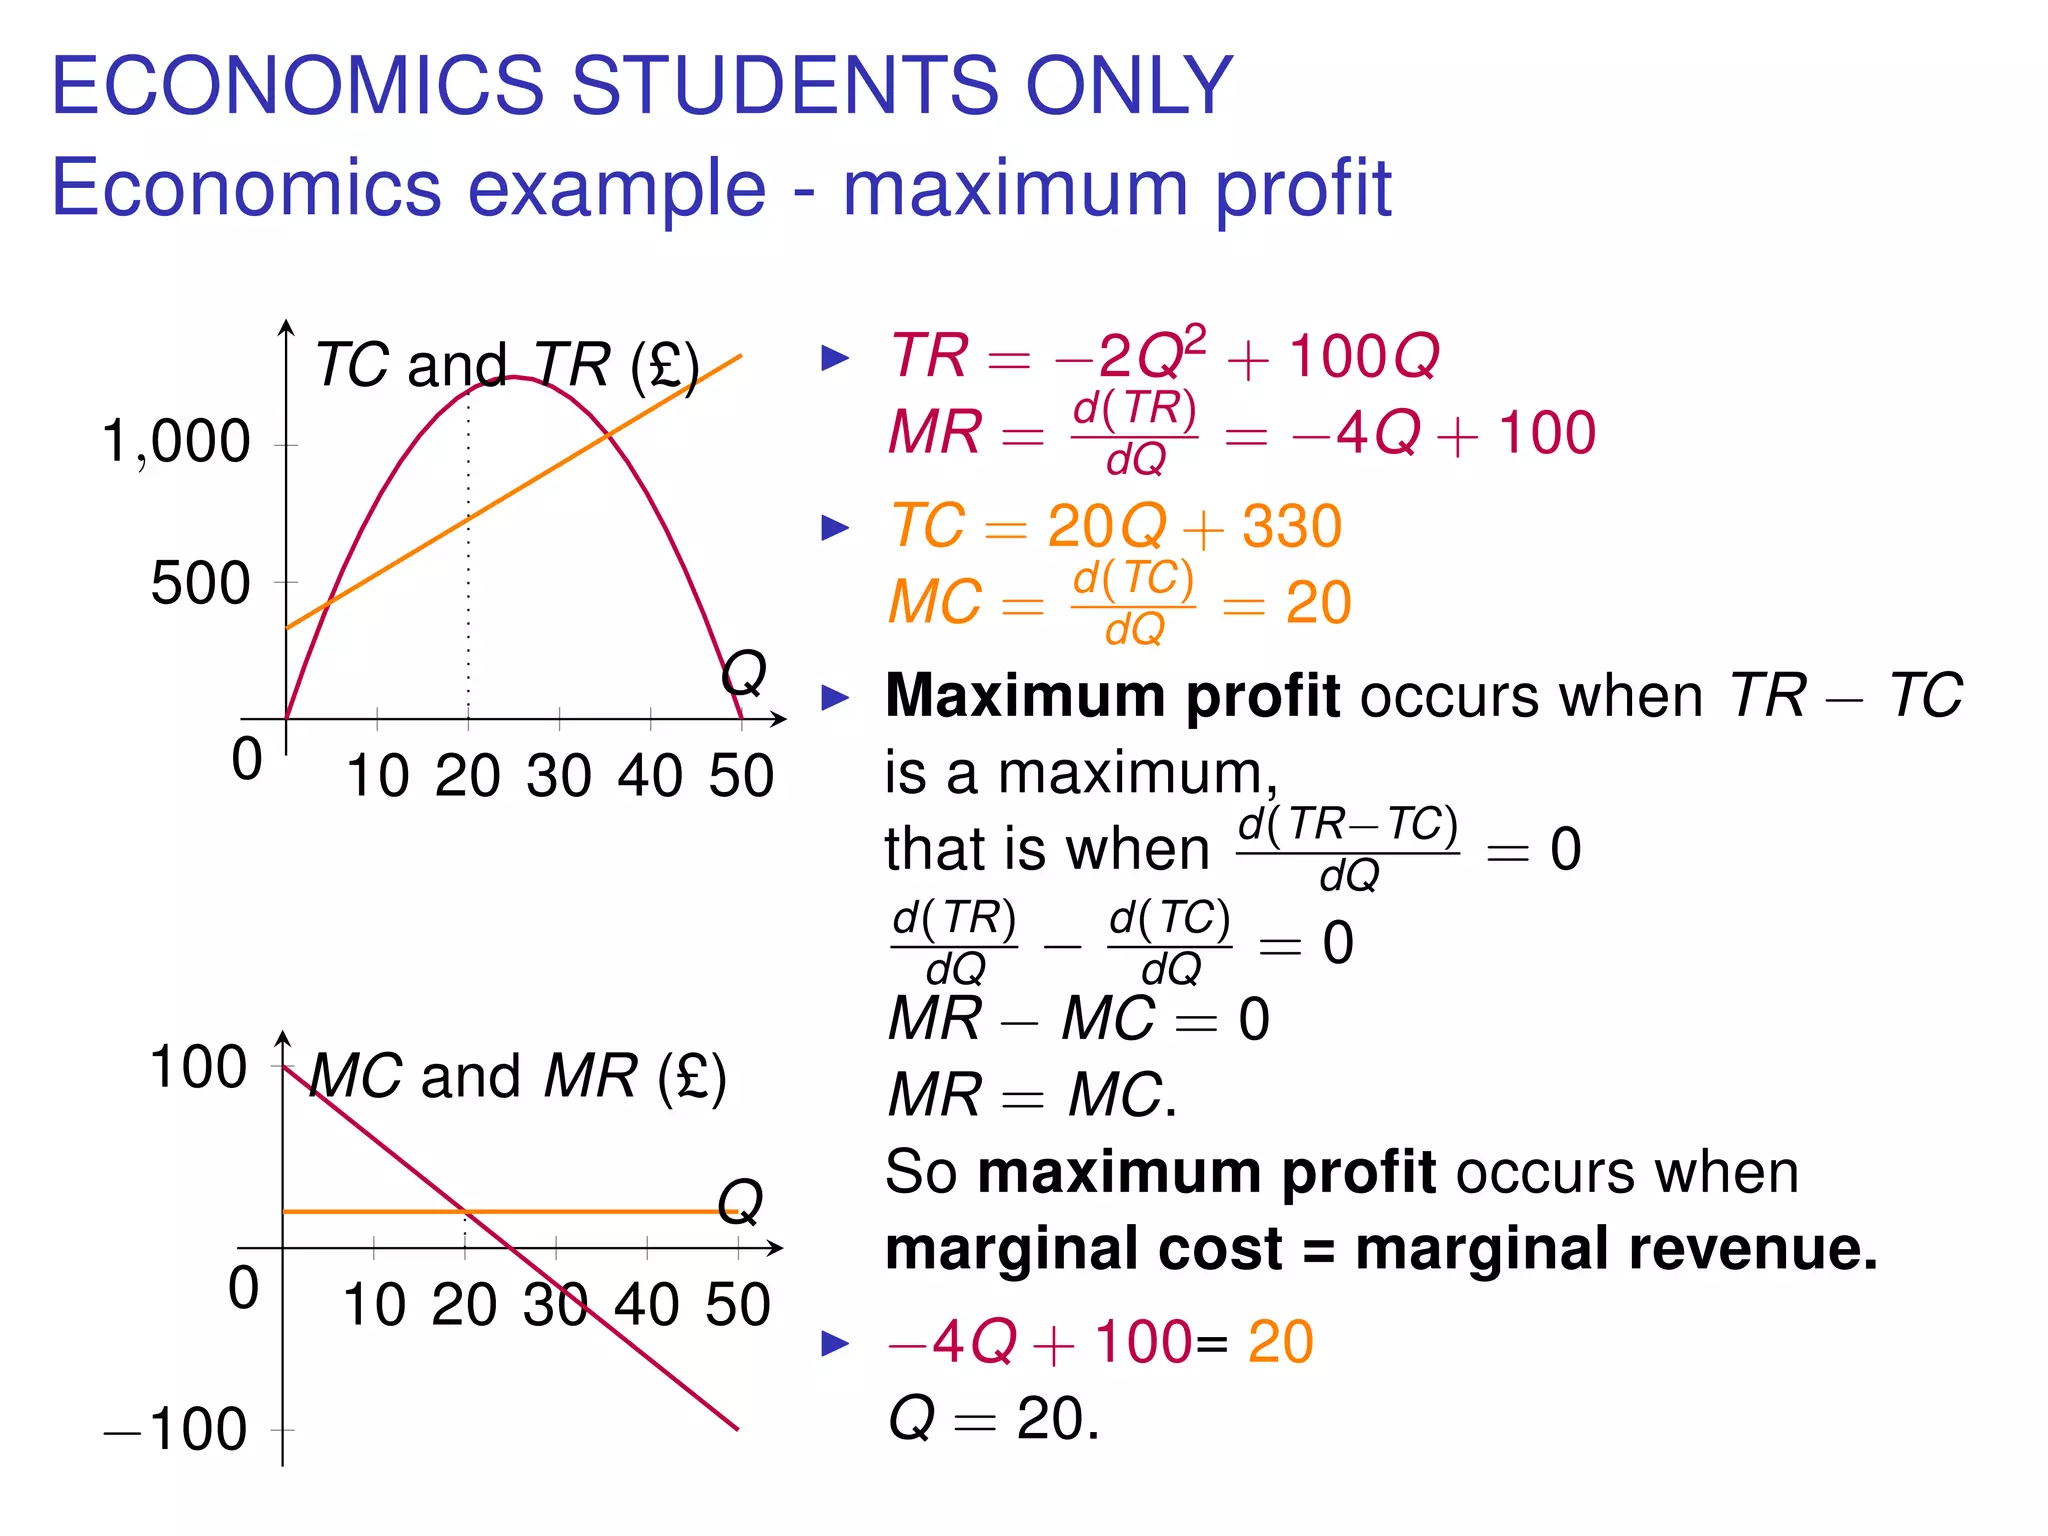
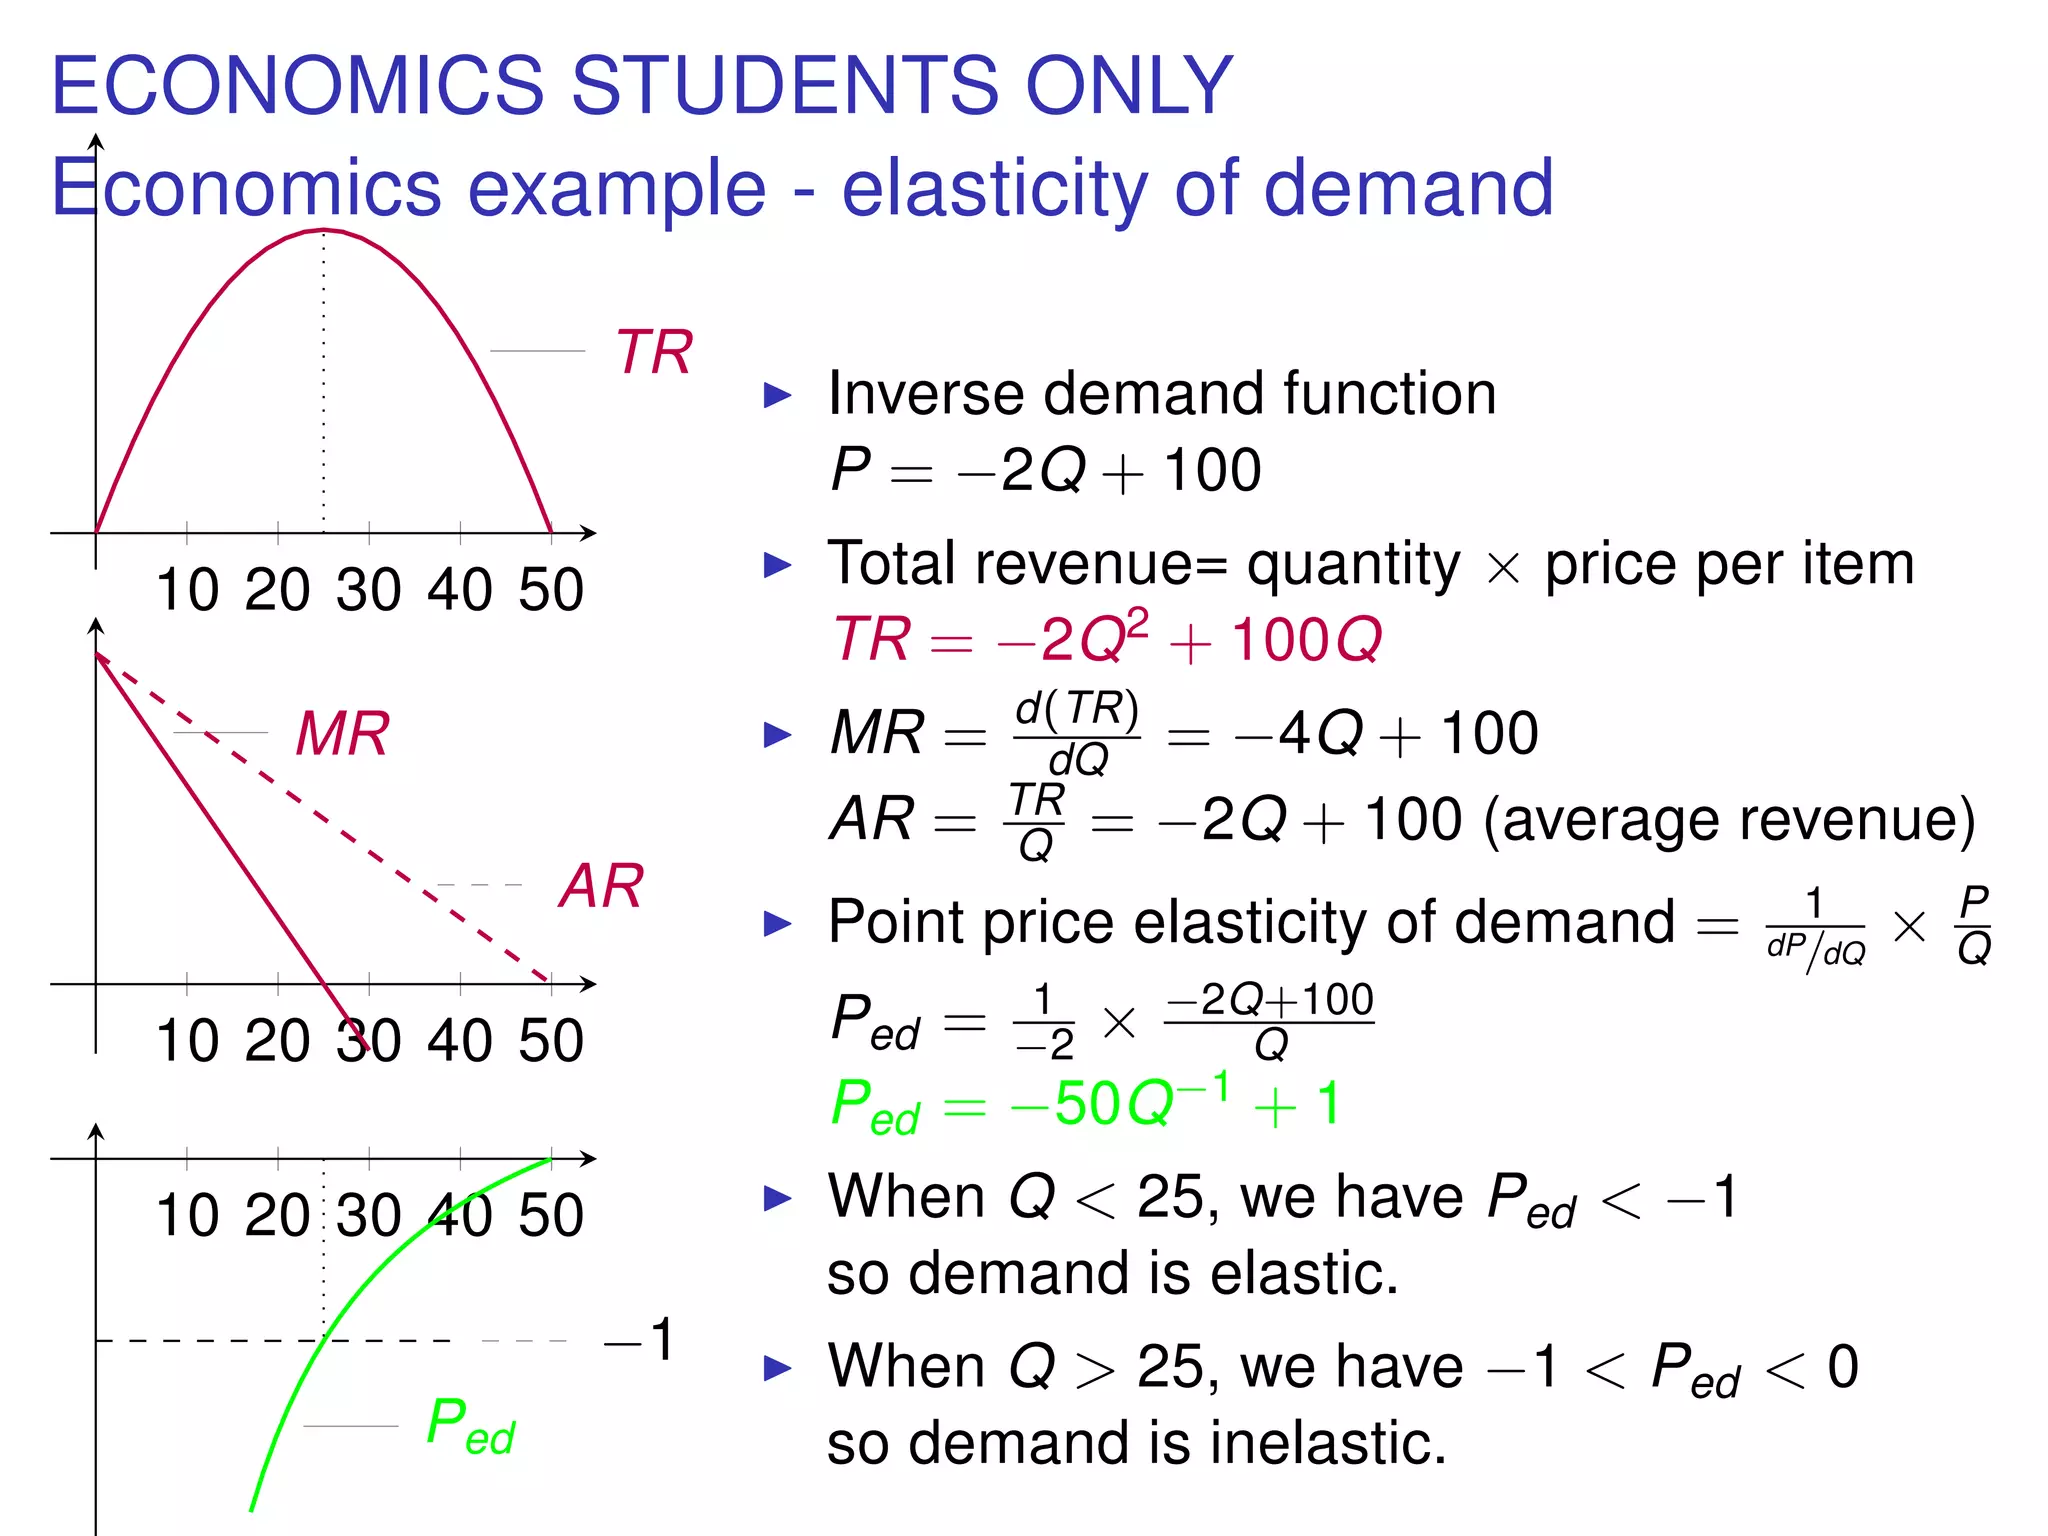
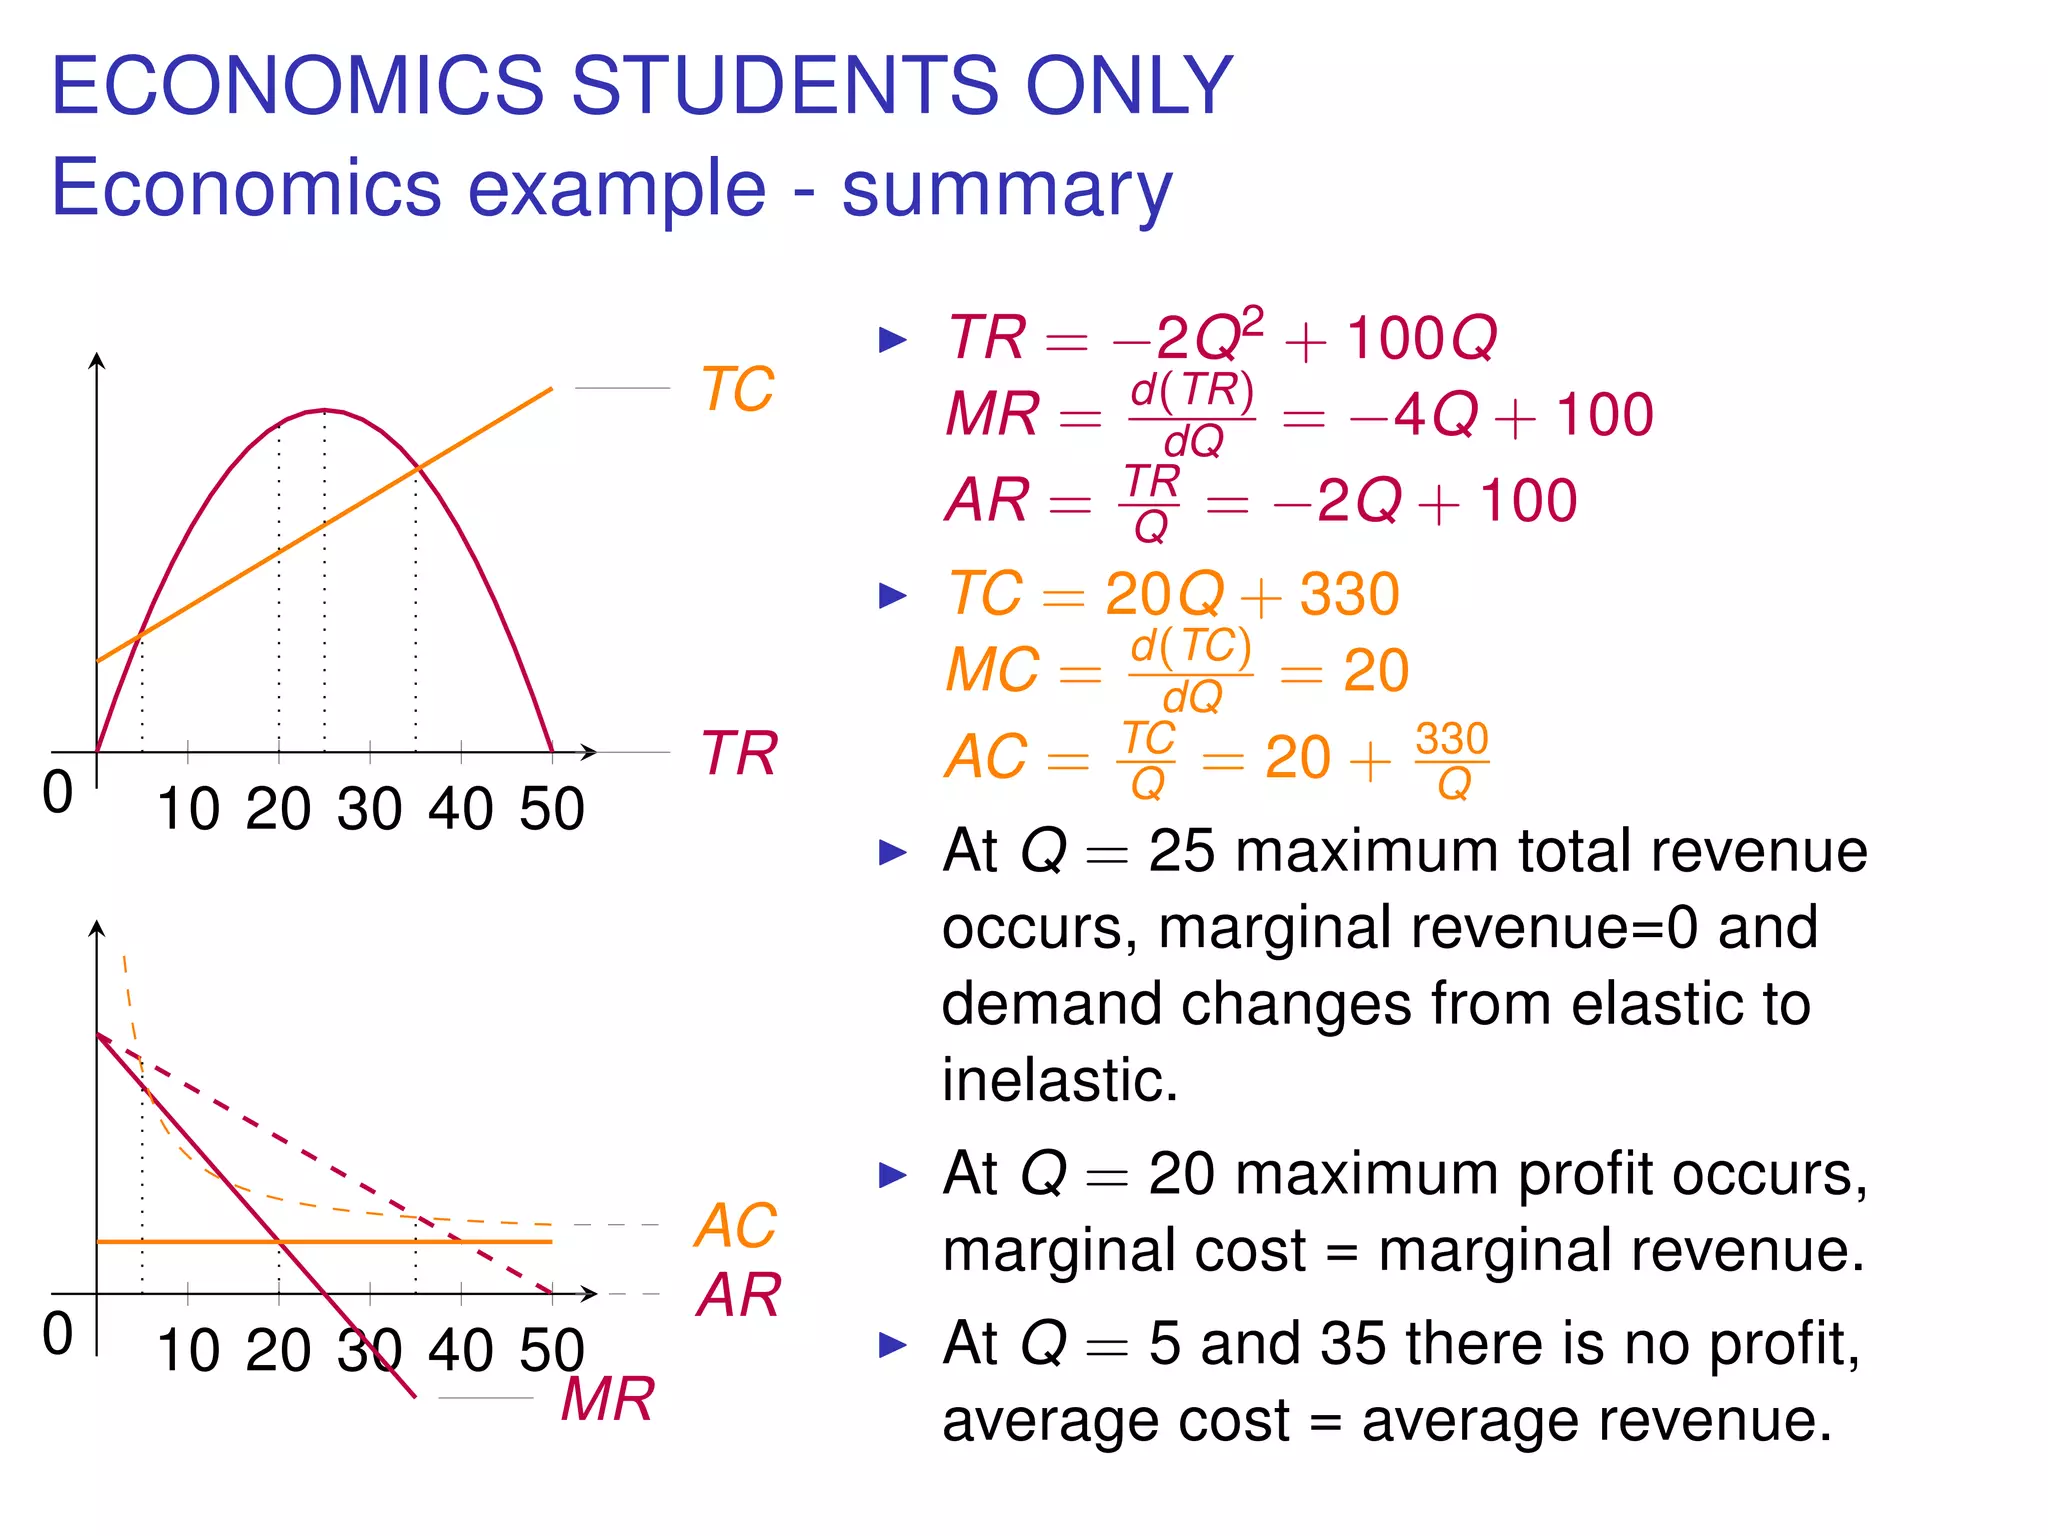
3) The second half discusses using graphs to solve economics problems like finding the equilibrium price and quantity in a market with a demand and supply function. It also shows how a tax changes the supply curve.