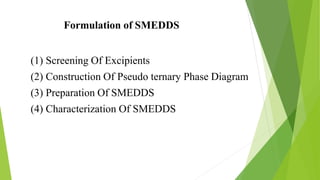
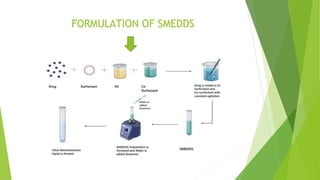
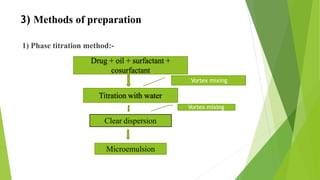
The document summarizes the key steps in formulating a self-microemulsifying drug delivery system (SMEDDS):
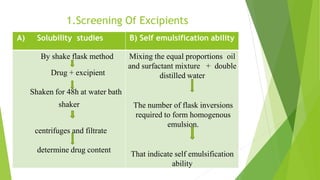
(1) Screening of excipients via solubility and self-emulsification studies.
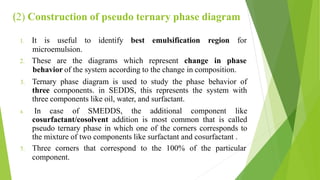
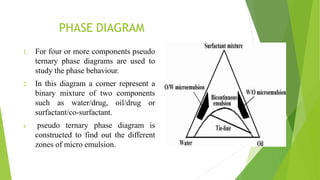
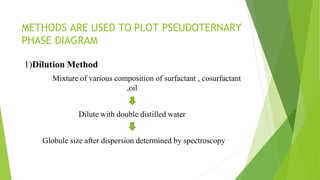
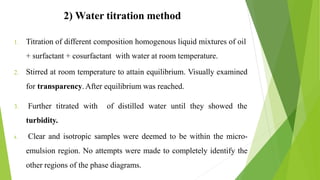
(2) Construction of a pseudo-ternary phase diagram to identify the optimal self-emulsification region using methods like dilution or water titration.
(3) Preparation and characterization of the SMEDDS formulation.