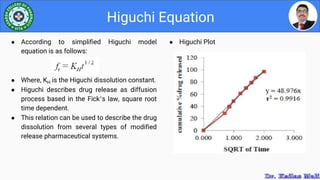
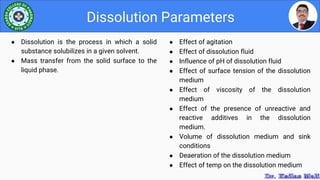
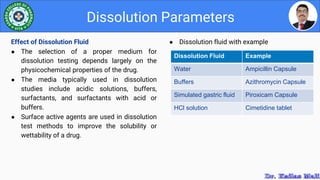
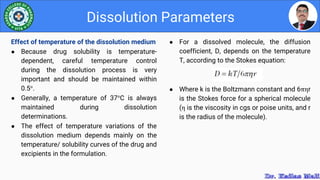
Modern Pharmaceutics
Dr. Kailas Mali
Professor in Pharmaceutics,
Adarsh College of Pharmacy, Vita
Study of Consolidation
Parameters
1. Diffusion parameters
2. Dissolution parameters
3. Pharmacokinetic parameters
4. Heckel plots,
5. Similarity factors – f2 and f1,
6. Higuchi and peppas plot,
7. Concept and significance of Linearity, Standard deviation , chi square test,
student T-test , ANOVA test.
Contents
● Diffusion of drug from dosage form
Diffusion Parameters
Diffusion
● It is a process of the mass transfer of the
individual molecule of a substance brought
about by random molecular motion
associated with a driving force like
concentration gradient (higher to lower
concentration).
● Free diffusion of the substance through
liquids, solids and the membranes are of
special interest in designing of a dosage
form.
● Studying diffusional parameters will help us
to understand permeation and distribution of
drug molecules in living systems.
● Drug release form reservoir and matrix.
Diffusion Parameters
Applications of Diffusion
● The release of drugs from dosage forms is
diffusion controlled (SR and CR Products).
● Molecular weight of polymers can be
estimated form diffusion process.
● Absorption of drugs from various routes can
be understood and predicted form the
principles of diffusion.
● The diffusion of drugs into to tissues and
their excretion through kidneys can be
anticipated through diffusion studies.
● Principles of diffusion can be used as in vitro
models for drug protein binding studies.
● The change in mass transfer also occurs
simultaneously with respect to distance.
● Fick’s first law states that the flux (the rate
of mass transfer across a unit surface area
of barrier) is directly proportional to the
concentration gradient.
● Where, dC is change in concentration of
material, g/cm3; D is diffusion coefficient of
a penetrant, cm2/sec; dx is change in
distance, cm.
● D is affected by the concentration,
temperature, pressure, solvent property and
chemical nature of diffusant
Diffusion Parameters
Fick’s First Law
● In diffusion, molecules get transported from
one compartment to another over a period of
time- ie, rate of mass transfer (dm/dt). This is
expressed as flux. Flux (J) is eual to the rate
of mass transfer across a unit surface area of
a barrier.
● Where,
dM is change in the mass of material, g
S is barrier surface area, cm2
dt is change in time, sec.
dt
dM
S
J 

1 dx
dC
D
J 

● If diffusion is the rate determining step, then
we can use Ficks first law of diffusion to
describe the overall process
Diffusion Parameters
● The negative sign in the right side term in
equation signifies a decrease in the
concentration. But flux is always a positive
quantity, because it increases continuously
during process. The dx is perpendicular to the
surface of the barrier.
● Combining above two equations:
● Equation represents the rate of mass transfer
as per Ficks first law.
dx
dC
DS
dt
dM


● Later on, Nernst and Burner showed that k is
a composite constant being proportional to
the diffusion coefficient, D and the surface
area of the dissolving body, A. Thus the
modified equation is called as the Nernst
and Burner equation:
● Where, h is the thickness of the boundary
layer, A is the surface area of dissolving
solid, Kw/o is the partition coefficient of
drug and V is the volume of the dissolution
medium.
Diffusion Parameters
Diffusion limited model or Film theory
● The first dissolution experiment were
conducted by the Noyes and Whitney and
found that the dissolution rate (dc/dt), is a
linear function of the difference between the
bulk concentration at time t and the
saturation solubility:
● Where, k is the dissolution rate constant.
)
( b
s C
C
k
dt
dc


)
(
/
b
s
O
W
C
C
Vh
DAK
dt
dc


● Plot of concentration versus distance from
solid surface
Diffusion Parameters
Variables in Diffusion Process
● Surface area (A): Surface area per gram of a
solid drug can be changed by altering particle
size.
● Diffusion layer thickness (h): In vitro it is
determined by the agitation in the bulk
solution. In vivo no control over this
parameter. Thickness of stagnant layer can
be reduced when drug dissolves in reactive
medium. Weakly basic drug in an acidic
medium dissolves at faster rate than neutral
medium because of reduction in thickness of
stagnant layer.
● Partition coefficient (Kw/o): High water to
oil partition increases drug dissolution.
● Concentration in bulk solution (Cb): In vivo
Cb is low due to sink conditions which
increases rate of dissolution. In vitro
addition of solvents and increase in volume
of dissolution medium increases the rate of
dissolution.
Diffusion Parameters
Variables in Diffusion Process
● Diffusion coefficient (D): It depend on the
size of molecule and the viscosity of the
medium. Increasing the viscosity of medium
will decrease the diffusion coefficient and
thus dissolution rate.
● Drug solubility (Cs): It is another determinant
of dissolution rate. As Cs increases
dissolution rate also increases.
● To study the dissolution from a planar
system having a homogenous matrix, the
relation obtained is:
● Where, Q is the amount of drug released in
time t per unit area, C is the drug initial
concentration, Cs is the drug solubility in
matrix media and D is the diffusivity of the
drug molecules in the matrix substance.
Higuchi Equation
● Higuchi developed theoretical models to
study the release of water soluble and low
soluble drugs incorporated in semi-solid
and/or solid matrix.
● Cumulative % drug release vs. square root of
time.
● Drug release through diffusion mechanism
(Fickian diffusion mechanism)
● Mathematical expressions were obtained for
drug particles dispersed in a uniform matrix
behaving as the diffusion media.
● For the case in which the drug is dissolved
from a saturated solution (where Co is the
solution concentration) dispersed in a
porous matrix.
● Where, Q is the amount of drug released in
time t by surface unity, ε is the matrix
porosity, C0 is the solution concentration
dispersed in a porous matrix and D the
diffusion constant of the drug molecules in
that liquid.
Higuchi Equation
● Planar or spherical systems having a granular
(heterogeneous) matrix, where the drug
concentration in the matrix is lower than its
solubility and the release occurs through
pores in the matrix obtained relation is:
● Where, Q is the amount of DR in time t by
surface unity, C is the initial concentration of
the drug, ε is the matrix porosity, τ is the
tortuosity factor of the capillary system, CS
is the drug solubility in the matrix /excipient
media and D the diffusion constant of the
drug molecules in that liquid.
● Higuchi Plot
Higuchi Equation
● According to simplified Higuchi model
equation is as follows:
● Where, KH is the Higuchi dissolution constant.
● Higuchi describes drug release as diffusion
process based in the Fick’s law, square root
time dependent.
● This relation can be used to describe the drug
dissolution from several types of modified
release pharmaceutical systems.
● Effect of agitation
● Effect of dissolution fluid
● Influence of pH of dissolution fluid
● Effect of surface tension of the dissolution
medium
● Effect of viscosity of the dissolution
medium
● Effect of the presence of unreactive and
reactive additives in the dissolution
medium.
● Volume of dissolution medium and sink
conditions
● Deaeration of the dissolution medium
● Effect of temp on the dissolution medium
Dissolution Parameters
● Dissolution is the process in which a solid
substance solubilizes in a given solvent.
● Mass transfer from the solid surface to the
liquid phase.
● Dissolution tests using high-speed agitation
may lack discriminative value and can yield
misleading results.
● The lowest value (25 rpm) is characteristic
for suspensions.
● In compendial methods agitation speed is
relatively low.
● For the basket method 100rpm and for
paddle 50-75 rpm.
Dissolution Parameters
Effect of agitation
● The relationship between the intensity of
agitation and the rate of dissolution differs
considerably according to the type of
agitation used, degree of laminar and
turbulent flow in the system, the shape and
design of the stirrer, and the physicochemical
properties of the solid.
● Speed of agitation generates a flow that
continuously changes the liquid/solid
interface between solvent and drug.
● To sustain a reproducible laminar flow, which
is essential for gaining reliable results,
agitation should be maintained at a relatively
low rate.
● Dissolution fluid with example
Dissolution Parameters
Effect of Dissolution Fluid
● The selection of a proper medium for
dissolution testing depends largely on the
physicochemical properties of the drug.
● The media typically used in dissolution
studies include acidic solutions, buffers,
surfactants, and surfactants with acid or
buffers.
● Surface active agents are used in dissolution
test methods to improve the solubility or
wettability of a drug.
Dissolution Fluid Example
Water Ampicillin Capsule
Buffers Azithromycin Capsule
Simulated gastric fluid Piroxicam Capsule
HCl solution Cimetidine tablet
● For tablets containing active ingredients,
whose solubility is independent of pH, the
dissolution rate does not vary considerably
with changes in pH of the dissolution
medium unless they contain certain
excipients that are influenced by pH.
● Sodium bicarbonate, magnesium carbonate,
calcium carbonate promotes disintegration
of tablet in acidic medium by producing gas.
Dissolution Parameters
Influence of pH of dissolution fluid
● Variations in pH exert the greatest effect in
terms of drug solubility.
● For weak acids, the rate of dissolution
increases with increasing pH, whereas, for
weak bases, the rate of dissolution increases
with decreasing pH.
● pH of stomach is ~2. Acetylsalicylic acid pKa
is 3.5.
● The addition of surfactant below the CMC
can increase significantly the dissolution
rate because of better penetration of the
solvent into the tablet resulting in greater
availability of the drug surface.
● Dissolution data for benzocaine in different
concentrations of polysorbate 80.
Dissolution Parameters
Effect of surface tension of the dissolution fluid
● Surface tension shows a significant effect on
the dissolution rate of drugs and their release
rate from solid dosage forms.
● Surfactants and wetting agents lower the
contact angle and, consequently, improve
penetration by the dissolution medium.
● The incorporation of surface-active agents in
the dissolution medium is expected to
enhance the dissolution rate of a poorly
soluble drug in solid dosage forms by
decreasing the interfacial tension and micelle
formation.
● Relationship of viscosity to dissolution rate
of benzoic acid in aqueous methylcellulose
solutions at 25°.
Dissolution Parameters
Effect of viscosity of the dissolution fluid
● In case of diffusion-controlled dissolution
processes, it would be expected that the
dissolution rate decreases with an increase in
viscosity.
● In the case of interfacial-controlled
dissolution processes, however, viscosity
should have little effect.
● The Stokes-Einstein equation describes
diffusion coefficient, D, as a function of
viscosity,
D=µkT
● Where, µ is the mobility (velocity at a force of
one dyne); k is the Boltzmann constant.
Volume of dissolution medium and sink
condition
● The suitable volume of the dissolution
medium depends mainly on the solubility of
the drug in the selected fluid.
● If the drug is poorly soluble in water, a
reasonably large amount of fluid should be
used.
● To minimize the effect of the concentration
gradient and maintain sink conditions, the
concentration of the drug should not exceed
10 – 15% of its maximum solubility in the
dissolution medium selected. Volume
generally 500ml, 900 ml and 1000ml used.
Dissolution Parameters
Effect of the presence of unreactive and
reactive additives in the dissolution medium
● When neutral ionic compounds such as
Sodium Chloride and Sodium Sulfate or
nonionic organic compounds such as
Dextrose were added to the dissolution
medium the benzoic acid solubility was
directly dependent on its solubility in a
particular solvent.
● When certain buffers or bases were added to
the aqueous solvent, an increase in the
dissolution rate was observed.
● This inhibits wetting and lowers the
dissolution rate.
● Some drug products are known to be
tremendously sensitive to dissolved gas, the
presence of air bubbles should be expected
to increase the measurement uncertainty in
dissolution testing.
● In USP Apparatus 2, released air bubbles
deposit on the paddle shaft, the release of
air bubbles alters the hydrodynamics of the
system by changing the fluid flow
characteristics in the dissolution vessel.
Dissolution Parameters
Deaeration of the dissolution medium
● The presence of dissolved air or other gases
in the dissolution medium may impact the
dissolution rate of certain formulations and
lead to variable and unreliable results.
● Soluble air in distilled water can significantly
lower its pH and as a result, affect the rate of
dissolution of pH-sensitive drugs.
● Another severe effect is the tendency of the
dissolved air to be released from the medium
in form of a tiny air bubble.
● These bubbles collect at the surface of the
dosage form thereby acting as a hydrophobic
barrier between solvent and solid surface.
● For a dissolved molecule, the diffusion
coefficient, D, depends on the temperature
T, according to the Stokes equation:
● Where k is the Boltzmann constant and 6πηr
is the Stokes force for a spherical molecule
(η is the viscosity in cgs or poise units, and r
is the radius of the molecule).
Dissolution Parameters
Effect of temperature of the dissolution medium
● Because drug solubility is temperature-
dependent, careful temperature control
during the dissolution process is very
important and should be maintained within
0.5°.
● Generally, a temperature of 37°C is always
maintained during dissolution
determinations.
● The effect of temperature variations of the
dissolution medium depends mainly on the
temperature/ solubility curves of the drug and
excipients in the formulation.
● Release profile by diminishing surface of
the drug particles during the dissolution.
● It gives Erosion release mechanism.
● Applies to pharmaceutical dosage forms
such as tablets, where the dissolution
occurs in planes that are parallel to the drug
surface if the tablet dimensions diminish
proportionally in such a manner that the
initial geometrical form keeps constant all
the time.
Hixson and Crowells Cube Root Law
● Particle regular area is proportional to the
cubic root of its volume and equation is
express as follows:
● Where, W0 is the initial amount of drug in the
pharmaceutical dosage form. Wt is the
amount of drug remaining as a solid state at
time t. KS is the constant incorporation the
surface volume relation.
● Cube root of drug % remaining in matrix vs.
time
● Drug release is limited by the dissolution rate
of the particles, and not by diffusion through
the polymer matrix.
● Peak plasma concentration (Cmax)
● Time of peak concentration (tmax)
● Area under the curve (AUC)
Pharmacokinetic Parameters
● Pharmacokinetics is defined as the kinetics
of drug absorption, distribution, metabolism
and excretion and their relationship with
pharmacologic, therapeutic or toxicologic
response in mans and animals.
● Plasma concentration time profile indicating
Cmax
Pharmacokinetic Parameters
Peak plasma concentration (Cmax)
● It is the maximum plasma drug concentration
obtained after oral administration of drug.
● The point of maximum concentration of drug
in plasma is known as the peak and the
concentration of drug at peak is known as
peak plasma concentration.
● Cmax is expressed in µg/ml or mg/L.
● It is related with intensity of action.
● Plasma concentration time profile indicating
tmax
Pharmacokinetic Parameters
Time of Peak Concentration (tmax)
● It is the time required to reach maximum drug
concentration in plasma after extravascular
drug administration.
● It is useful in estimating the rate of
absorption.
● It is expressed in hours.
● Onset time and onset of action depends on
time of peak concentration.
● Parameter is of particular importance in
assessing the efficacy of drugs used to treat
acute conditions like pain and insomnia.
● Plasma concentration time profile indicating
AUC
Pharmacokinetic Parameters
Area Under Curve (AUC)
● The area under the plasma drug
concentration versus time curve.
● AUC is a measurement of the extent of drug
bioavailability.
● The AUC reflects the total amount of active
drug that reaches the systemic circulation.
● AUC is expressed in mcg*hour/ml.
● It is important for the drugs that are
administered repetitively for the treatment of
chronic conditions like asthma or epilepsy.
Disadvantages
● The values of f1 and f2 are sensitive to the
number of dissolution time points used.
● If test and reference formulations are
interchanged, f2 is unchanged but f1 is not,
yet differences between the two mean
profiles remain the same.
● The basis of the criteria for deciding the
difference or similarity between dissolution
profiles is unclear.
Similarity Factor
Model independent analysis (f1 & f2 Factor)
● Most popular methods recommended for use
in a number of FDA guidance documents.
● Difference factor (f1)
● Similarity factor (f2)
Advantages
● Easy to compute.
● Provide a single number to describe the
comparison of dissolution profile data.
Similarity factor (f2)
● Logarithmic transformation of the sum-
squared error of differences between the
test and the reference products over all time
points.
● Where, Rj is the percentage of dissolved
product for a reference batch at time point t,
Tj is the percentage of dissolved product for
the test batch, N is the number of time
points and wj is an optional weight factor, If
each time point is weighted equally then it
means wj=1.
Similarity Factor
Difference factor (f1)
● The difference factor (f1) measures the
percent error between two curves over all
time points
● Where, Rj is the percentage of dissolved
product for a reference batch at time point t,
Tj is the percentage of dissolved product for
the test batch, N is the number of time points.
● Comparison
Similarity Factor
● For rapid dissolving products, that may
dissolve 85% in 15 minutes, comparison of
dissolution profiles is not mandatory
Difference factor Similarity factor
It is proportional to the
average difference
between the two
profiles
It is inversely
proportional to the
average squared
difference between the
two profiles with
emphasis on the
larger difference
among all the time
points
Measures the
closeness between
the two profiles
Measures similarity
F1 F2 Inference
0 100 Dissolution profiles are similar
< 15 >50 Similarity or equivalence of two
profiles
Applications
● New ANDA submission
● Filing variation to the original submission
CBE filings
● Formula changes
● To waive the requirement of bioequivalence
for smaller strengths of formulation
● Site transfer
● Scale up of the lots
● Regulatory submission
Similarity Factor
Data Structure and steps to follow
● This model independent method is most
suitable for the dissolution profile
comparisons when three to four or more
dissolution time points are available.
● Determine the dissolution profile of two
products (12 units each) of test (post-
change) and reference (pre-change) products
● Using mean dissolution values from both
curves at each time interval, calculate the
difference factor and similarity factor.
● For curves to be considered similar, if f1
values close to 0 and f2 values close to 100.
● This model is used to analyze the release of
dosage forms when release mechanism is
not well known or when more than one type
of release phenomena could be involved.
Korsmeyer–Peppas Plot
● It a simple, semiempirical model, relating
exponentially the drug release to the elapsed
time (t):
● According to this model, drug dissolution is
function of the exponent of time, defined as
‘n’ in the formula.
● Where, n is indicative of drug release
mechanism; t is time, k is rate constant; M0
/M is fractional release of drug.
● In non linear it is not possible to determine
other variable value.
● In linear case if we have one variable value
its possible to determine other variable
value.
Linearity Concept
● Linearity is a mathematical relationship
between two variables quantities (they may
be same unit), which are directly proportional
to each other.
● Graphically it represents a straight line when
plotted against each other.
● The closer r is to zero, the weaker the linear
relationship.
● In positive correlation, the values of both
variables tend to increase together.
● Negative correlation, the values of one
variable tend to increase when the values of
the other variable decrease.
● The values 1 and -1 both represent "perfect"
correlations, positive and negative
respectively.
● Two perfectly correlated variables change
together at a fixed rate. They have a linear
relationship; when plotted on a scatterplot,
all data points can be connected with a
straight line.
Linearity Concept
● The strength and direction of the linear
relationship between two variable quantities
is termed as correlation coefficient (r) (-1 to
1).
● Coefficient of determination (r2) ranges form
0-1. It denotes linearity of line / two variables.
● In this formula, σ is the standard deviation,
x1 is the data point, µ is the mean, and N is
the total number of data points.
Standard Deviation
● A standard deviation (or σ) is a measure of
how dispersed the data is in relation to the
mean.
● Standard Deviation is a statistical term used
to measure the amount of variability or
dispersion around an average.
● Low standard deviation means data are
clustered around the mean, and high
standard deviation indicates data are more
spread out.
● A standard deviation close to zero indicates
that data points are close to the mean,
whereas a high or low standard deviation
indicates data points are respectively above
or below the mean.
● If there is a difference between the
observed and the expected frequencies then
the value of Chi square would be more than
0.
● The larger the Chi-square the greater the
probability of a real divergence of
experimentally observed from expected
results.
● This statistical test follows a specific
distribution known as chi square
distribution.
Chi square test
● A chi-square test is a statistical test used to
compare observed results with expected
results.
● The purpose of this test is to determine if a
difference between observed data and
expected data is due to chance, or if it is due
to a relationship between the variables you
are studying.
● Thus, Chi-square is a measure of actual
divergence of the observed and expected
frequencies.
● If there is no difference between expected
and observed frequencies the value of Chi-
square is 0.
Uses of Chi-Square Test
● Although test is conducted in terms of
frequencies it can be best viewed
conceptually as a test about proportions.
● Χ2 test is used in testing hypothesis and is
not useful for estimation.
● Chi-square test can be applied to complex
contingency table with several classes.
● Chi-square test has a very useful property
i.e., ‘the additive property’. If a number of
sample studies are conducted in the same
field, the results can be pooled together.
This means that χ2 values can be added.
Chi square test
The applications of χ2
● Testing the divergence of observed results
from expected results when our expectations
are based on the hypothesis of equal
probability.
● Chi-square test when expectations are based
on normal distribution.
● Chi-square test when our expectations are
based on predetermined results.
● Correction for discontinuity or Yates’
correction in calculating χ2
● Chi-square test of independence in
contingency tables.
● t test depends on the properties of normal
distribution curves.
Student’s t test
● This is parametric test used to compare
samples form two different batches.
● It is usually used with small (<30) samples
that are normally distributed.
Types of t tests
● Single sample t test: only one group tested
against a hypothetical mean.
● Independent sample t test: Two groups, two
means, no relation between groups. Example
test drug with placebo.
● Paired t test: Samples of matched pairs of
similar units or group of units tested twice.
Example before and after treatment effect.
● The analysis of variance involves
determining if the observed values belong to
the same population, regardless of the
group, or whether the observations in at
least one of these groups come from a
different population.
ANOVA
● The ANOVA is used to identify and measure
sources of variation within a collection of
observations, hence the name analysis of
variance.
● Analysis of variance is a parametric
statistical technique that has found extensive
applications in scientific research, mainly
because of its flexibility.
● This method may be employed to analyse
both paired and independent data and also is
used to simultaneously compare large
number of variables.
● The one-way ANOVA is nothing more than an
expansion of the t-test to more than two
groups of sample.
Two way ANOVA
● It is used when the data are classified on
the basis of two factors.
● It is statistical test used to determine the
effect of two nominal predictor variables on
a continuous outcome variable.
● It analyses the effect of the independent
variables on the expected outcome along
with their relationship to the outcome itself.
● Two-way design may have repeated
measurements of each factor or may not
have repeated values.
ANOVA
One way ANOVA
● T is the simplest type of ANOVA, in which
only one source of variation, or factor, is
investigated.
● It is an extension to three or more samples of
the t test procedures for use with two
independent samples.
● In another way t test for use with two
independent samples is a special case of one
way analysis of variance.
ANOVA
Applications of ANOVA
● Similar to t test.
● More versatile than t-test.
● ANOVA is the synthesis of several ideas and
is used for multiple purposes.
● The statistical analysis depends on the
design and discussion of ANOVA therefore
includes common statistical designs used in
pharmaceutical research.
● Pharmacokinetic and pharmacodynamic data
can be evaluated.
Thank you
Professor in Pharmaceutics,
Adarsh College of Pharmacy, Vita, Sangli
415311
drkailasmali4u@gmail.com
+91 955 252 7353

DIffusion, Dissolution and Pharmacokinetic Parameters.pptx

  • 1.
    Modern Pharmaceutics Dr. KailasMali Professor in Pharmaceutics, Adarsh College of Pharmacy, Vita Study of Consolidation Parameters
  • 2.
    1. Diffusion parameters 2.Dissolution parameters 3. Pharmacokinetic parameters 4. Heckel plots, 5. Similarity factors – f2 and f1, 6. Higuchi and peppas plot, 7. Concept and significance of Linearity, Standard deviation , chi square test, student T-test , ANOVA test. Contents
  • 3.
    ● Diffusion ofdrug from dosage form Diffusion Parameters Diffusion ● It is a process of the mass transfer of the individual molecule of a substance brought about by random molecular motion associated with a driving force like concentration gradient (higher to lower concentration). ● Free diffusion of the substance through liquids, solids and the membranes are of special interest in designing of a dosage form. ● Studying diffusional parameters will help us to understand permeation and distribution of drug molecules in living systems.
  • 4.
    ● Drug releaseform reservoir and matrix. Diffusion Parameters Applications of Diffusion ● The release of drugs from dosage forms is diffusion controlled (SR and CR Products). ● Molecular weight of polymers can be estimated form diffusion process. ● Absorption of drugs from various routes can be understood and predicted form the principles of diffusion. ● The diffusion of drugs into to tissues and their excretion through kidneys can be anticipated through diffusion studies. ● Principles of diffusion can be used as in vitro models for drug protein binding studies.
  • 5.
    ● The changein mass transfer also occurs simultaneously with respect to distance. ● Fick’s first law states that the flux (the rate of mass transfer across a unit surface area of barrier) is directly proportional to the concentration gradient. ● Where, dC is change in concentration of material, g/cm3; D is diffusion coefficient of a penetrant, cm2/sec; dx is change in distance, cm. ● D is affected by the concentration, temperature, pressure, solvent property and chemical nature of diffusant Diffusion Parameters Fick’s First Law ● In diffusion, molecules get transported from one compartment to another over a period of time- ie, rate of mass transfer (dm/dt). This is expressed as flux. Flux (J) is eual to the rate of mass transfer across a unit surface area of a barrier. ● Where, dM is change in the mass of material, g S is barrier surface area, cm2 dt is change in time, sec. dt dM S J   1 dx dC D J  
  • 6.
    ● If diffusionis the rate determining step, then we can use Ficks first law of diffusion to describe the overall process Diffusion Parameters ● The negative sign in the right side term in equation signifies a decrease in the concentration. But flux is always a positive quantity, because it increases continuously during process. The dx is perpendicular to the surface of the barrier. ● Combining above two equations: ● Equation represents the rate of mass transfer as per Ficks first law. dx dC DS dt dM  
  • 7.
    ● Later on,Nernst and Burner showed that k is a composite constant being proportional to the diffusion coefficient, D and the surface area of the dissolving body, A. Thus the modified equation is called as the Nernst and Burner equation: ● Where, h is the thickness of the boundary layer, A is the surface area of dissolving solid, Kw/o is the partition coefficient of drug and V is the volume of the dissolution medium. Diffusion Parameters Diffusion limited model or Film theory ● The first dissolution experiment were conducted by the Noyes and Whitney and found that the dissolution rate (dc/dt), is a linear function of the difference between the bulk concentration at time t and the saturation solubility: ● Where, k is the dissolution rate constant. ) ( b s C C k dt dc   ) ( / b s O W C C Vh DAK dt dc  
  • 8.
    ● Plot ofconcentration versus distance from solid surface Diffusion Parameters Variables in Diffusion Process ● Surface area (A): Surface area per gram of a solid drug can be changed by altering particle size. ● Diffusion layer thickness (h): In vitro it is determined by the agitation in the bulk solution. In vivo no control over this parameter. Thickness of stagnant layer can be reduced when drug dissolves in reactive medium. Weakly basic drug in an acidic medium dissolves at faster rate than neutral medium because of reduction in thickness of stagnant layer.
  • 9.
    ● Partition coefficient(Kw/o): High water to oil partition increases drug dissolution. ● Concentration in bulk solution (Cb): In vivo Cb is low due to sink conditions which increases rate of dissolution. In vitro addition of solvents and increase in volume of dissolution medium increases the rate of dissolution. Diffusion Parameters Variables in Diffusion Process ● Diffusion coefficient (D): It depend on the size of molecule and the viscosity of the medium. Increasing the viscosity of medium will decrease the diffusion coefficient and thus dissolution rate. ● Drug solubility (Cs): It is another determinant of dissolution rate. As Cs increases dissolution rate also increases.
  • 10.
    ● To studythe dissolution from a planar system having a homogenous matrix, the relation obtained is: ● Where, Q is the amount of drug released in time t per unit area, C is the drug initial concentration, Cs is the drug solubility in matrix media and D is the diffusivity of the drug molecules in the matrix substance. Higuchi Equation ● Higuchi developed theoretical models to study the release of water soluble and low soluble drugs incorporated in semi-solid and/or solid matrix. ● Cumulative % drug release vs. square root of time. ● Drug release through diffusion mechanism (Fickian diffusion mechanism) ● Mathematical expressions were obtained for drug particles dispersed in a uniform matrix behaving as the diffusion media.
  • 11.
    ● For thecase in which the drug is dissolved from a saturated solution (where Co is the solution concentration) dispersed in a porous matrix. ● Where, Q is the amount of drug released in time t by surface unity, ε is the matrix porosity, C0 is the solution concentration dispersed in a porous matrix and D the diffusion constant of the drug molecules in that liquid. Higuchi Equation ● Planar or spherical systems having a granular (heterogeneous) matrix, where the drug concentration in the matrix is lower than its solubility and the release occurs through pores in the matrix obtained relation is: ● Where, Q is the amount of DR in time t by surface unity, C is the initial concentration of the drug, ε is the matrix porosity, τ is the tortuosity factor of the capillary system, CS is the drug solubility in the matrix /excipient media and D the diffusion constant of the drug molecules in that liquid.
  • 12.
    ● Higuchi Plot HiguchiEquation ● According to simplified Higuchi model equation is as follows: ● Where, KH is the Higuchi dissolution constant. ● Higuchi describes drug release as diffusion process based in the Fick’s law, square root time dependent. ● This relation can be used to describe the drug dissolution from several types of modified release pharmaceutical systems.
  • 13.
    ● Effect ofagitation ● Effect of dissolution fluid ● Influence of pH of dissolution fluid ● Effect of surface tension of the dissolution medium ● Effect of viscosity of the dissolution medium ● Effect of the presence of unreactive and reactive additives in the dissolution medium. ● Volume of dissolution medium and sink conditions ● Deaeration of the dissolution medium ● Effect of temp on the dissolution medium Dissolution Parameters ● Dissolution is the process in which a solid substance solubilizes in a given solvent. ● Mass transfer from the solid surface to the liquid phase.
  • 14.
    ● Dissolution testsusing high-speed agitation may lack discriminative value and can yield misleading results. ● The lowest value (25 rpm) is characteristic for suspensions. ● In compendial methods agitation speed is relatively low. ● For the basket method 100rpm and for paddle 50-75 rpm. Dissolution Parameters Effect of agitation ● The relationship between the intensity of agitation and the rate of dissolution differs considerably according to the type of agitation used, degree of laminar and turbulent flow in the system, the shape and design of the stirrer, and the physicochemical properties of the solid. ● Speed of agitation generates a flow that continuously changes the liquid/solid interface between solvent and drug. ● To sustain a reproducible laminar flow, which is essential for gaining reliable results, agitation should be maintained at a relatively low rate.
  • 15.
    ● Dissolution fluidwith example Dissolution Parameters Effect of Dissolution Fluid ● The selection of a proper medium for dissolution testing depends largely on the physicochemical properties of the drug. ● The media typically used in dissolution studies include acidic solutions, buffers, surfactants, and surfactants with acid or buffers. ● Surface active agents are used in dissolution test methods to improve the solubility or wettability of a drug. Dissolution Fluid Example Water Ampicillin Capsule Buffers Azithromycin Capsule Simulated gastric fluid Piroxicam Capsule HCl solution Cimetidine tablet
  • 16.
    ● For tabletscontaining active ingredients, whose solubility is independent of pH, the dissolution rate does not vary considerably with changes in pH of the dissolution medium unless they contain certain excipients that are influenced by pH. ● Sodium bicarbonate, magnesium carbonate, calcium carbonate promotes disintegration of tablet in acidic medium by producing gas. Dissolution Parameters Influence of pH of dissolution fluid ● Variations in pH exert the greatest effect in terms of drug solubility. ● For weak acids, the rate of dissolution increases with increasing pH, whereas, for weak bases, the rate of dissolution increases with decreasing pH. ● pH of stomach is ~2. Acetylsalicylic acid pKa is 3.5.
  • 17.
    ● The additionof surfactant below the CMC can increase significantly the dissolution rate because of better penetration of the solvent into the tablet resulting in greater availability of the drug surface. ● Dissolution data for benzocaine in different concentrations of polysorbate 80. Dissolution Parameters Effect of surface tension of the dissolution fluid ● Surface tension shows a significant effect on the dissolution rate of drugs and their release rate from solid dosage forms. ● Surfactants and wetting agents lower the contact angle and, consequently, improve penetration by the dissolution medium. ● The incorporation of surface-active agents in the dissolution medium is expected to enhance the dissolution rate of a poorly soluble drug in solid dosage forms by decreasing the interfacial tension and micelle formation.
  • 18.
    ● Relationship ofviscosity to dissolution rate of benzoic acid in aqueous methylcellulose solutions at 25°. Dissolution Parameters Effect of viscosity of the dissolution fluid ● In case of diffusion-controlled dissolution processes, it would be expected that the dissolution rate decreases with an increase in viscosity. ● In the case of interfacial-controlled dissolution processes, however, viscosity should have little effect. ● The Stokes-Einstein equation describes diffusion coefficient, D, as a function of viscosity, D=µkT ● Where, µ is the mobility (velocity at a force of one dyne); k is the Boltzmann constant.
  • 19.
    Volume of dissolutionmedium and sink condition ● The suitable volume of the dissolution medium depends mainly on the solubility of the drug in the selected fluid. ● If the drug is poorly soluble in water, a reasonably large amount of fluid should be used. ● To minimize the effect of the concentration gradient and maintain sink conditions, the concentration of the drug should not exceed 10 – 15% of its maximum solubility in the dissolution medium selected. Volume generally 500ml, 900 ml and 1000ml used. Dissolution Parameters Effect of the presence of unreactive and reactive additives in the dissolution medium ● When neutral ionic compounds such as Sodium Chloride and Sodium Sulfate or nonionic organic compounds such as Dextrose were added to the dissolution medium the benzoic acid solubility was directly dependent on its solubility in a particular solvent. ● When certain buffers or bases were added to the aqueous solvent, an increase in the dissolution rate was observed.
  • 20.
    ● This inhibitswetting and lowers the dissolution rate. ● Some drug products are known to be tremendously sensitive to dissolved gas, the presence of air bubbles should be expected to increase the measurement uncertainty in dissolution testing. ● In USP Apparatus 2, released air bubbles deposit on the paddle shaft, the release of air bubbles alters the hydrodynamics of the system by changing the fluid flow characteristics in the dissolution vessel. Dissolution Parameters Deaeration of the dissolution medium ● The presence of dissolved air or other gases in the dissolution medium may impact the dissolution rate of certain formulations and lead to variable and unreliable results. ● Soluble air in distilled water can significantly lower its pH and as a result, affect the rate of dissolution of pH-sensitive drugs. ● Another severe effect is the tendency of the dissolved air to be released from the medium in form of a tiny air bubble. ● These bubbles collect at the surface of the dosage form thereby acting as a hydrophobic barrier between solvent and solid surface.
  • 21.
    ● For adissolved molecule, the diffusion coefficient, D, depends on the temperature T, according to the Stokes equation: ● Where k is the Boltzmann constant and 6πηr is the Stokes force for a spherical molecule (η is the viscosity in cgs or poise units, and r is the radius of the molecule). Dissolution Parameters Effect of temperature of the dissolution medium ● Because drug solubility is temperature- dependent, careful temperature control during the dissolution process is very important and should be maintained within 0.5°. ● Generally, a temperature of 37°C is always maintained during dissolution determinations. ● The effect of temperature variations of the dissolution medium depends mainly on the temperature/ solubility curves of the drug and excipients in the formulation.
  • 22.
    ● Release profileby diminishing surface of the drug particles during the dissolution. ● It gives Erosion release mechanism. ● Applies to pharmaceutical dosage forms such as tablets, where the dissolution occurs in planes that are parallel to the drug surface if the tablet dimensions diminish proportionally in such a manner that the initial geometrical form keeps constant all the time. Hixson and Crowells Cube Root Law ● Particle regular area is proportional to the cubic root of its volume and equation is express as follows: ● Where, W0 is the initial amount of drug in the pharmaceutical dosage form. Wt is the amount of drug remaining as a solid state at time t. KS is the constant incorporation the surface volume relation. ● Cube root of drug % remaining in matrix vs. time ● Drug release is limited by the dissolution rate of the particles, and not by diffusion through the polymer matrix.
  • 23.
    ● Peak plasmaconcentration (Cmax) ● Time of peak concentration (tmax) ● Area under the curve (AUC) Pharmacokinetic Parameters ● Pharmacokinetics is defined as the kinetics of drug absorption, distribution, metabolism and excretion and their relationship with pharmacologic, therapeutic or toxicologic response in mans and animals.
  • 24.
    ● Plasma concentrationtime profile indicating Cmax Pharmacokinetic Parameters Peak plasma concentration (Cmax) ● It is the maximum plasma drug concentration obtained after oral administration of drug. ● The point of maximum concentration of drug in plasma is known as the peak and the concentration of drug at peak is known as peak plasma concentration. ● Cmax is expressed in µg/ml or mg/L. ● It is related with intensity of action.
  • 25.
    ● Plasma concentrationtime profile indicating tmax Pharmacokinetic Parameters Time of Peak Concentration (tmax) ● It is the time required to reach maximum drug concentration in plasma after extravascular drug administration. ● It is useful in estimating the rate of absorption. ● It is expressed in hours. ● Onset time and onset of action depends on time of peak concentration. ● Parameter is of particular importance in assessing the efficacy of drugs used to treat acute conditions like pain and insomnia.
  • 26.
    ● Plasma concentrationtime profile indicating AUC Pharmacokinetic Parameters Area Under Curve (AUC) ● The area under the plasma drug concentration versus time curve. ● AUC is a measurement of the extent of drug bioavailability. ● The AUC reflects the total amount of active drug that reaches the systemic circulation. ● AUC is expressed in mcg*hour/ml. ● It is important for the drugs that are administered repetitively for the treatment of chronic conditions like asthma or epilepsy.
  • 27.
    Disadvantages ● The valuesof f1 and f2 are sensitive to the number of dissolution time points used. ● If test and reference formulations are interchanged, f2 is unchanged but f1 is not, yet differences between the two mean profiles remain the same. ● The basis of the criteria for deciding the difference or similarity between dissolution profiles is unclear. Similarity Factor Model independent analysis (f1 & f2 Factor) ● Most popular methods recommended for use in a number of FDA guidance documents. ● Difference factor (f1) ● Similarity factor (f2) Advantages ● Easy to compute. ● Provide a single number to describe the comparison of dissolution profile data.
  • 28.
    Similarity factor (f2) ●Logarithmic transformation of the sum- squared error of differences between the test and the reference products over all time points. ● Where, Rj is the percentage of dissolved product for a reference batch at time point t, Tj is the percentage of dissolved product for the test batch, N is the number of time points and wj is an optional weight factor, If each time point is weighted equally then it means wj=1. Similarity Factor Difference factor (f1) ● The difference factor (f1) measures the percent error between two curves over all time points ● Where, Rj is the percentage of dissolved product for a reference batch at time point t, Tj is the percentage of dissolved product for the test batch, N is the number of time points.
  • 29.
    ● Comparison Similarity Factor ●For rapid dissolving products, that may dissolve 85% in 15 minutes, comparison of dissolution profiles is not mandatory Difference factor Similarity factor It is proportional to the average difference between the two profiles It is inversely proportional to the average squared difference between the two profiles with emphasis on the larger difference among all the time points Measures the closeness between the two profiles Measures similarity F1 F2 Inference 0 100 Dissolution profiles are similar < 15 >50 Similarity or equivalence of two profiles
  • 30.
    Applications ● New ANDAsubmission ● Filing variation to the original submission CBE filings ● Formula changes ● To waive the requirement of bioequivalence for smaller strengths of formulation ● Site transfer ● Scale up of the lots ● Regulatory submission Similarity Factor Data Structure and steps to follow ● This model independent method is most suitable for the dissolution profile comparisons when three to four or more dissolution time points are available. ● Determine the dissolution profile of two products (12 units each) of test (post- change) and reference (pre-change) products ● Using mean dissolution values from both curves at each time interval, calculate the difference factor and similarity factor. ● For curves to be considered similar, if f1 values close to 0 and f2 values close to 100.
  • 31.
    ● This modelis used to analyze the release of dosage forms when release mechanism is not well known or when more than one type of release phenomena could be involved. Korsmeyer–Peppas Plot ● It a simple, semiempirical model, relating exponentially the drug release to the elapsed time (t): ● According to this model, drug dissolution is function of the exponent of time, defined as ‘n’ in the formula. ● Where, n is indicative of drug release mechanism; t is time, k is rate constant; M0 /M is fractional release of drug.
  • 32.
    ● In nonlinear it is not possible to determine other variable value. ● In linear case if we have one variable value its possible to determine other variable value. Linearity Concept ● Linearity is a mathematical relationship between two variables quantities (they may be same unit), which are directly proportional to each other. ● Graphically it represents a straight line when plotted against each other.
  • 33.
    ● The closerr is to zero, the weaker the linear relationship. ● In positive correlation, the values of both variables tend to increase together. ● Negative correlation, the values of one variable tend to increase when the values of the other variable decrease. ● The values 1 and -1 both represent "perfect" correlations, positive and negative respectively. ● Two perfectly correlated variables change together at a fixed rate. They have a linear relationship; when plotted on a scatterplot, all data points can be connected with a straight line. Linearity Concept ● The strength and direction of the linear relationship between two variable quantities is termed as correlation coefficient (r) (-1 to 1). ● Coefficient of determination (r2) ranges form 0-1. It denotes linearity of line / two variables.
  • 34.
    ● In thisformula, σ is the standard deviation, x1 is the data point, µ is the mean, and N is the total number of data points. Standard Deviation ● A standard deviation (or σ) is a measure of how dispersed the data is in relation to the mean. ● Standard Deviation is a statistical term used to measure the amount of variability or dispersion around an average. ● Low standard deviation means data are clustered around the mean, and high standard deviation indicates data are more spread out. ● A standard deviation close to zero indicates that data points are close to the mean, whereas a high or low standard deviation indicates data points are respectively above or below the mean.
  • 35.
    ● If thereis a difference between the observed and the expected frequencies then the value of Chi square would be more than 0. ● The larger the Chi-square the greater the probability of a real divergence of experimentally observed from expected results. ● This statistical test follows a specific distribution known as chi square distribution. Chi square test ● A chi-square test is a statistical test used to compare observed results with expected results. ● The purpose of this test is to determine if a difference between observed data and expected data is due to chance, or if it is due to a relationship between the variables you are studying. ● Thus, Chi-square is a measure of actual divergence of the observed and expected frequencies. ● If there is no difference between expected and observed frequencies the value of Chi- square is 0.
  • 36.
    Uses of Chi-SquareTest ● Although test is conducted in terms of frequencies it can be best viewed conceptually as a test about proportions. ● Χ2 test is used in testing hypothesis and is not useful for estimation. ● Chi-square test can be applied to complex contingency table with several classes. ● Chi-square test has a very useful property i.e., ‘the additive property’. If a number of sample studies are conducted in the same field, the results can be pooled together. This means that χ2 values can be added. Chi square test The applications of χ2 ● Testing the divergence of observed results from expected results when our expectations are based on the hypothesis of equal probability. ● Chi-square test when expectations are based on normal distribution. ● Chi-square test when our expectations are based on predetermined results. ● Correction for discontinuity or Yates’ correction in calculating χ2 ● Chi-square test of independence in contingency tables.
  • 37.
    ● t testdepends on the properties of normal distribution curves. Student’s t test ● This is parametric test used to compare samples form two different batches. ● It is usually used with small (<30) samples that are normally distributed. Types of t tests ● Single sample t test: only one group tested against a hypothetical mean. ● Independent sample t test: Two groups, two means, no relation between groups. Example test drug with placebo. ● Paired t test: Samples of matched pairs of similar units or group of units tested twice. Example before and after treatment effect.
  • 38.
    ● The analysisof variance involves determining if the observed values belong to the same population, regardless of the group, or whether the observations in at least one of these groups come from a different population. ANOVA ● The ANOVA is used to identify and measure sources of variation within a collection of observations, hence the name analysis of variance. ● Analysis of variance is a parametric statistical technique that has found extensive applications in scientific research, mainly because of its flexibility. ● This method may be employed to analyse both paired and independent data and also is used to simultaneously compare large number of variables. ● The one-way ANOVA is nothing more than an expansion of the t-test to more than two groups of sample.
  • 39.
    Two way ANOVA ●It is used when the data are classified on the basis of two factors. ● It is statistical test used to determine the effect of two nominal predictor variables on a continuous outcome variable. ● It analyses the effect of the independent variables on the expected outcome along with their relationship to the outcome itself. ● Two-way design may have repeated measurements of each factor or may not have repeated values. ANOVA One way ANOVA ● T is the simplest type of ANOVA, in which only one source of variation, or factor, is investigated. ● It is an extension to three or more samples of the t test procedures for use with two independent samples. ● In another way t test for use with two independent samples is a special case of one way analysis of variance.
  • 40.
    ANOVA Applications of ANOVA ●Similar to t test. ● More versatile than t-test. ● ANOVA is the synthesis of several ideas and is used for multiple purposes. ● The statistical analysis depends on the design and discussion of ANOVA therefore includes common statistical designs used in pharmaceutical research. ● Pharmacokinetic and pharmacodynamic data can be evaluated.
  • 41.
    Thank you Professor inPharmaceutics, Adarsh College of Pharmacy, Vita, Sangli 415311 drkailasmali4u@gmail.com +91 955 252 7353