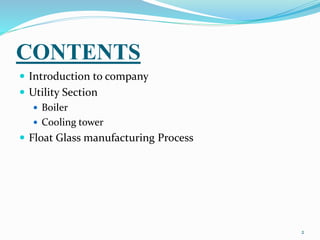
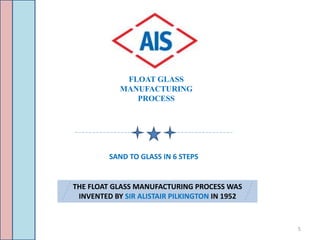
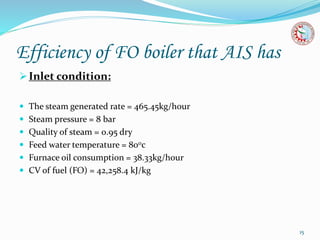
Industrial Training
at Asahi India Glass Ltd.
Submitted By:
Ajeet Kumar Saini
Mechanical 4th year
Section- L
Submitted To:
Mr. Amit Dhiman
Assistant Professor
(Department of Mechanical
Engineering)
1
CONTENTS
 Introduction to company
 Utility Section
 Boiler
 Cooling tower
 Float Glass manufacturing Process
2
ABOUT COMPANY
AIS
GLASS
3
4
FLOAT GLASS
MANUFACTURING
PROCESS
SAND TO GLASS IN 6 STEPS
THE FLOAT GLASS MANUFACTURING PROCESS WAS
INVENTED BY SIR ALISTAIR PILKINGTON IN 1952
5
RAW MATERIAL BATCH
Fine grained ingredients closely controlled for quality, are mixed to make a batch.
Silica Sand (sio2) – Primary RM(70-74%) Soda Ash (Na2O)
To lower Melting Point
(12-14%)
Limestone (CaO)
To reduce solubility
(6-12%)
Dolomite(MgO)
To reduce solubility
(0-4%)
Feldspar (Al2O3)
To increase hardness
(0-2%)
6
GLASS FURNACE
The batch then flows into the furnace,
Which is heated up to 15000C
If certain metal
oxides are mixed
to this batch they
impart colors to
the glass giving it a
body tint.
Broken glass aka
cullet, is added to
the mixture to the
tune of nearly 25-
30% which act
primarily as flux
(helps in reducing
the melting point
of the batch)
7
FLOAT BATH
Molten Glass from the furnace gently flows over the refractory spout on
to the mirror-like surface of molten tin, starting at 11000C and leaving
the float bath as solid ribbon at 6000C
8
ANNEALING LEHR
Despite the tranquillity with which the glass is formed, considerable
stresses are developed in the ribbon as the glass cools. The glass is made
to move through the annealing lehr where such internal stresses are
removed, as the glass is cooled gradually.
9
INSPECTION
To ensure the highest quality inspection takes place at every stage.
Diamond steel trim off selvedge – stressed edges- and cut ribbon to size dictated
by the computer. Glass is finally sold
Only in Square meters.
10
PACKAGING & DISPATCH
Glass is packed with suitable packaging in wooden crates to avoid any kind of
damage during the transit and is then load into the containers
to be shipped to the destination.
11
12
13
Rankine cycle
 Ts diagram:
14
T
1
23
4
5
S
Efficiency of FO boiler that AIS has
Inlet condition:
 The steam generated rate = 465.45kg/hour
 Steam pressure = 8 bar
 Quality of steam = 0.95 dry
 Feed water temperature = 800c
 Furnace oil consumption = 38.33kg/hour
 CV of fuel (FO) = 42,258.4 kJ/kg
15
Calculation
 PROCESS 4-1 REPRESENT THE BOLIER ON RANKINE CYCLE (Ts diagram)
The enthalpy of steam (h1) = hf + xhfg at 8 bar
=721+(0.95*2046)
=2664.7 kj/kg
The enthalpy of feed water (h4) = hf at 800c
=334.92kj/kg
Mass of steam = rate of steam generated/( FO consumption)
= 465.45/(38.33)
= 12.143 or 13
Therefore efficiency of boiler is given by :
= m*(h1-h4)/(cv)
=13*2329.78/(42258.4)*100
Ƞb = 71.6712%
16
17
End-Use
Steam Load
Boiler
Distribution System
Loss 5-15% Heat Loss in Blowdown 1-
3%
Fuel
Steam
Energyinput100%
Radiation & Convection
Heat loss: 1-4%
Heat Loss in Flue Gases:
18-22%
Boiler Energy
Output: 71-80%
Overall System
Efficiency: 56-75%
Losses in Boiler
Ten step to improve the boiler
efficiency
Monitor feed water quality
Boiler sizing
 Blowdown control & heat recovery from Blowdown
Furnace draft tuning
Excess air
Fuel quality
Tube cleaning
Online monitoring of boiler
Boiler automation
18
Waste heat recovery boiler
WHRB:
 Waste heat recovery boiler utilizes the flue gas coming from
furnace for steam generation.
WHRB SPECIFICATION:
 Feed water temperature =80.80c
 Flue gas temperature=260.70c
 Steam generated=1100kg/hour
 At a temperature =1700c & pressure=8bar
19
Efficiency of Cooling Tower
Ti=380c
To=320c
Tw= 270c
Therefore efficiency = (38-32)/(38-27)*100
=54.545454 or 55%
20
Calculation Of Efficiency of Cooling
Tower that AIS has
 Let Hot water temperature is denoted as Ti
 Let Cold water temperature is denoted as To
& wet bulb temperature is denoted as Tw
21
Factors that affect the performance of
cooling tower
 Blowdown Losses:
 Evaporation Loss.
 Drift loss:
22
23

Float glass manufacturing process

  • 1.
    Industrial Training at AsahiIndia Glass Ltd. Submitted By: Ajeet Kumar Saini Mechanical 4th year Section- L Submitted To: Mr. Amit Dhiman Assistant Professor (Department of Mechanical Engineering) 1
  • 2.
    CONTENTS  Introduction tocompany  Utility Section  Boiler  Cooling tower  Float Glass manufacturing Process 2
  • 3.
  • 4.
  • 5.
    FLOAT GLASS MANUFACTURING PROCESS SAND TOGLASS IN 6 STEPS THE FLOAT GLASS MANUFACTURING PROCESS WAS INVENTED BY SIR ALISTAIR PILKINGTON IN 1952 5
  • 6.
    RAW MATERIAL BATCH Finegrained ingredients closely controlled for quality, are mixed to make a batch. Silica Sand (sio2) – Primary RM(70-74%) Soda Ash (Na2O) To lower Melting Point (12-14%) Limestone (CaO) To reduce solubility (6-12%) Dolomite(MgO) To reduce solubility (0-4%) Feldspar (Al2O3) To increase hardness (0-2%) 6
  • 7.
    GLASS FURNACE The batchthen flows into the furnace, Which is heated up to 15000C If certain metal oxides are mixed to this batch they impart colors to the glass giving it a body tint. Broken glass aka cullet, is added to the mixture to the tune of nearly 25- 30% which act primarily as flux (helps in reducing the melting point of the batch) 7
  • 8.
    FLOAT BATH Molten Glassfrom the furnace gently flows over the refractory spout on to the mirror-like surface of molten tin, starting at 11000C and leaving the float bath as solid ribbon at 6000C 8
  • 9.
    ANNEALING LEHR Despite thetranquillity with which the glass is formed, considerable stresses are developed in the ribbon as the glass cools. The glass is made to move through the annealing lehr where such internal stresses are removed, as the glass is cooled gradually. 9
  • 10.
    INSPECTION To ensure thehighest quality inspection takes place at every stage. Diamond steel trim off selvedge – stressed edges- and cut ribbon to size dictated by the computer. Glass is finally sold Only in Square meters. 10
  • 11.
    PACKAGING & DISPATCH Glassis packed with suitable packaging in wooden crates to avoid any kind of damage during the transit and is then load into the containers to be shipped to the destination. 11
  • 12.
  • 13.
  • 14.
    Rankine cycle  Tsdiagram: 14 T 1 23 4 5 S
  • 15.
    Efficiency of FOboiler that AIS has Inlet condition:  The steam generated rate = 465.45kg/hour  Steam pressure = 8 bar  Quality of steam = 0.95 dry  Feed water temperature = 800c  Furnace oil consumption = 38.33kg/hour  CV of fuel (FO) = 42,258.4 kJ/kg 15
  • 16.
    Calculation  PROCESS 4-1REPRESENT THE BOLIER ON RANKINE CYCLE (Ts diagram) The enthalpy of steam (h1) = hf + xhfg at 8 bar =721+(0.95*2046) =2664.7 kj/kg The enthalpy of feed water (h4) = hf at 800c =334.92kj/kg Mass of steam = rate of steam generated/( FO consumption) = 465.45/(38.33) = 12.143 or 13 Therefore efficiency of boiler is given by : = m*(h1-h4)/(cv) =13*2329.78/(42258.4)*100 Ƞb = 71.6712% 16
  • 17.
    17 End-Use Steam Load Boiler Distribution System Loss5-15% Heat Loss in Blowdown 1- 3% Fuel Steam Energyinput100% Radiation & Convection Heat loss: 1-4% Heat Loss in Flue Gases: 18-22% Boiler Energy Output: 71-80% Overall System Efficiency: 56-75% Losses in Boiler
  • 18.
    Ten step toimprove the boiler efficiency Monitor feed water quality Boiler sizing  Blowdown control & heat recovery from Blowdown Furnace draft tuning Excess air Fuel quality Tube cleaning Online monitoring of boiler Boiler automation 18
  • 19.
    Waste heat recoveryboiler WHRB:  Waste heat recovery boiler utilizes the flue gas coming from furnace for steam generation. WHRB SPECIFICATION:  Feed water temperature =80.80c  Flue gas temperature=260.70c  Steam generated=1100kg/hour  At a temperature =1700c & pressure=8bar 19
  • 20.
    Efficiency of CoolingTower Ti=380c To=320c Tw= 270c Therefore efficiency = (38-32)/(38-27)*100 =54.545454 or 55% 20
  • 21.
    Calculation Of Efficiencyof Cooling Tower that AIS has  Let Hot water temperature is denoted as Ti  Let Cold water temperature is denoted as To & wet bulb temperature is denoted as Tw 21
  • 22.
    Factors that affectthe performance of cooling tower  Blowdown Losses:  Evaporation Loss.  Drift loss: 22
  • 23.