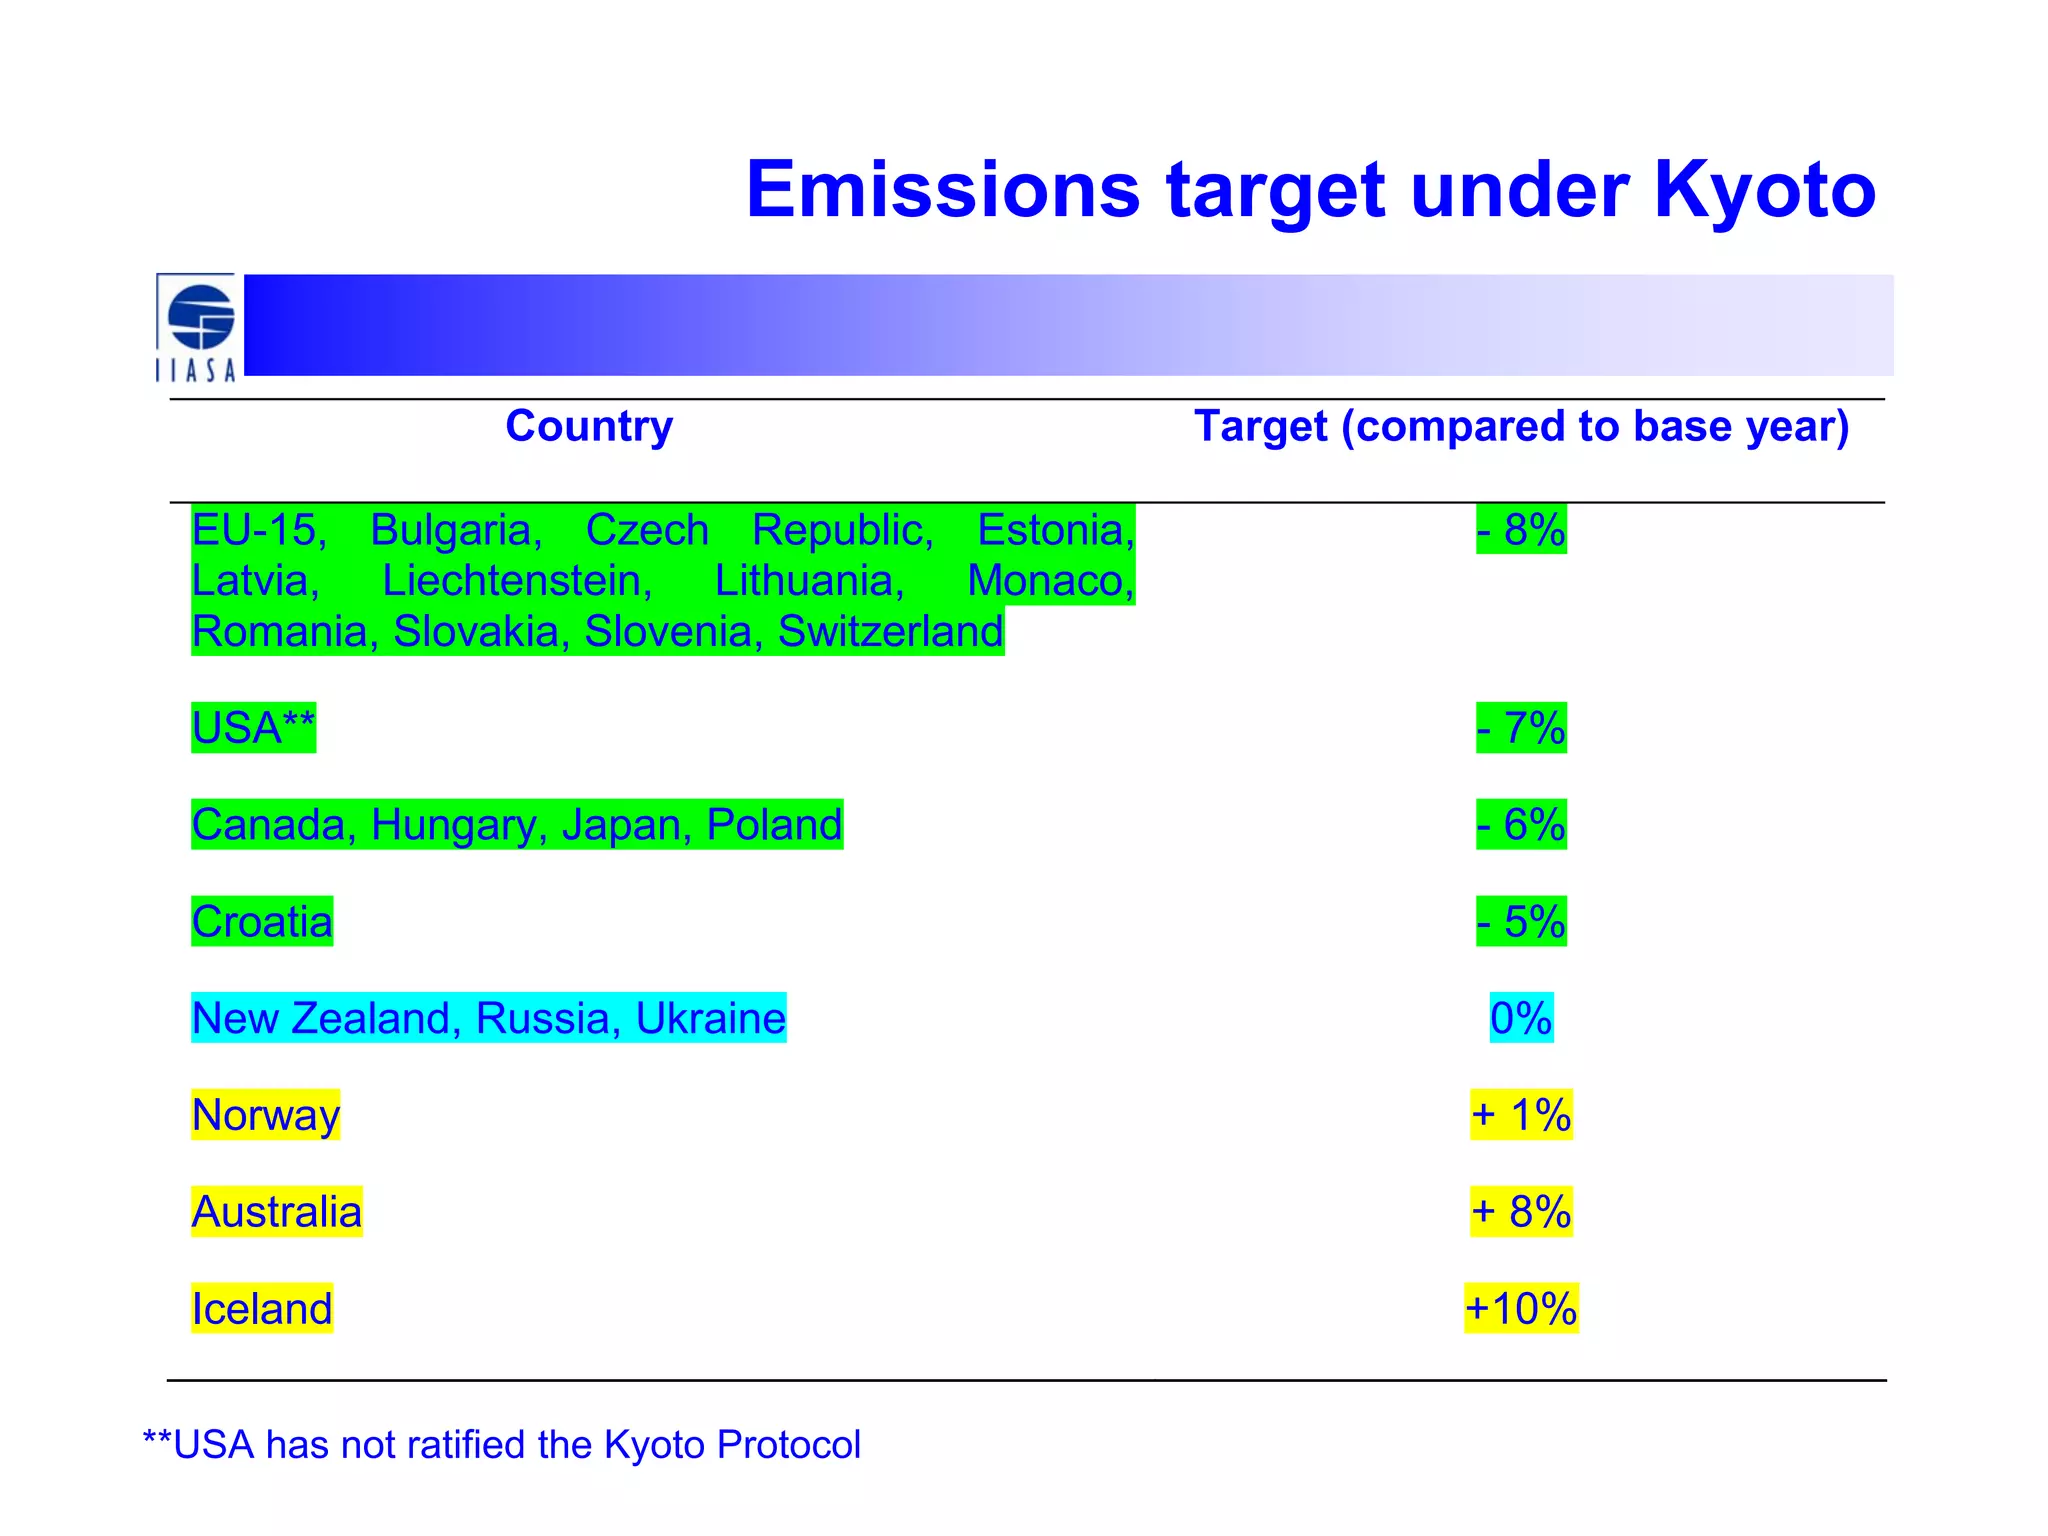
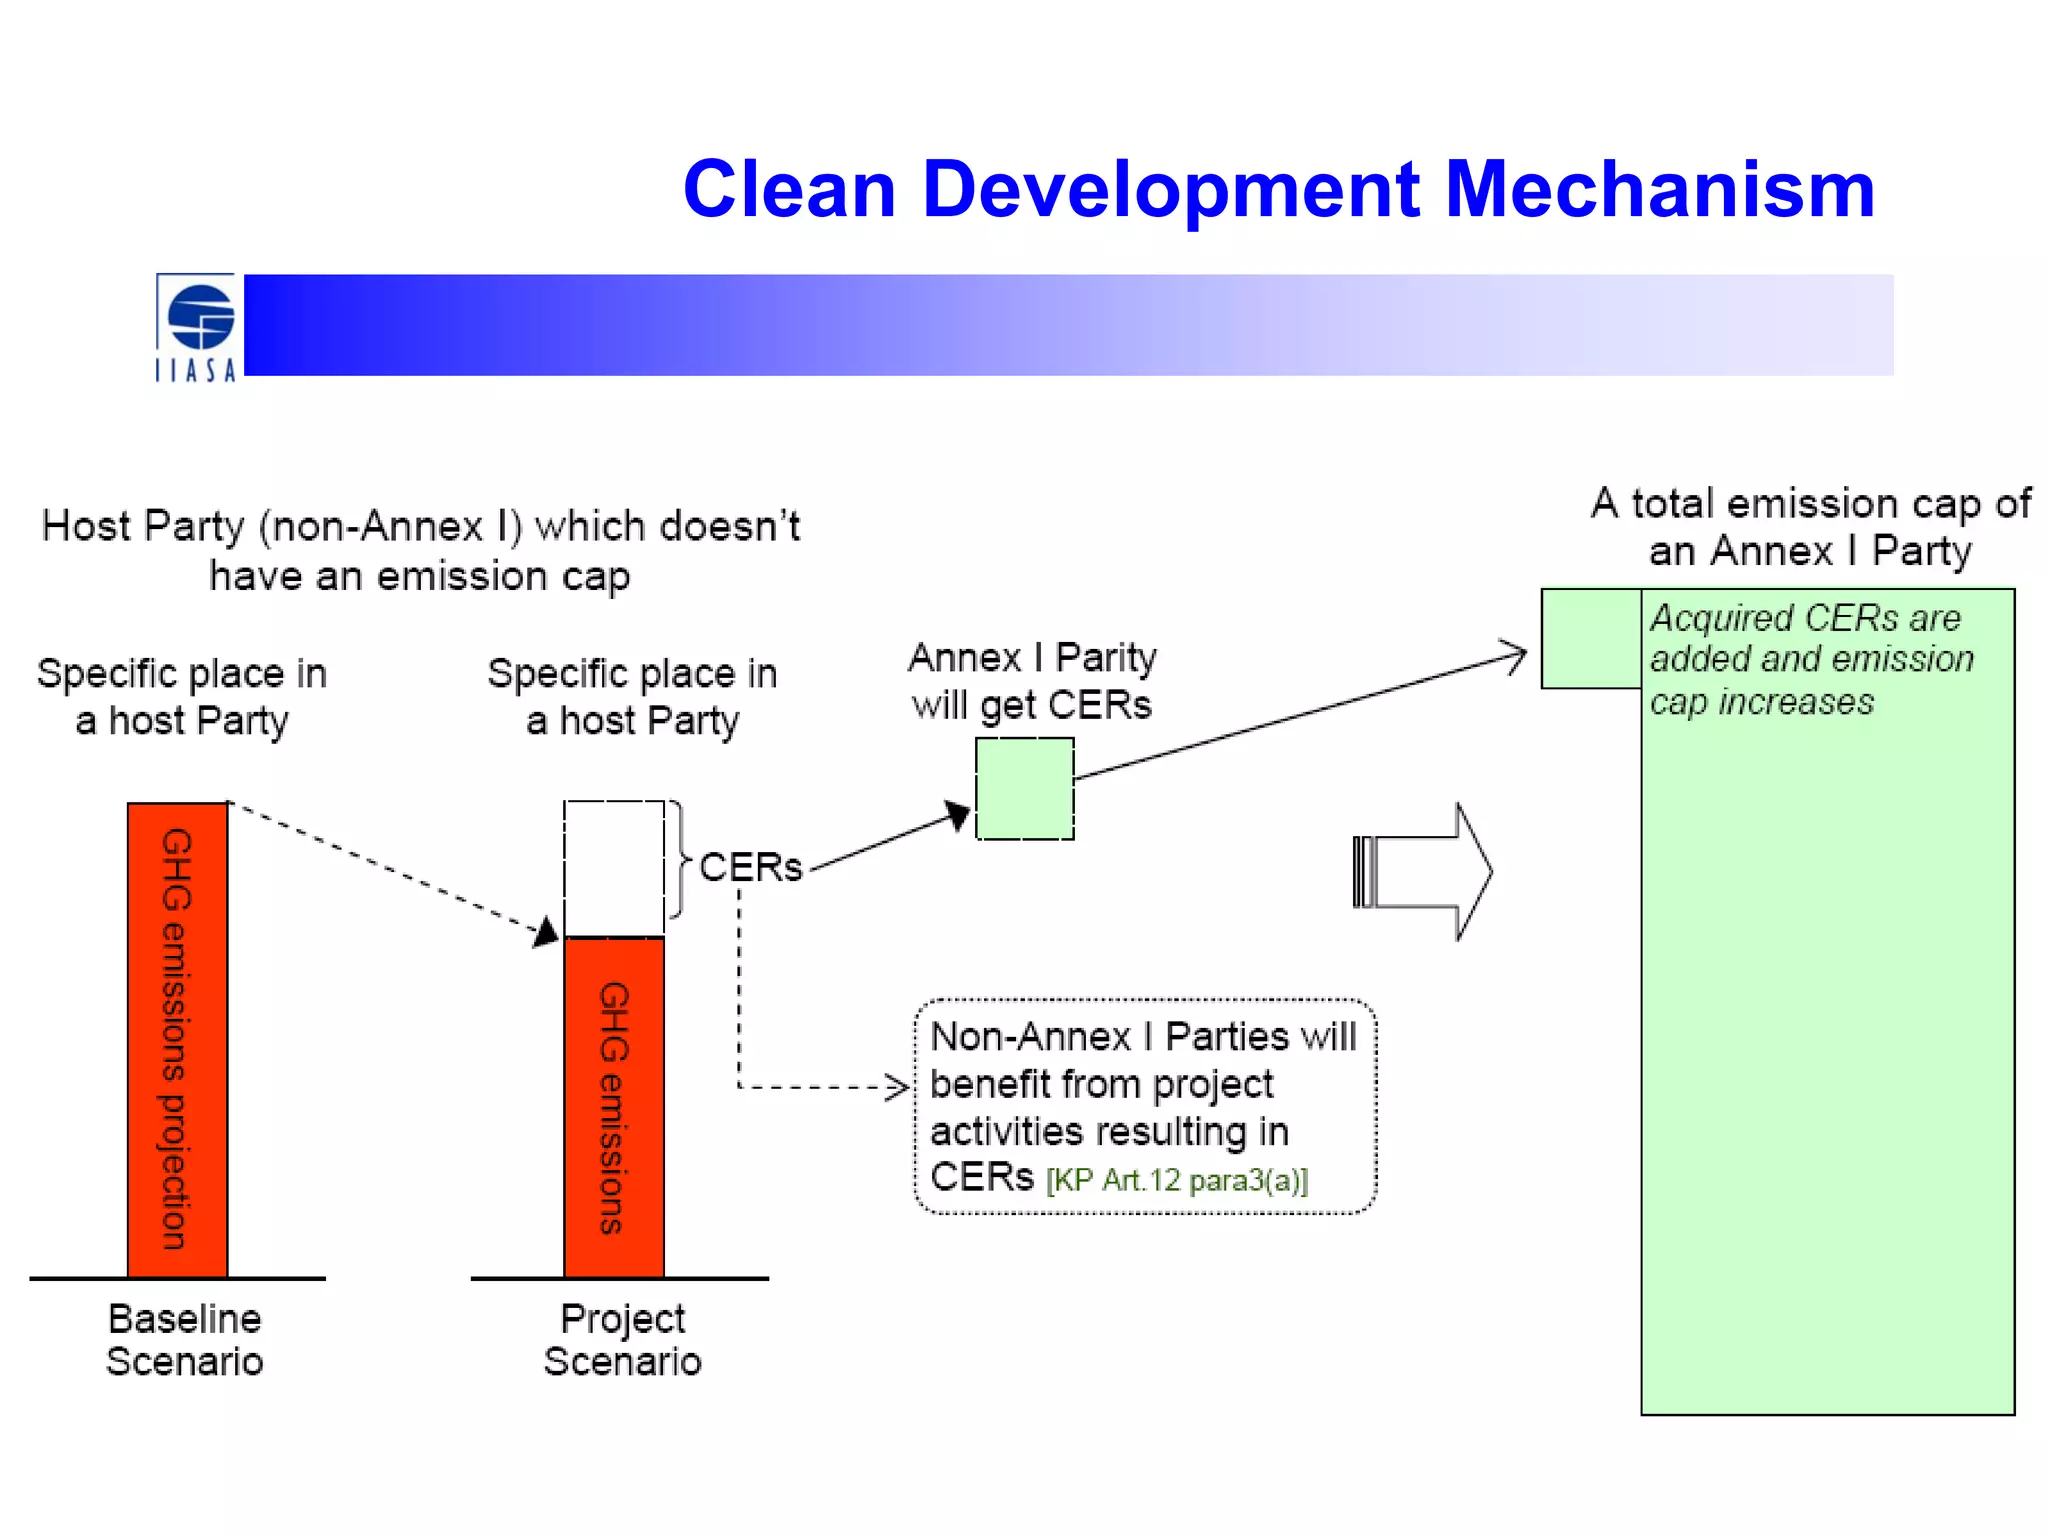
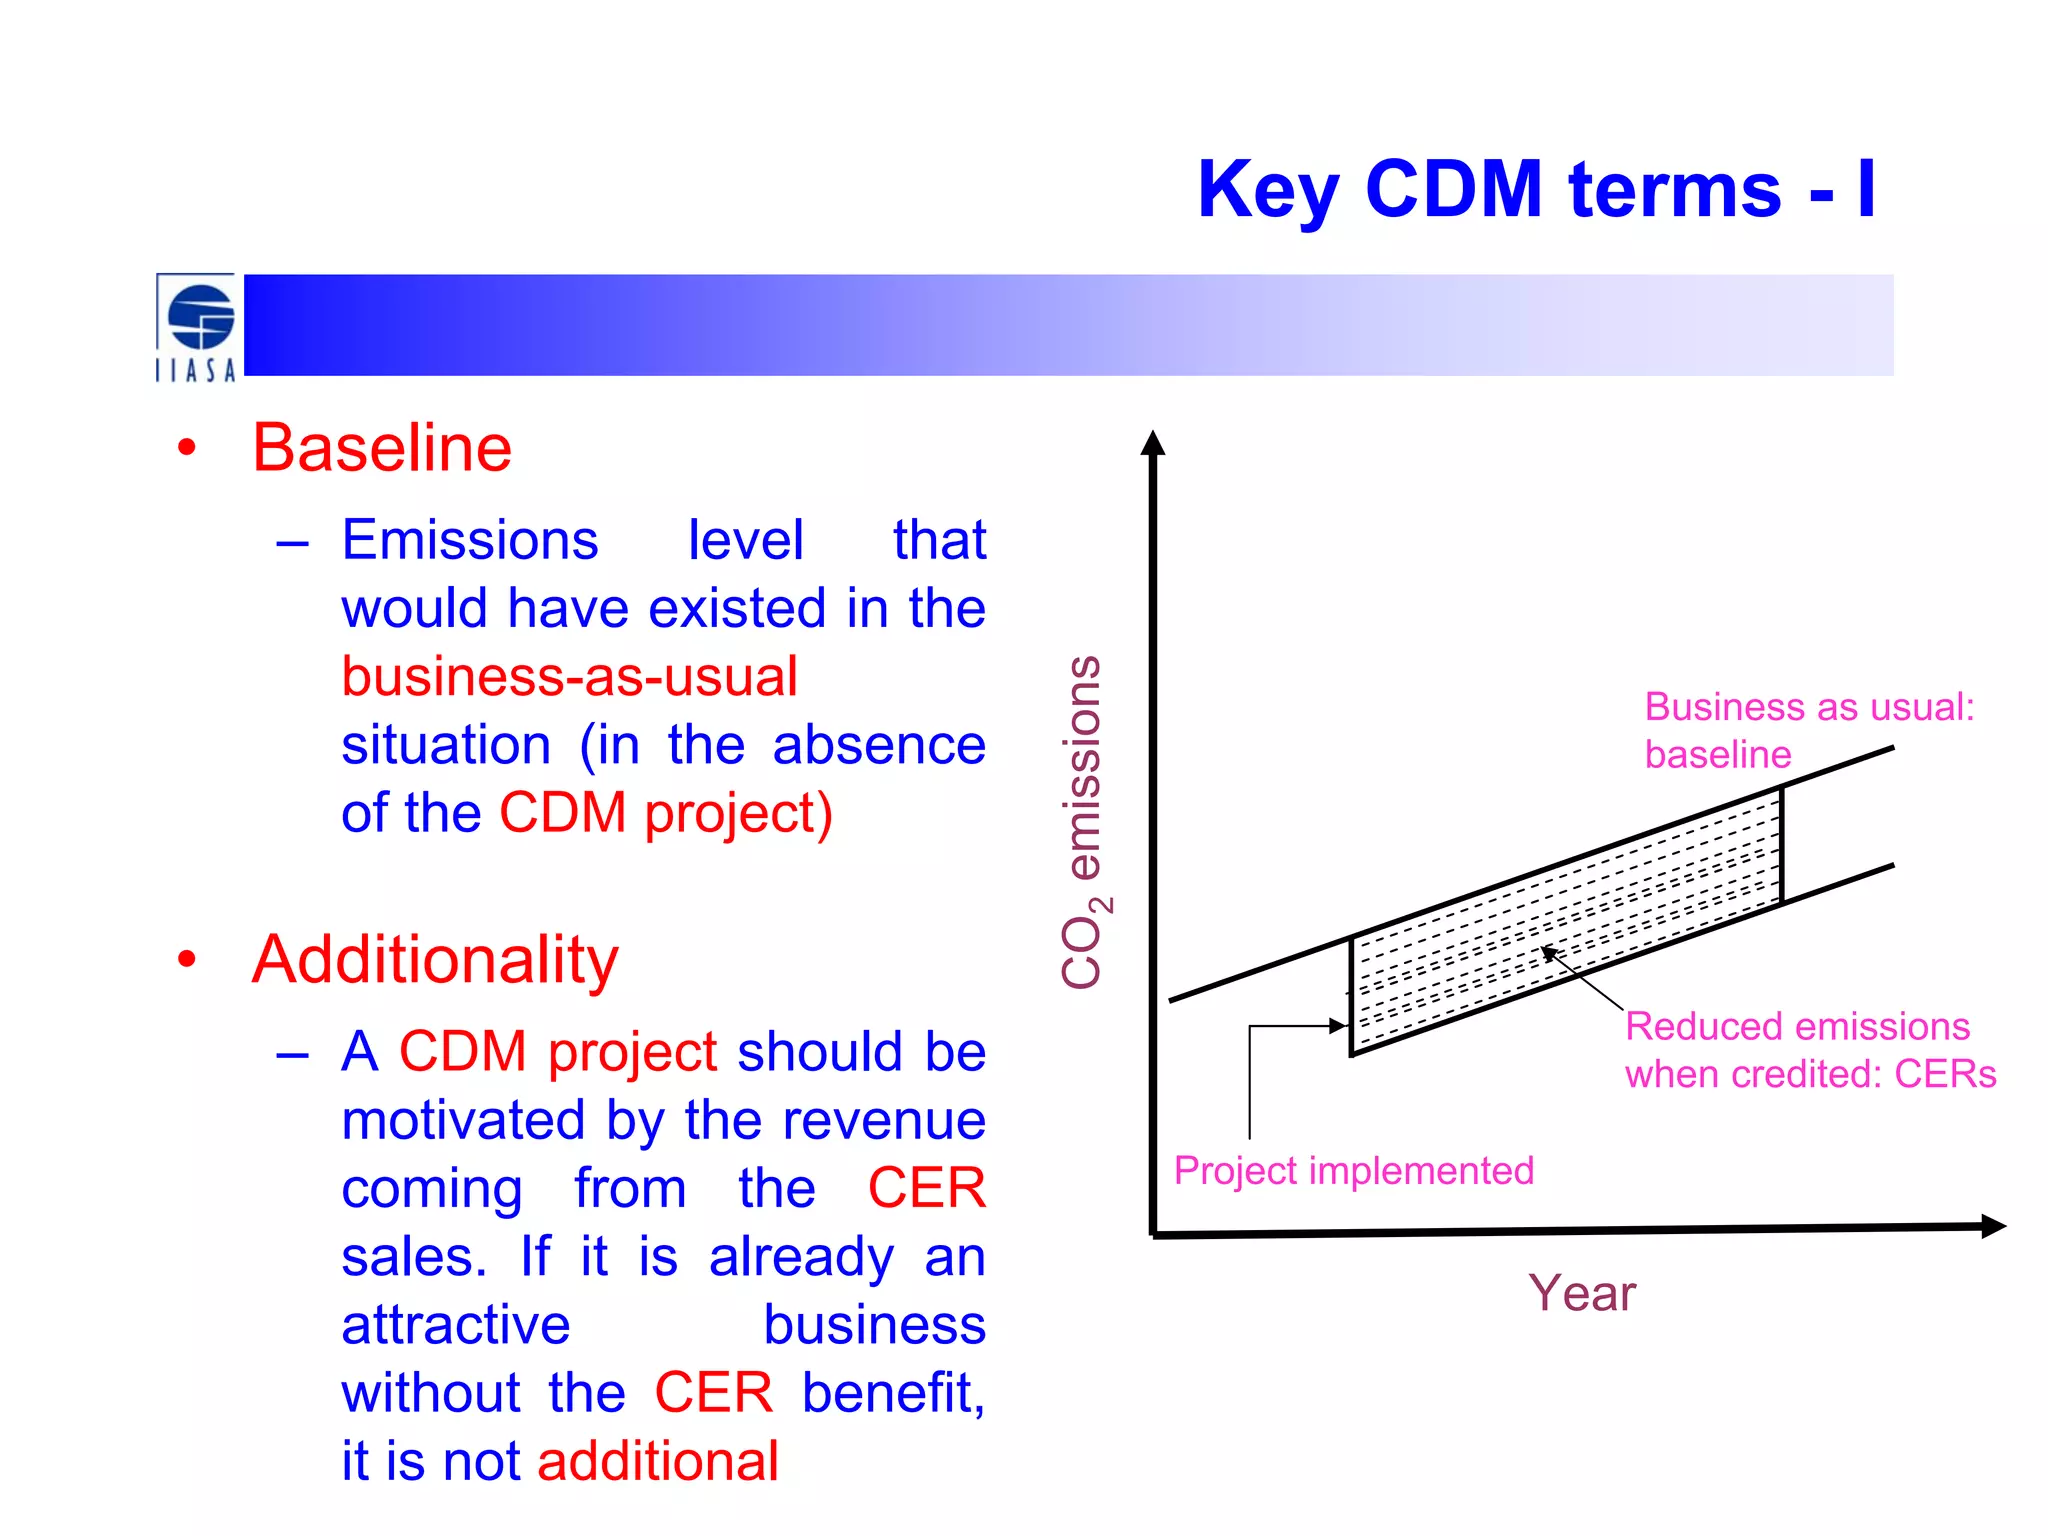
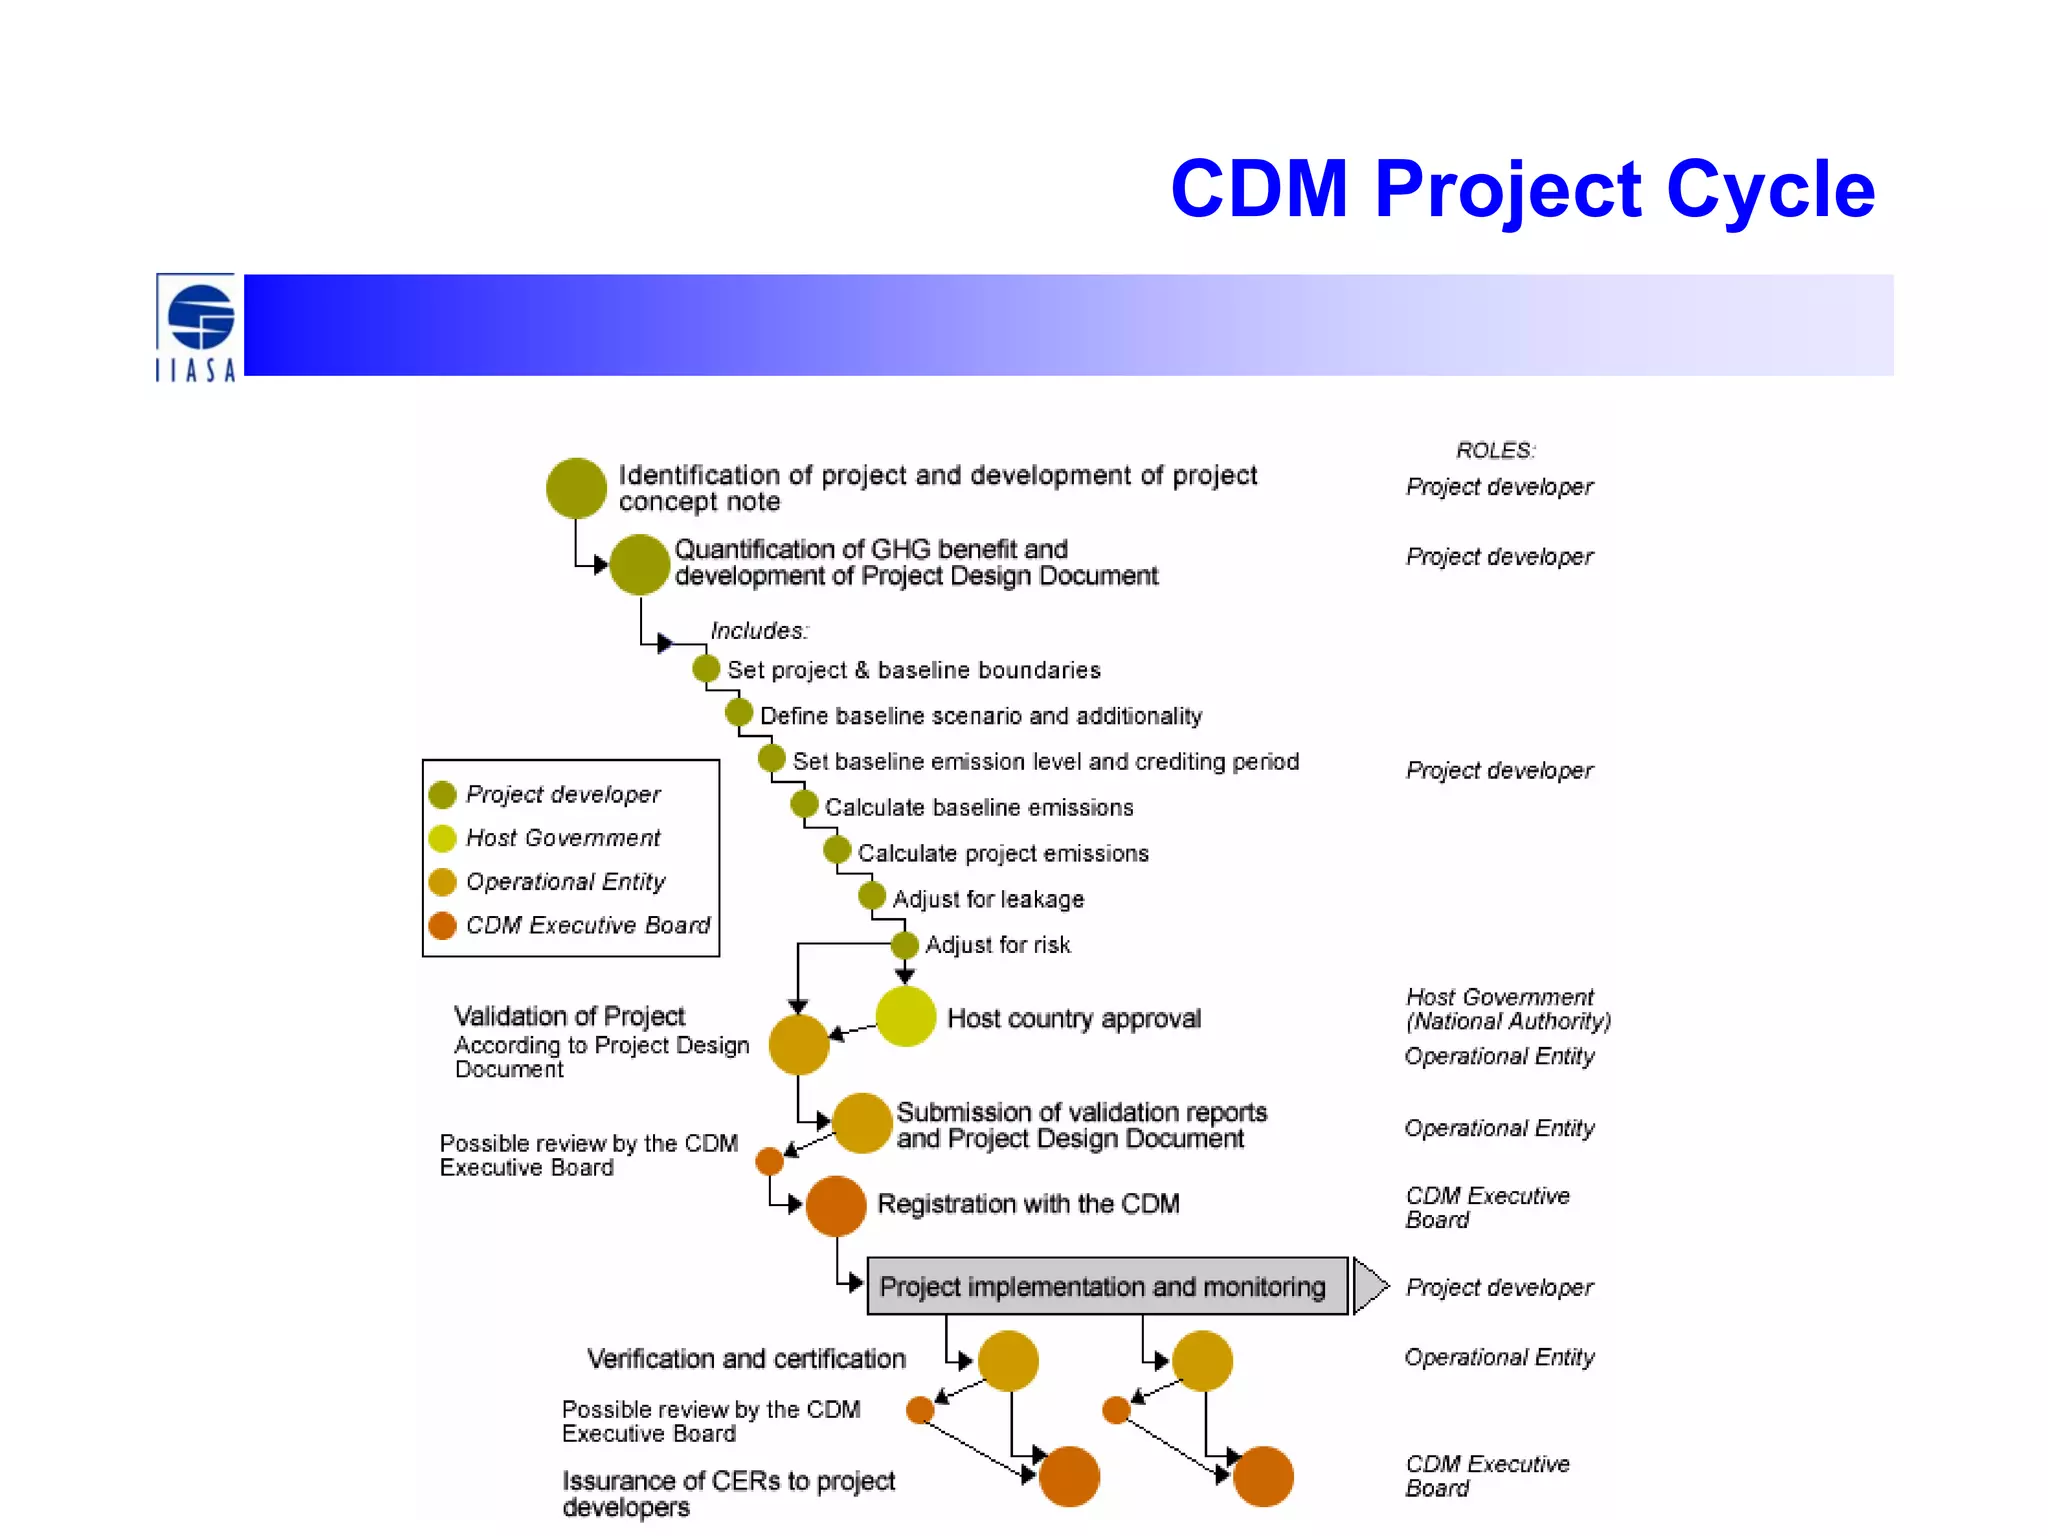
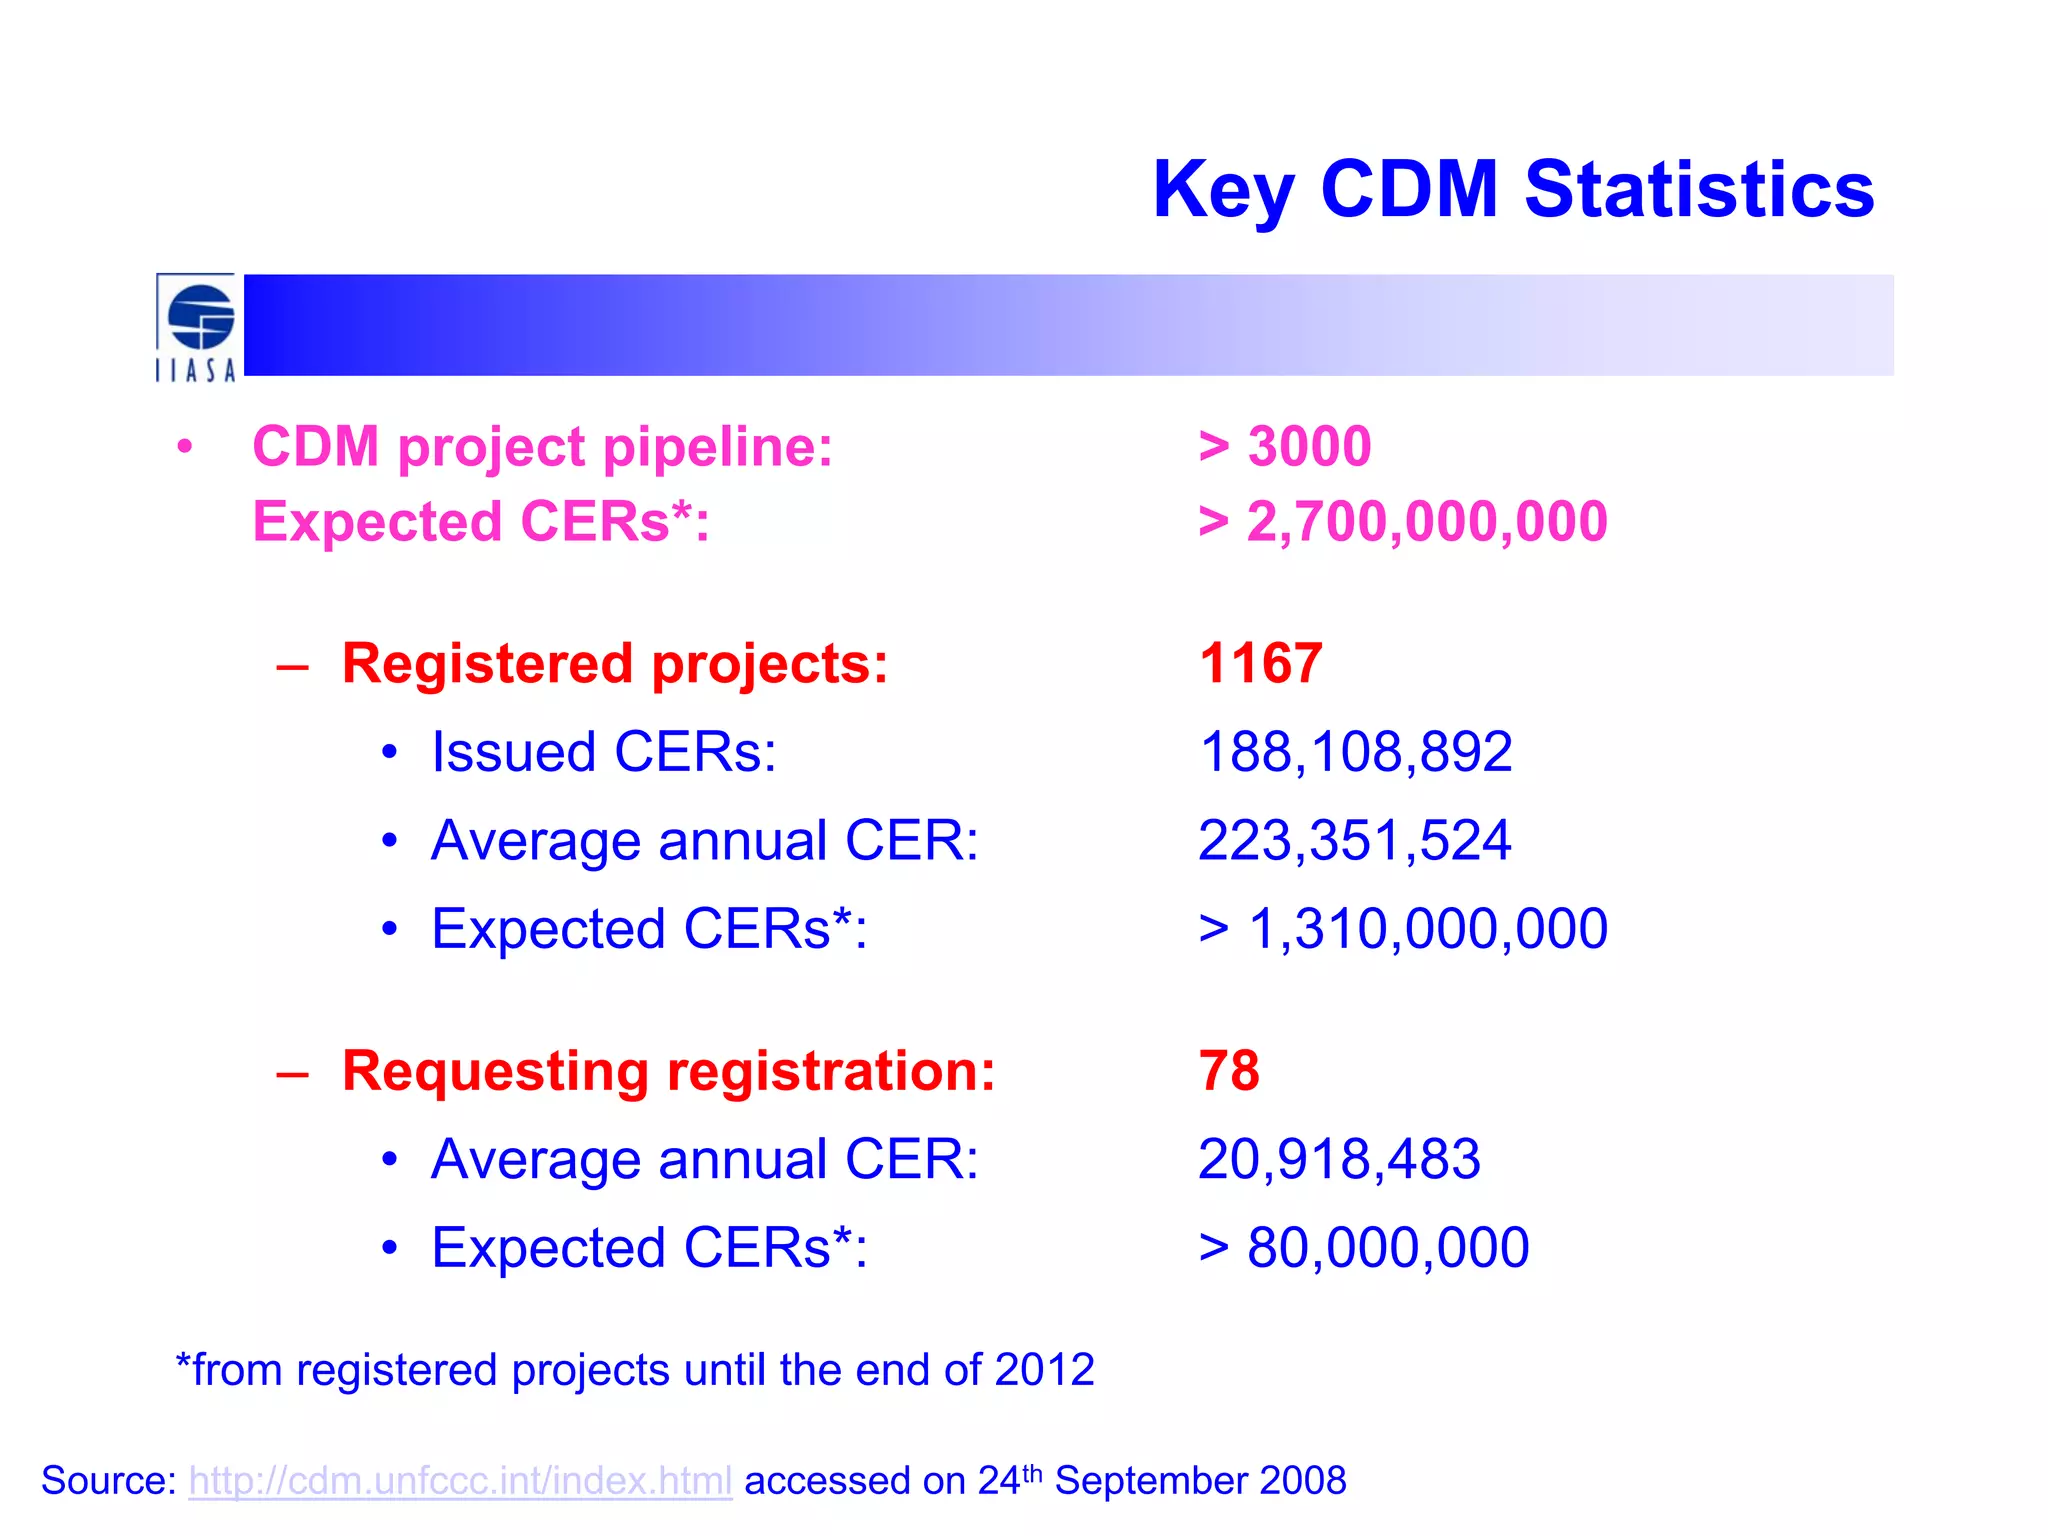
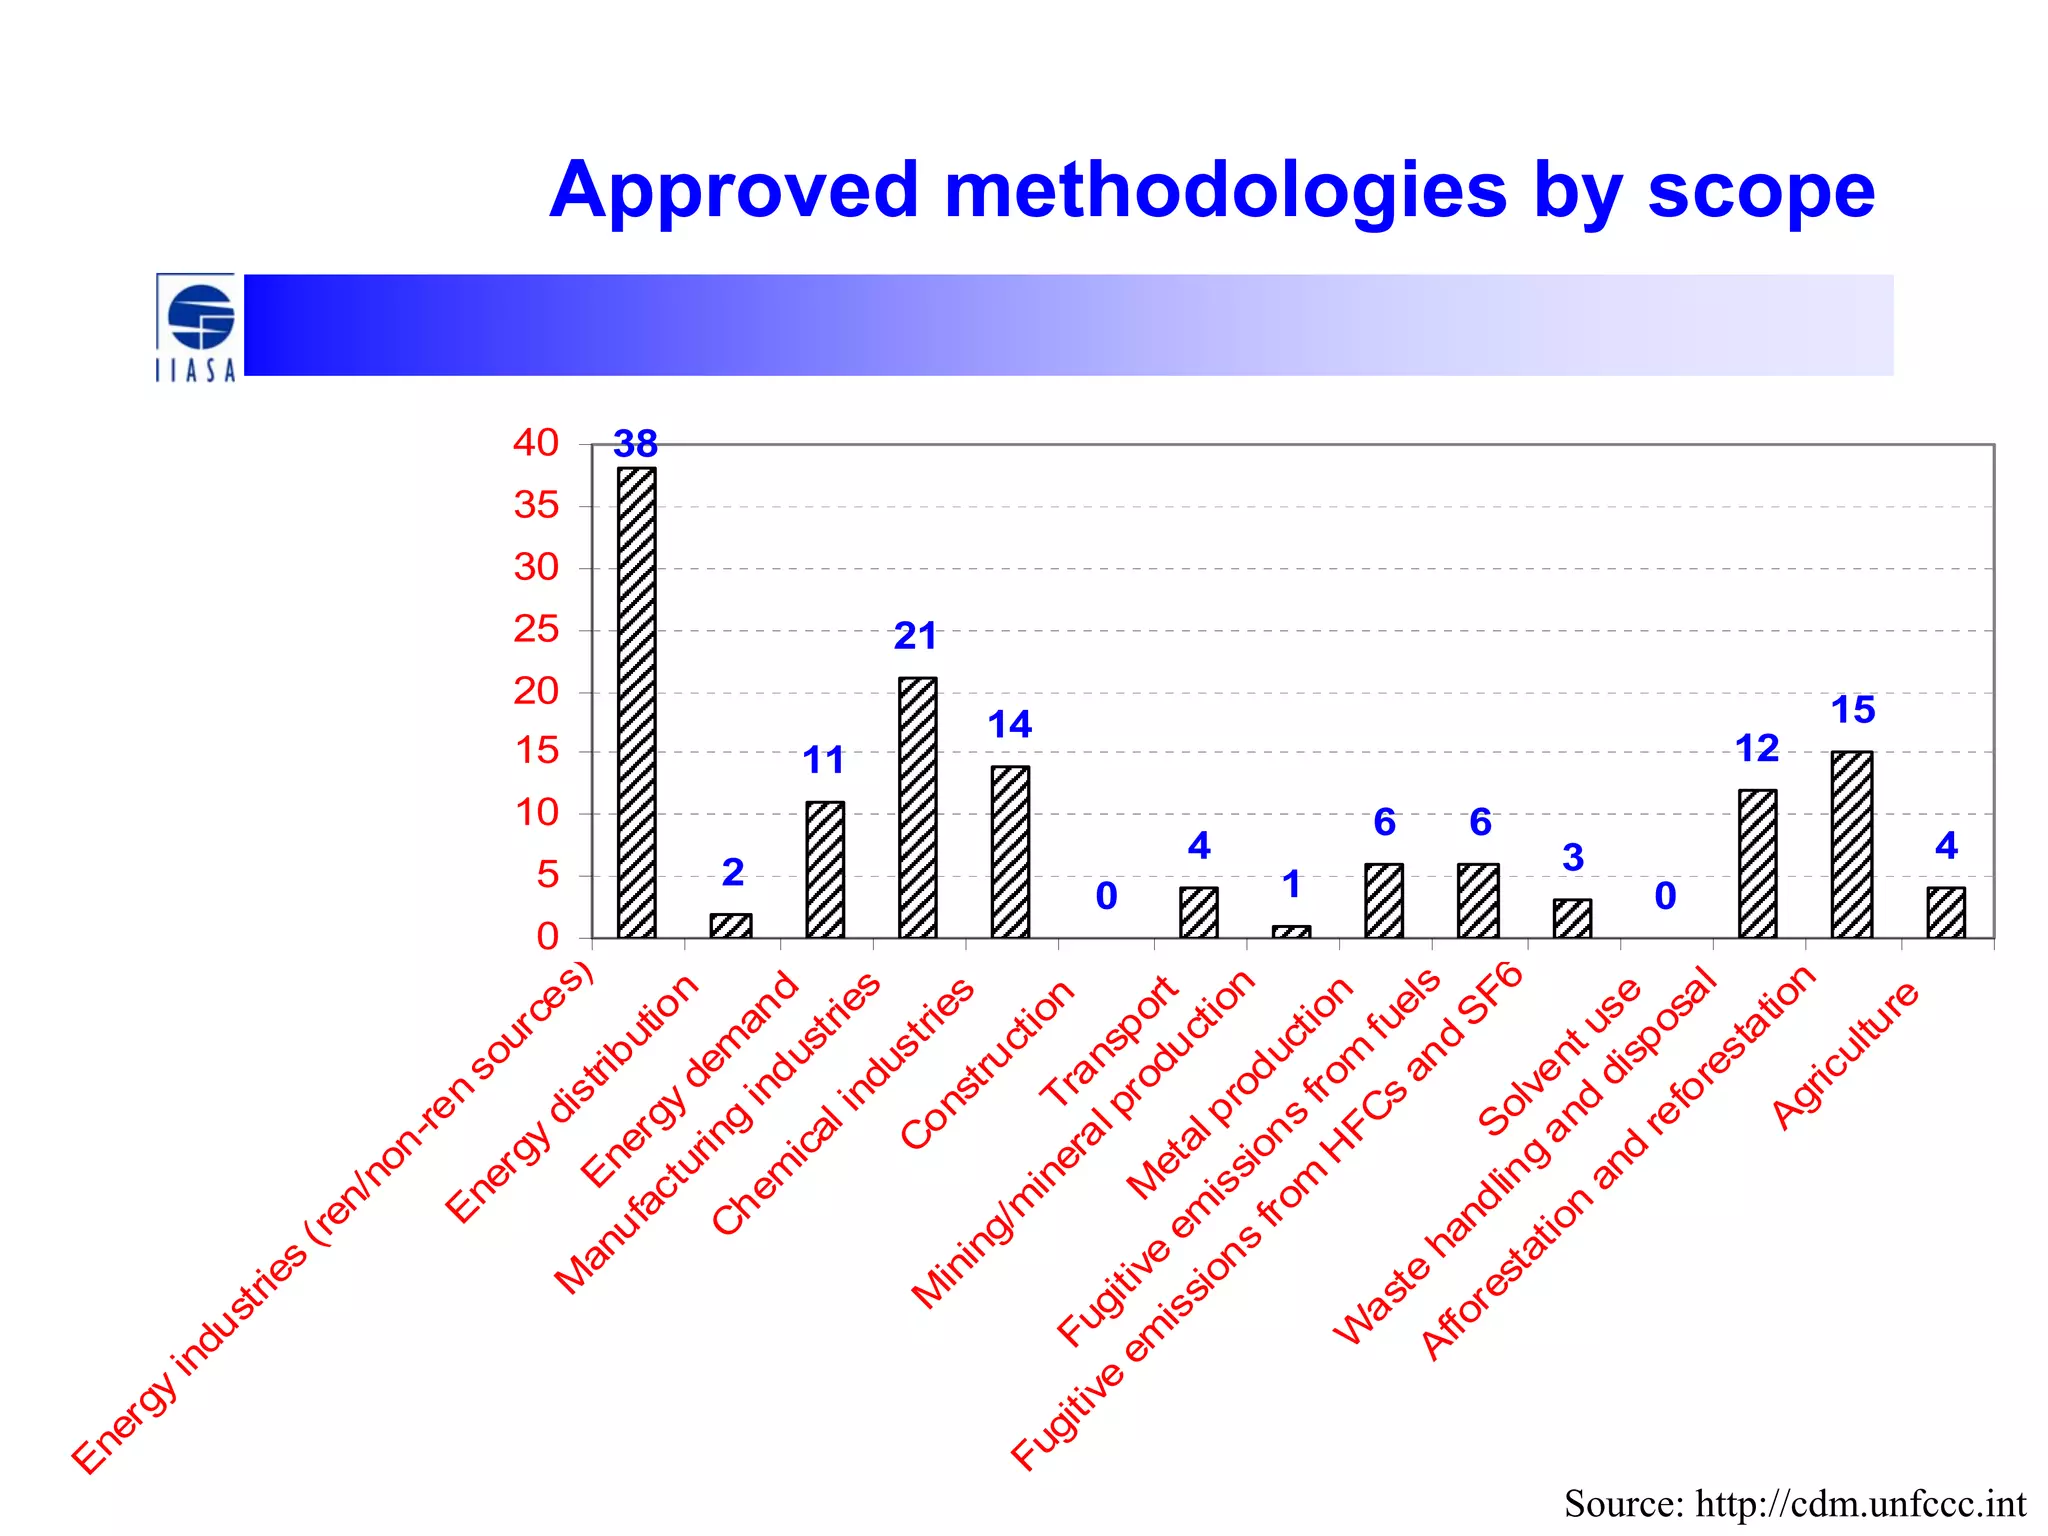
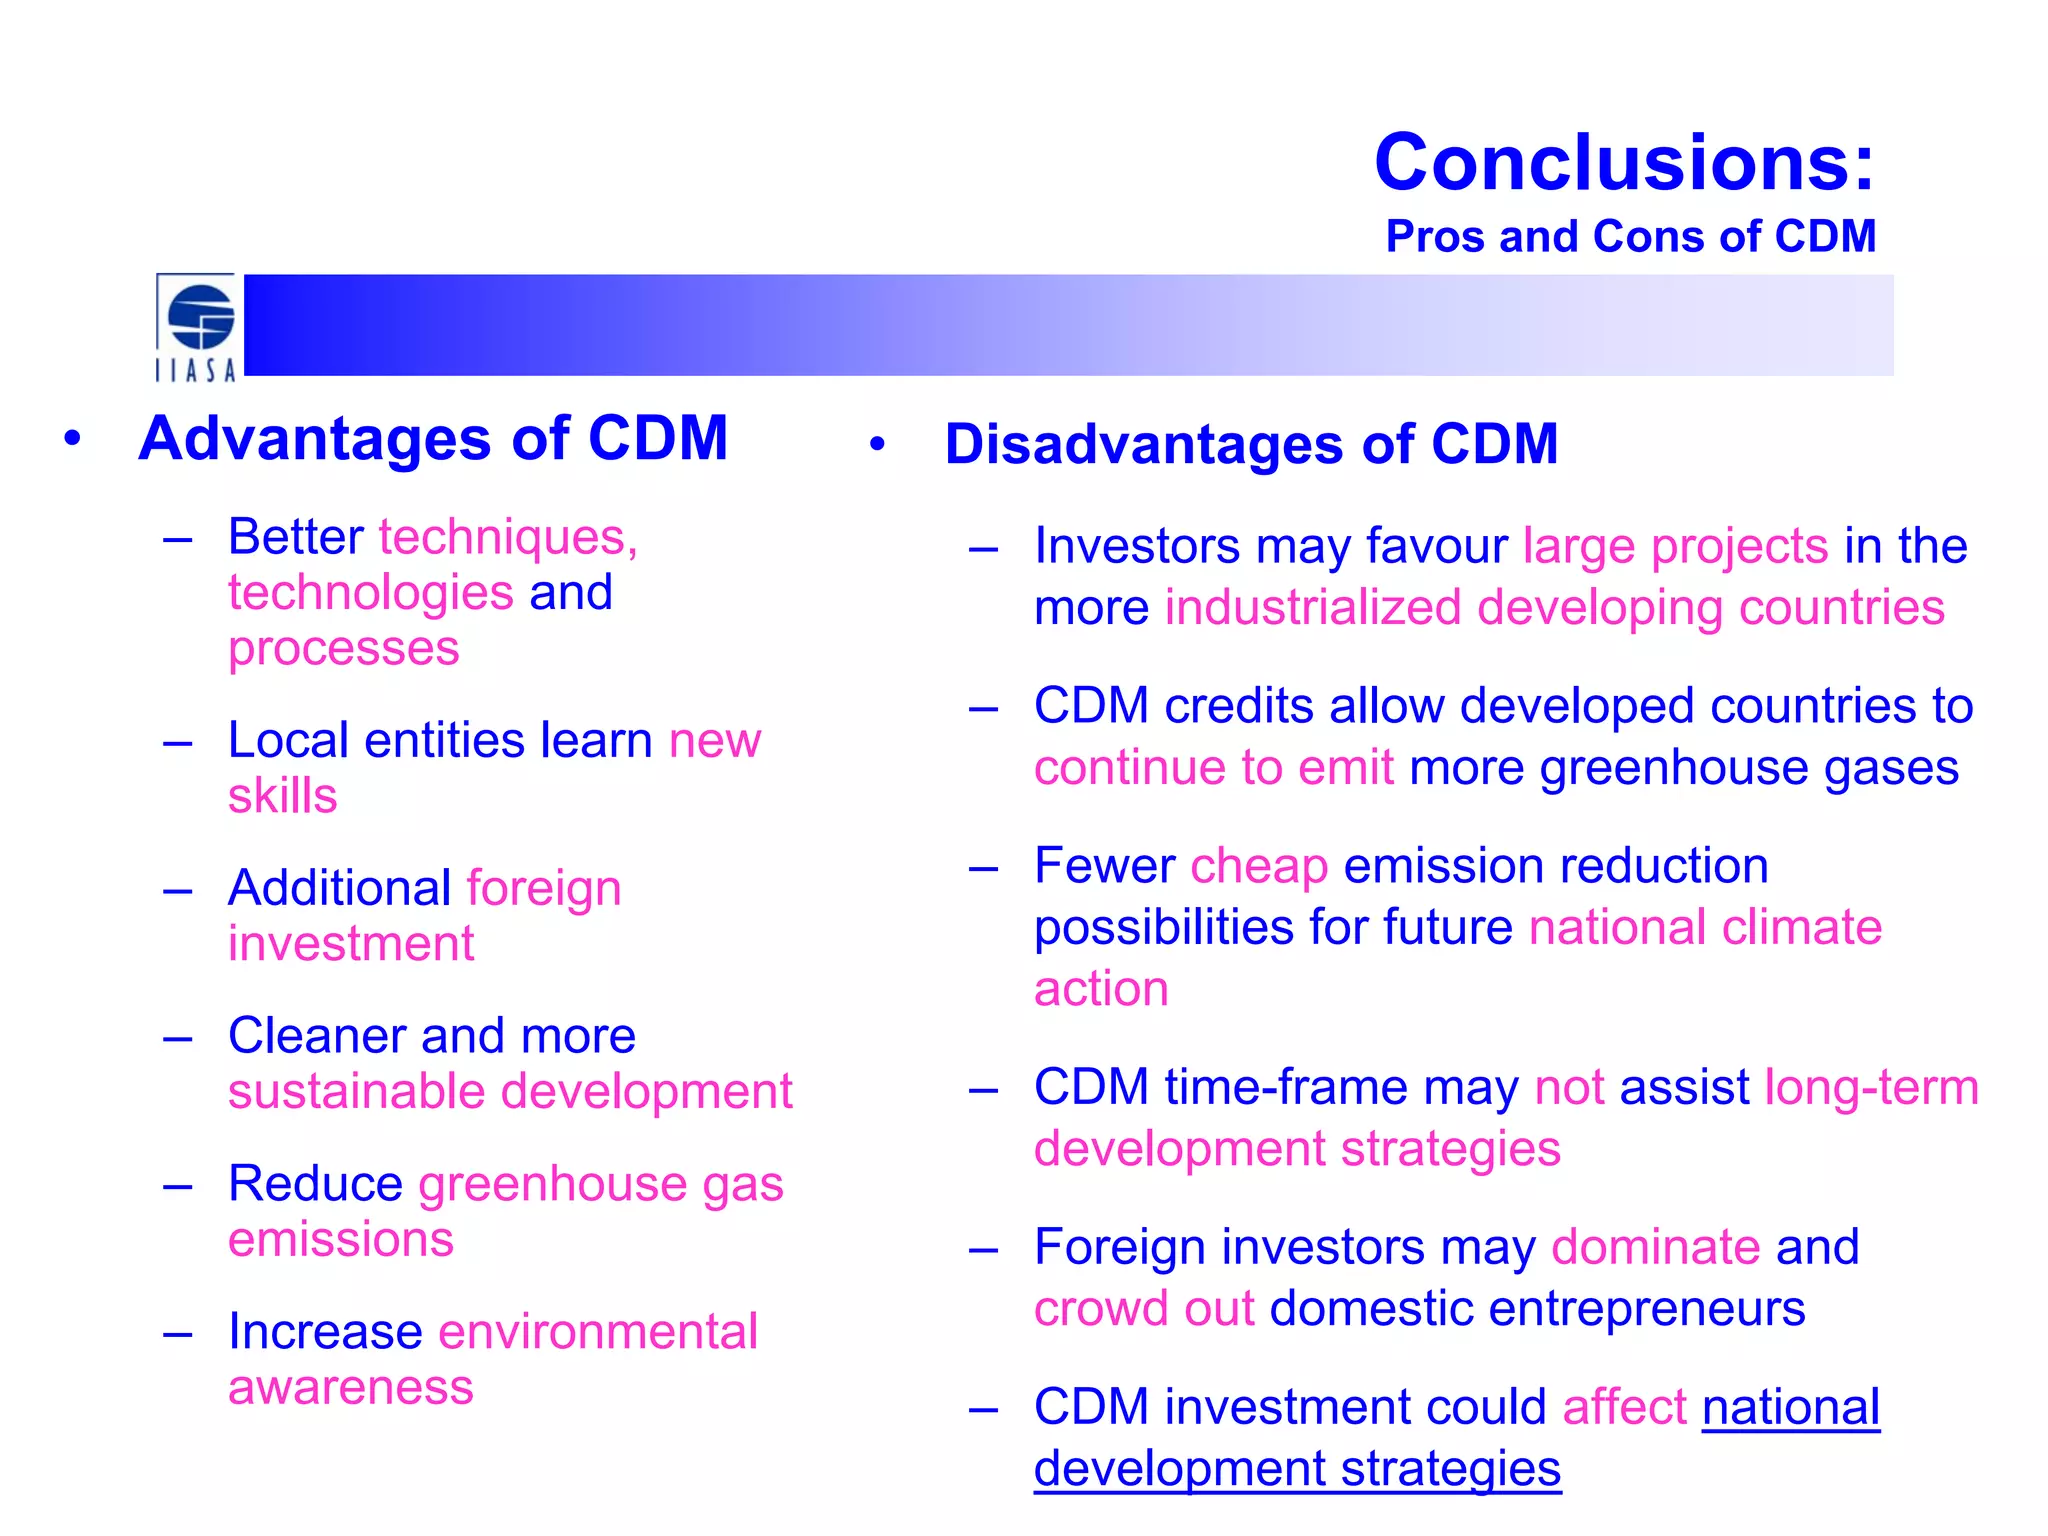
The Kyoto Protocol:
Flexibility Mechanisms
International Institute for Applied Systems Analysis (IIASA)
Pallav Purohit (APD)
GGI workshop on Flexibility Mechanisms under Kyoto Protocol
24th September 2008
Structure of presentation
• Background: The Kyoto Protocol
• Emissions Targets under Kyoto
• Flexibility Mechanisms
• Key CDM terms
• CDM Institutions and Administration
• CDM Project Cycle
• Statistics of the CDM Projects
• Conclusions
The Kyoto Protocol
• 1992 – UNFCCC was open for signature in Rio de Janeiro, Brazil
• 1997 - 3rd Conference of Parties meeting in Kyoto, Japan
• 2001 – Australia & United States will not ratify
• 2004 – Russia ratified Kyoto Protocol in November
• Protocol came into effect February 16, 2005
• GHGs defined by the Protocol are CO2, CH4, N2O, HFCs, PFCs, and
SF6.
• 181 countries have ratified the Protocol to date.
• 37 countries adopt limits on CO2 emissions.
Emissions target under Kyoto
Country Target (compared to base year)
EU-15, Bulgaria, Czech Republic, Estonia,
Latvia, Liechtenstein, Lithuania, Monaco,
Romania, Slovakia, Slovenia, Switzerland
- 8%
USA** - 7%
Canada, Hungary, Japan, Poland - 6%
Croatia - 5%
New Zealand, Russia, Ukraine 0%
Norway + 1%
Australia + 8%
Iceland +10%
**USA has not ratified the Kyoto Protocol
Flexibility Mechanisms of the Kyoto Protocol
Aim: to lower the overall costs of achieving emission
targets
Approach: access cost-effective opportunities to
reduce emissions or to remove carbon from the
atmosphere in other countries.
Motivation: while the cost of limiting emissions varies
considerably from region to region, the benefit for the
atmosphere is the same, wherever the action is
taken.
Flexibility Mechanisms of the Kyoto Protocol
Flexibility Mechanisms
Joint Implementation (JI)
<Article 6 of the Protocol>
Clean Development Mechanism (CDM)
<Article 12 of the Protocol>
International Emissions Trading
<Article 17 of the Protocol>
• Annex-I Parties would be able to achieve their emission
reduction targets cost-effectively, by using these
mechanisms.
Economic Logic of Tradable Permits
Cost/price per tonne
of carbon
Marginal cost of reduction
for the buyer
P
Permit price
P*
Q* Q
Avoided reductions:
permits brought
A
Marginal cost of reduction
for the seller
P′
P*
Q′ Q′*
Avoided reductions:
permits sold
B
Emission
reductions
Emission
reductions
Cost/price per tonne
of carbon
Joint Implementation
International Emissions Trading (IET)
• International Emissions Trading is to trade Kyoto
Protocol units including part of AAUs, CERs, ERUs
etc. between Annex-I Parties.
– The total amount of emission cap of Annex-I Parties
will not change.
– Only Annex-I Parties of the KP can participate in IET.
– Minimum trading unit is 1t-CO2 equivalent.
• Through market mechanism, IET can decrease total
cost of Annex-I Parties to achieve their collective
emission reduction targets.
Clean Development Mechanism
Key CDM terms - I
• Baseline
– Emissions level that
would have existed in the
business-as-usual
situation (in the absence
of the CDM project)
• Additionality
– A CDM project should be
motivated by the revenue
coming from the CER
sales. If it is already an
attractive business
without the CER benefit,
it is not additional
Year
CO2emissions
Project implemented
Reduced emissions
when credited: CERs
Business as usual:
baseline
Key CDM terms - II
• Crediting period
– Duration for which a CDM project can generate CERs. Either
10 years or three times 7 years
• Small-scale projects
– Projects of less than
• 15 MW for renewable energy
• 60 GWh annual savings for energy efficiency
• 60,000 t annual CO2 reductions for other types
• SSC projects benefit from
– simplified rules, especially pre-defined baseline methodologies
– lower fees
Additionality of SSC project activities
• Investment barrier
– a financially more viable alternative to the project activity would
have led to higher emissions
• Technological barrier
– a less technologically advanced alternative to the project
activity, that involves lower risks, and the activity would have
led to higher emissions
• Barrier due to prevailing practice
– prevailing practice would have led to implementation of a
technology with higher emissions
• Other barriers
– Institutional barriers, managerial resources, organizational
capacity, financial resources, capacity to absorb new
technologies, etc.
Transaction cost of CDM projects
• Pre-implementation costs
– Search costs
– Negotiation costs
– Baseline determination costs
– Approval costs
– Validation costs
– Review costs
– Registration costs
• Implementation costs
– Monitoring costs
– Verification costs
– Review costs
– Certification costs
– Enforcement costs
• Trading costs
– Transfer costs
– Registration costs
Project size, types & total transaction costs
Size Type Reduction
(t CO2 per yr)
Transaction
cost
(€/tCO2)
Very Large Large hydro, geothermal,
landfill methane
>200,000 0.1
Large Wind power, solar
thermal, energy efficiency
20,000 – 200,000 0.3 – 1
Small Boiler conversion, DSM,
small hydro
2000 – 20,000 10
Mini Energy efficiency in
housing, mini-hydro
200 – 2000 100
Micro PV < 200 1000
Source: Michaelowa et al. (2003)
CDM Institutions and Administration
• COP/MOP: overall authority
• CDM Executive Board (EB): supervising institution
• Designated Operational Entities (DOEs): legal
entities responsible for verification / validation
• Designated National Authority (DNA): official
government representatives for CDM
• Parties: Governmental bodies, Municipalities, Private
sector companies, NGOs, Financial institutions
CDM Project Cycle
Key CDM Statistics
• CDM project pipeline: > 3000
Expected CERs*: > 2,700,000,000
– Registered projects: 1167
• Issued CERs: 188,108,892
• Average annual CER: 223,351,524
• Expected CERs*: > 1,310,000,000
– Requesting registration: 78
• Average annual CER: 20,918,483
• Expected CERs*: > 80,000,000
*from registered projects until the end of 2012
Source: http://cdm.unfccc.int/index.html accessed on 24th September 2008
Distribution of registered project activities by scope
Source: http://cdm.unfccc.int
CERs issued in each sector
HFCs, PFCs & N2O
reduction
75%
Demand-side EE
0%
Fuel switch
1%
Renewables
12%
Afforestation &
Reforestation
0%
Transport
0%
Supply-side EE
4%
CH4 reduction &
Cement & Coal
mine/bed
8%
Source: http://cdm.unfccc.int
Approved methodologies by scope
38
2
11
21
14
0
4
1
6 6
3
0
12
15
4
0
5
10
15
20
25
30
35
40
E
nergy
industries
(ren/non-ren
sources)
E
nergy
distribution
E
nergy
dem
and
M
anufacturing
industries
C
hem
icalindustries
C
onstructionTransport
M
ining/m
ineralproduction
M
etalproduction
Fugitive
em
issions
from
fuels
Fugitive
em
issions
from
H
FC
s
and
S
F6S
olventuse
W
aste
handling
and
disposal
A
fforestation
and
reforestationA
griculture
Source: http://cdm.unfccc.int
Conclusions:
Pros and Cons of CDM
• Advantages of CDM
– Better techniques,
technologies and
processes
– Local entities learn new
skills
– Additional foreign
investment
– Cleaner and more
sustainable development
– Reduce greenhouse gas
emissions
– Increase environmental
awareness
• Disadvantages of CDM
– Investors may favour large projects in the
more industrialized developing countries
– CDM credits allow developed countries to
continue to emit more greenhouse gases
– Fewer cheap emission reduction
possibilities for future national climate
action
– CDM time-frame may not assist long-term
development strategies
– Foreign investors may dominate and
crowd out domestic entrepreneurs
– CDM investment could affect national
development strategies
• Thank you!
Further information:
purohit@iiasa.ac.at

Flexibility Instruments of the Kyoto Protocol

  • 1.
    The Kyoto Protocol: FlexibilityMechanisms International Institute for Applied Systems Analysis (IIASA) Pallav Purohit (APD) GGI workshop on Flexibility Mechanisms under Kyoto Protocol 24th September 2008
  • 2.
    Structure of presentation •Background: The Kyoto Protocol • Emissions Targets under Kyoto • Flexibility Mechanisms • Key CDM terms • CDM Institutions and Administration • CDM Project Cycle • Statistics of the CDM Projects • Conclusions
  • 3.
    The Kyoto Protocol •1992 – UNFCCC was open for signature in Rio de Janeiro, Brazil • 1997 - 3rd Conference of Parties meeting in Kyoto, Japan • 2001 – Australia & United States will not ratify • 2004 – Russia ratified Kyoto Protocol in November • Protocol came into effect February 16, 2005 • GHGs defined by the Protocol are CO2, CH4, N2O, HFCs, PFCs, and SF6. • 181 countries have ratified the Protocol to date. • 37 countries adopt limits on CO2 emissions.
  • 4.
    Emissions target underKyoto Country Target (compared to base year) EU-15, Bulgaria, Czech Republic, Estonia, Latvia, Liechtenstein, Lithuania, Monaco, Romania, Slovakia, Slovenia, Switzerland - 8% USA** - 7% Canada, Hungary, Japan, Poland - 6% Croatia - 5% New Zealand, Russia, Ukraine 0% Norway + 1% Australia + 8% Iceland +10% **USA has not ratified the Kyoto Protocol
  • 5.
    Flexibility Mechanisms ofthe Kyoto Protocol Aim: to lower the overall costs of achieving emission targets Approach: access cost-effective opportunities to reduce emissions or to remove carbon from the atmosphere in other countries. Motivation: while the cost of limiting emissions varies considerably from region to region, the benefit for the atmosphere is the same, wherever the action is taken.
  • 6.
    Flexibility Mechanisms ofthe Kyoto Protocol Flexibility Mechanisms Joint Implementation (JI) <Article 6 of the Protocol> Clean Development Mechanism (CDM) <Article 12 of the Protocol> International Emissions Trading <Article 17 of the Protocol> • Annex-I Parties would be able to achieve their emission reduction targets cost-effectively, by using these mechanisms.
  • 7.
    Economic Logic ofTradable Permits Cost/price per tonne of carbon Marginal cost of reduction for the buyer P Permit price P* Q* Q Avoided reductions: permits brought A Marginal cost of reduction for the seller P′ P* Q′ Q′* Avoided reductions: permits sold B Emission reductions Emission reductions Cost/price per tonne of carbon
  • 8.
  • 9.
    International Emissions Trading(IET) • International Emissions Trading is to trade Kyoto Protocol units including part of AAUs, CERs, ERUs etc. between Annex-I Parties. – The total amount of emission cap of Annex-I Parties will not change. – Only Annex-I Parties of the KP can participate in IET. – Minimum trading unit is 1t-CO2 equivalent. • Through market mechanism, IET can decrease total cost of Annex-I Parties to achieve their collective emission reduction targets.
  • 10.
  • 11.
    Key CDM terms- I • Baseline – Emissions level that would have existed in the business-as-usual situation (in the absence of the CDM project) • Additionality – A CDM project should be motivated by the revenue coming from the CER sales. If it is already an attractive business without the CER benefit, it is not additional Year CO2emissions Project implemented Reduced emissions when credited: CERs Business as usual: baseline
  • 12.
    Key CDM terms- II • Crediting period – Duration for which a CDM project can generate CERs. Either 10 years or three times 7 years • Small-scale projects – Projects of less than • 15 MW for renewable energy • 60 GWh annual savings for energy efficiency • 60,000 t annual CO2 reductions for other types • SSC projects benefit from – simplified rules, especially pre-defined baseline methodologies – lower fees
  • 13.
    Additionality of SSCproject activities • Investment barrier – a financially more viable alternative to the project activity would have led to higher emissions • Technological barrier – a less technologically advanced alternative to the project activity, that involves lower risks, and the activity would have led to higher emissions • Barrier due to prevailing practice – prevailing practice would have led to implementation of a technology with higher emissions • Other barriers – Institutional barriers, managerial resources, organizational capacity, financial resources, capacity to absorb new technologies, etc.
  • 14.
    Transaction cost ofCDM projects • Pre-implementation costs – Search costs – Negotiation costs – Baseline determination costs – Approval costs – Validation costs – Review costs – Registration costs • Implementation costs – Monitoring costs – Verification costs – Review costs – Certification costs – Enforcement costs • Trading costs – Transfer costs – Registration costs
  • 15.
    Project size, types& total transaction costs Size Type Reduction (t CO2 per yr) Transaction cost (€/tCO2) Very Large Large hydro, geothermal, landfill methane >200,000 0.1 Large Wind power, solar thermal, energy efficiency 20,000 – 200,000 0.3 – 1 Small Boiler conversion, DSM, small hydro 2000 – 20,000 10 Mini Energy efficiency in housing, mini-hydro 200 – 2000 100 Micro PV < 200 1000 Source: Michaelowa et al. (2003)
  • 16.
    CDM Institutions andAdministration • COP/MOP: overall authority • CDM Executive Board (EB): supervising institution • Designated Operational Entities (DOEs): legal entities responsible for verification / validation • Designated National Authority (DNA): official government representatives for CDM • Parties: Governmental bodies, Municipalities, Private sector companies, NGOs, Financial institutions
  • 17.
  • 18.
    Key CDM Statistics •CDM project pipeline: > 3000 Expected CERs*: > 2,700,000,000 – Registered projects: 1167 • Issued CERs: 188,108,892 • Average annual CER: 223,351,524 • Expected CERs*: > 1,310,000,000 – Requesting registration: 78 • Average annual CER: 20,918,483 • Expected CERs*: > 80,000,000 *from registered projects until the end of 2012 Source: http://cdm.unfccc.int/index.html accessed on 24th September 2008
  • 19.
    Distribution of registeredproject activities by scope Source: http://cdm.unfccc.int
  • 20.
    CERs issued ineach sector HFCs, PFCs & N2O reduction 75% Demand-side EE 0% Fuel switch 1% Renewables 12% Afforestation & Reforestation 0% Transport 0% Supply-side EE 4% CH4 reduction & Cement & Coal mine/bed 8% Source: http://cdm.unfccc.int
  • 21.
    Approved methodologies byscope 38 2 11 21 14 0 4 1 6 6 3 0 12 15 4 0 5 10 15 20 25 30 35 40 E nergy industries (ren/non-ren sources) E nergy distribution E nergy dem and M anufacturing industries C hem icalindustries C onstructionTransport M ining/m ineralproduction M etalproduction Fugitive em issions from fuels Fugitive em issions from H FC s and S F6S olventuse W aste handling and disposal A fforestation and reforestationA griculture Source: http://cdm.unfccc.int
  • 22.
    Conclusions: Pros and Consof CDM • Advantages of CDM – Better techniques, technologies and processes – Local entities learn new skills – Additional foreign investment – Cleaner and more sustainable development – Reduce greenhouse gas emissions – Increase environmental awareness • Disadvantages of CDM – Investors may favour large projects in the more industrialized developing countries – CDM credits allow developed countries to continue to emit more greenhouse gases – Fewer cheap emission reduction possibilities for future national climate action – CDM time-frame may not assist long-term development strategies – Foreign investors may dominate and crowd out domestic entrepreneurs – CDM investment could affect national development strategies
  • 23.
    • Thank you! Furtherinformation: purohit@iiasa.ac.at