Downloaded 190 times


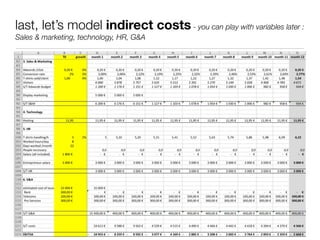
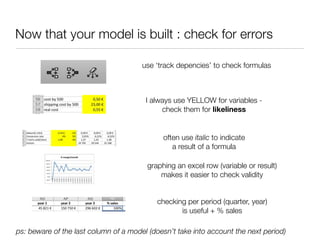
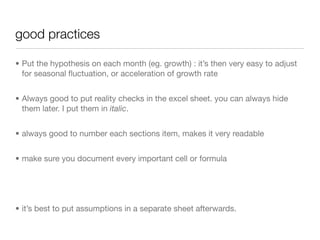


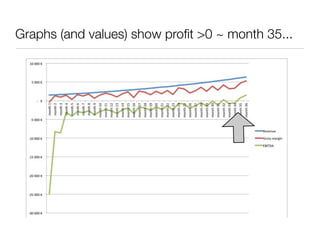

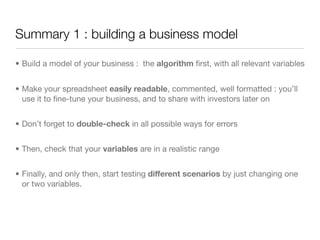


The document outlines essential components of business models, focusing on revenue generation, costs, and profits for startups, with a sample t-shirt business model. It emphasizes the importance of understanding key performance indicators (KPIs), calculating margins, and the distinctions between volume and price-based strategies to ensure financial viability. Additionally, it highlights best practices for creating and validating financial models, alongside crucial insights for building a sustainable business model.