Download to read offline

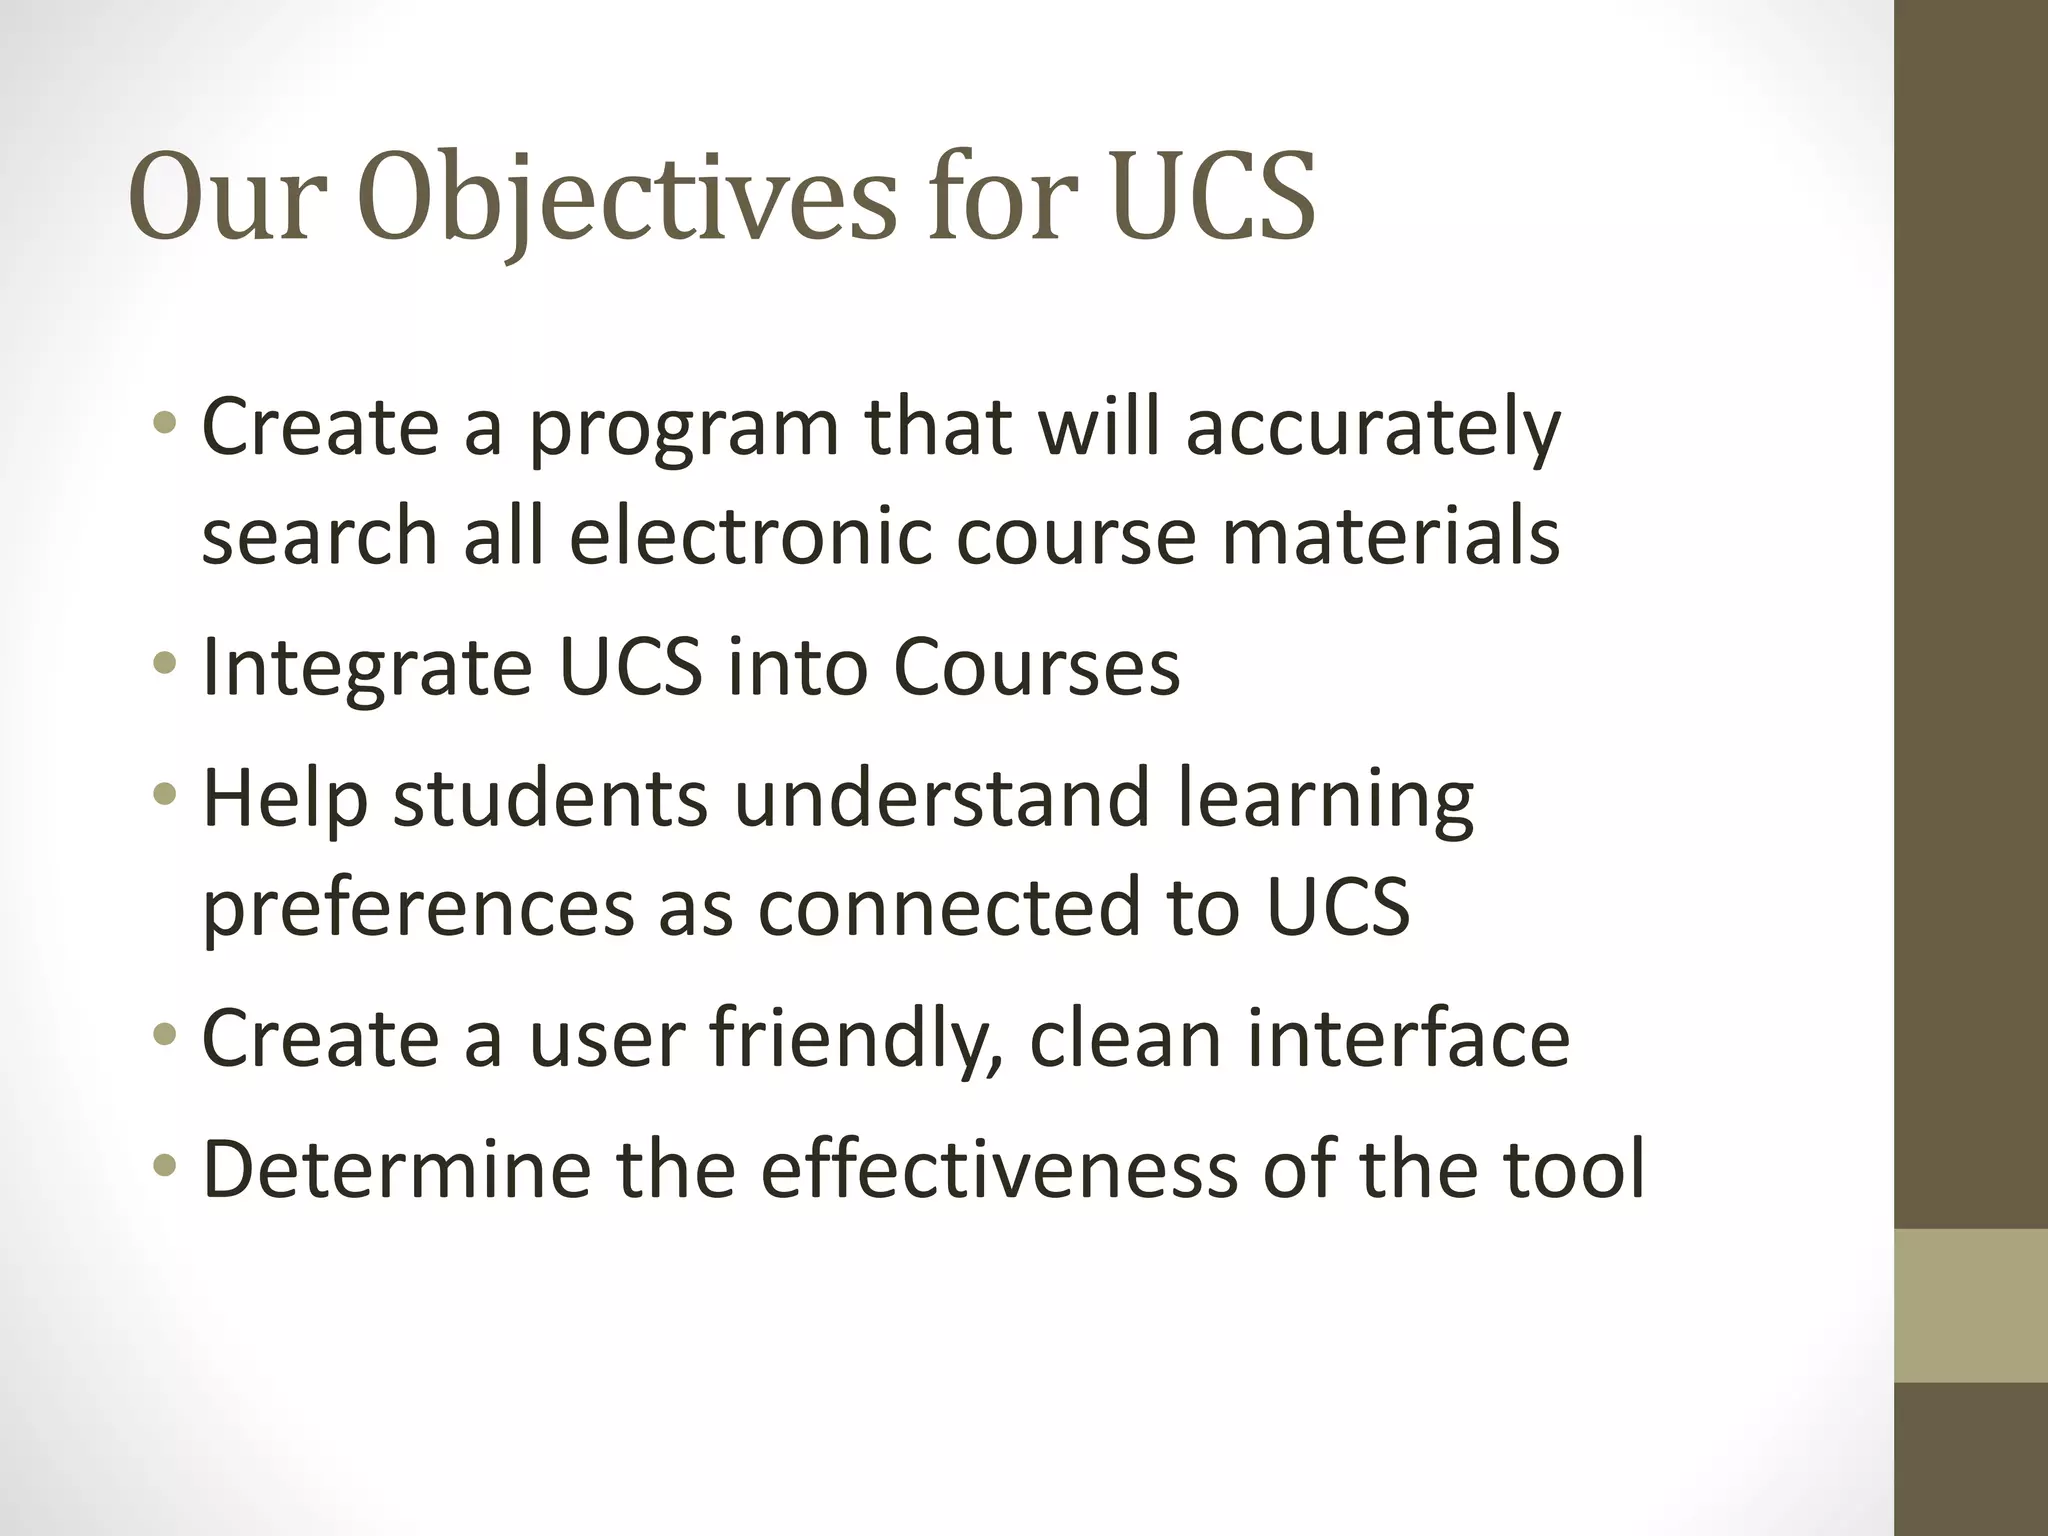
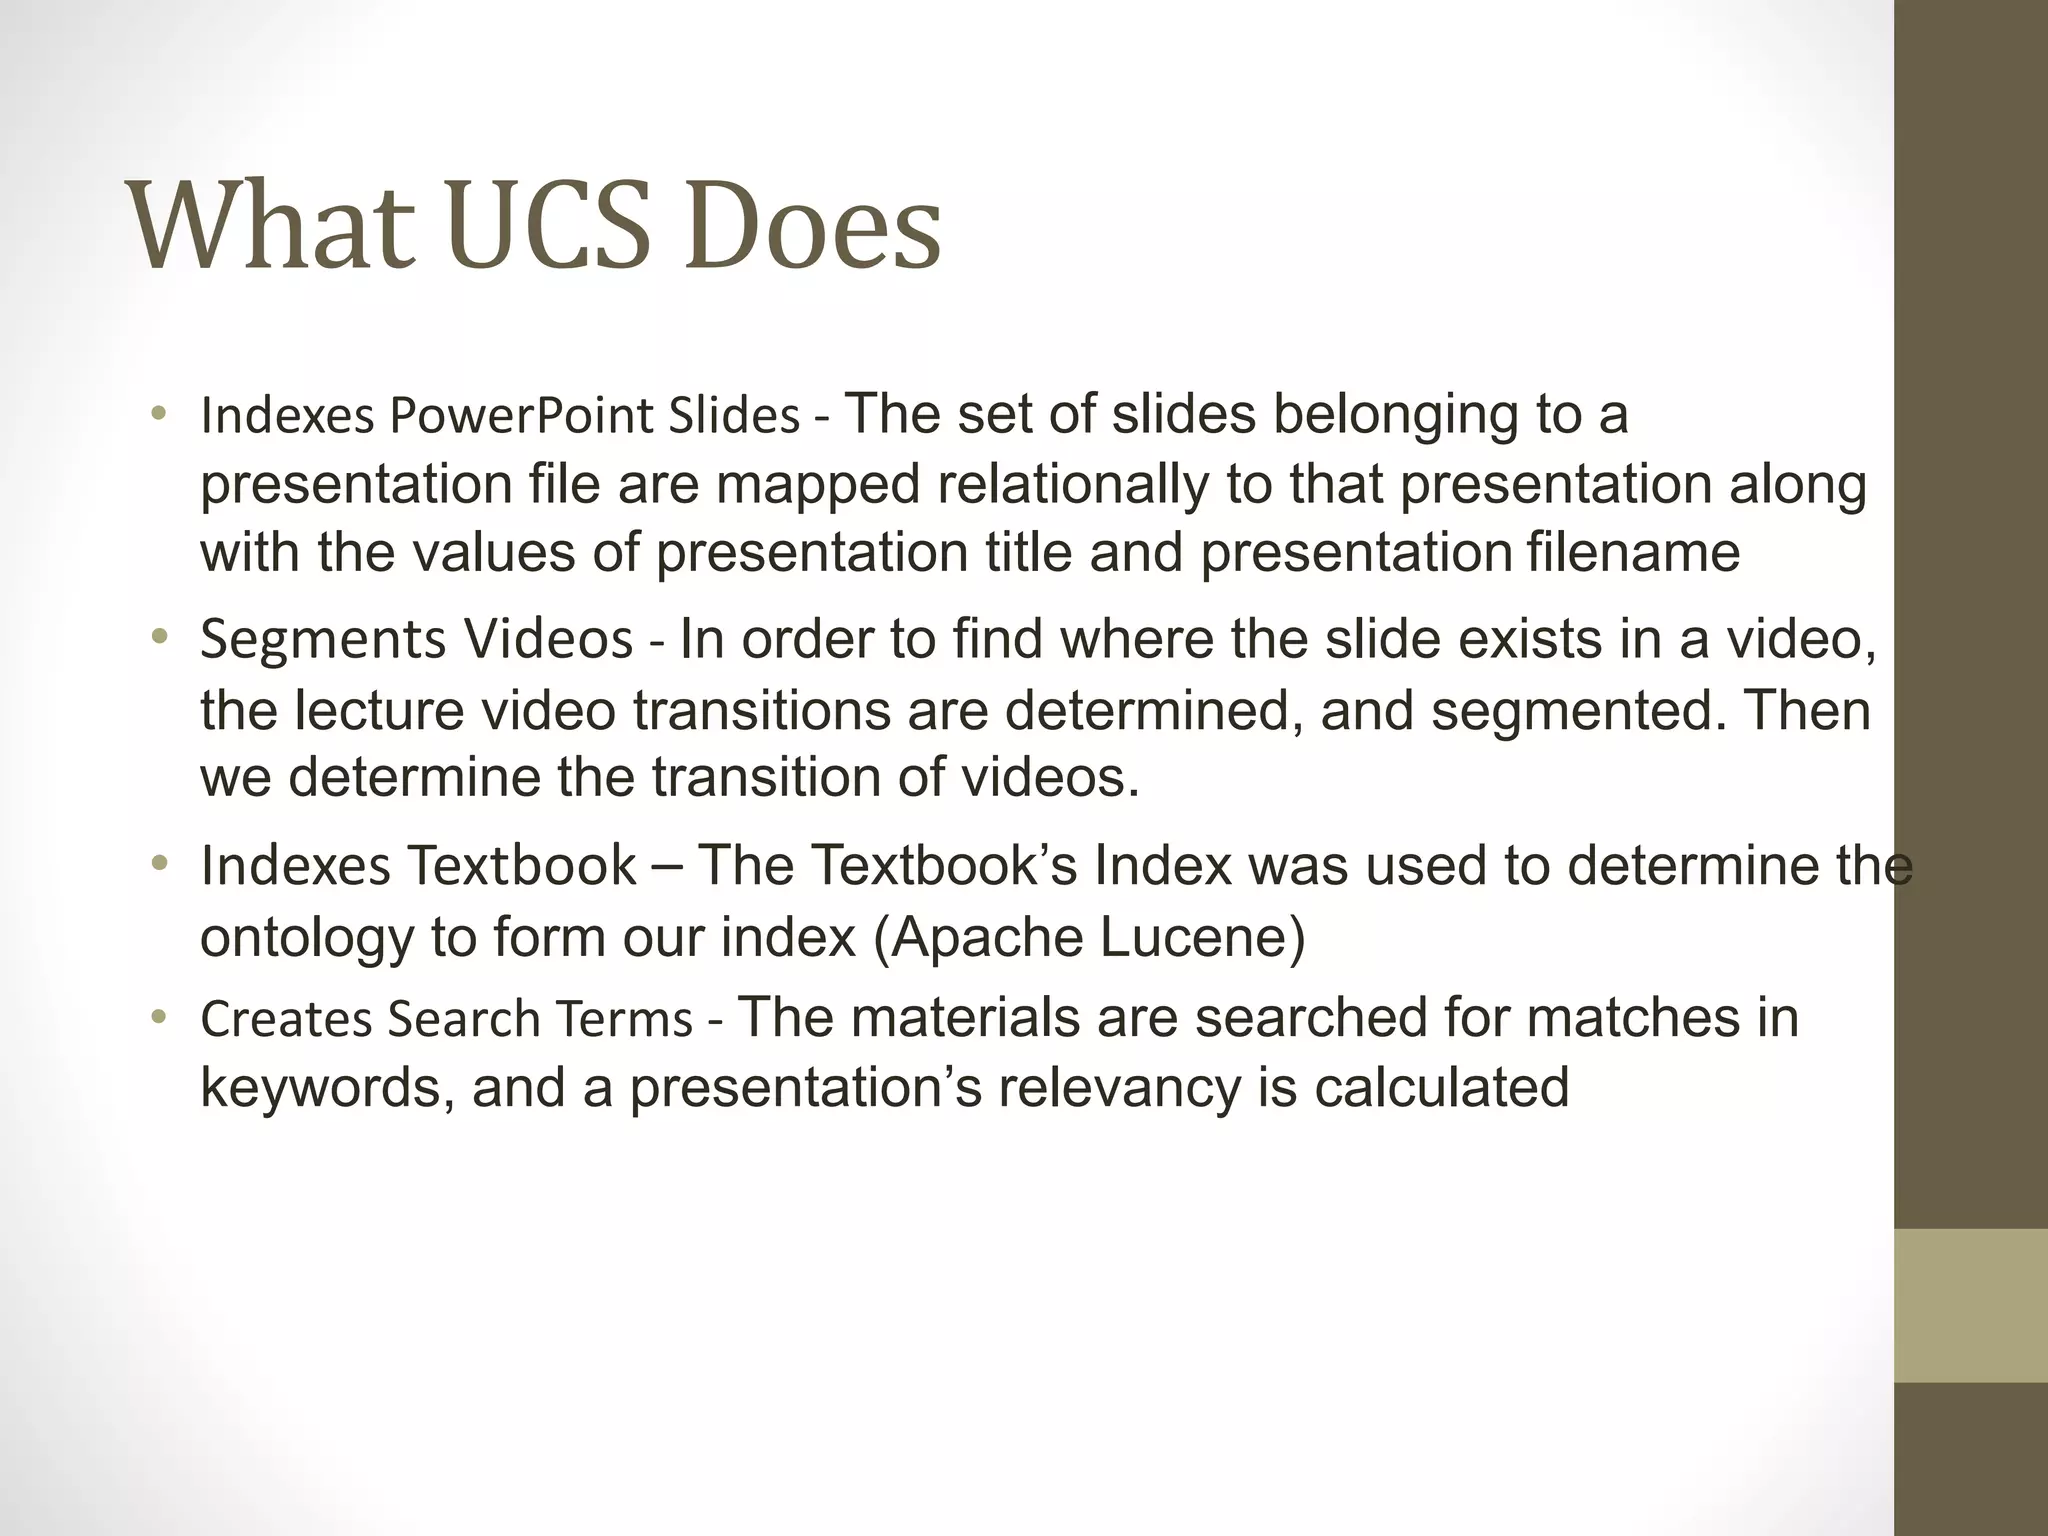
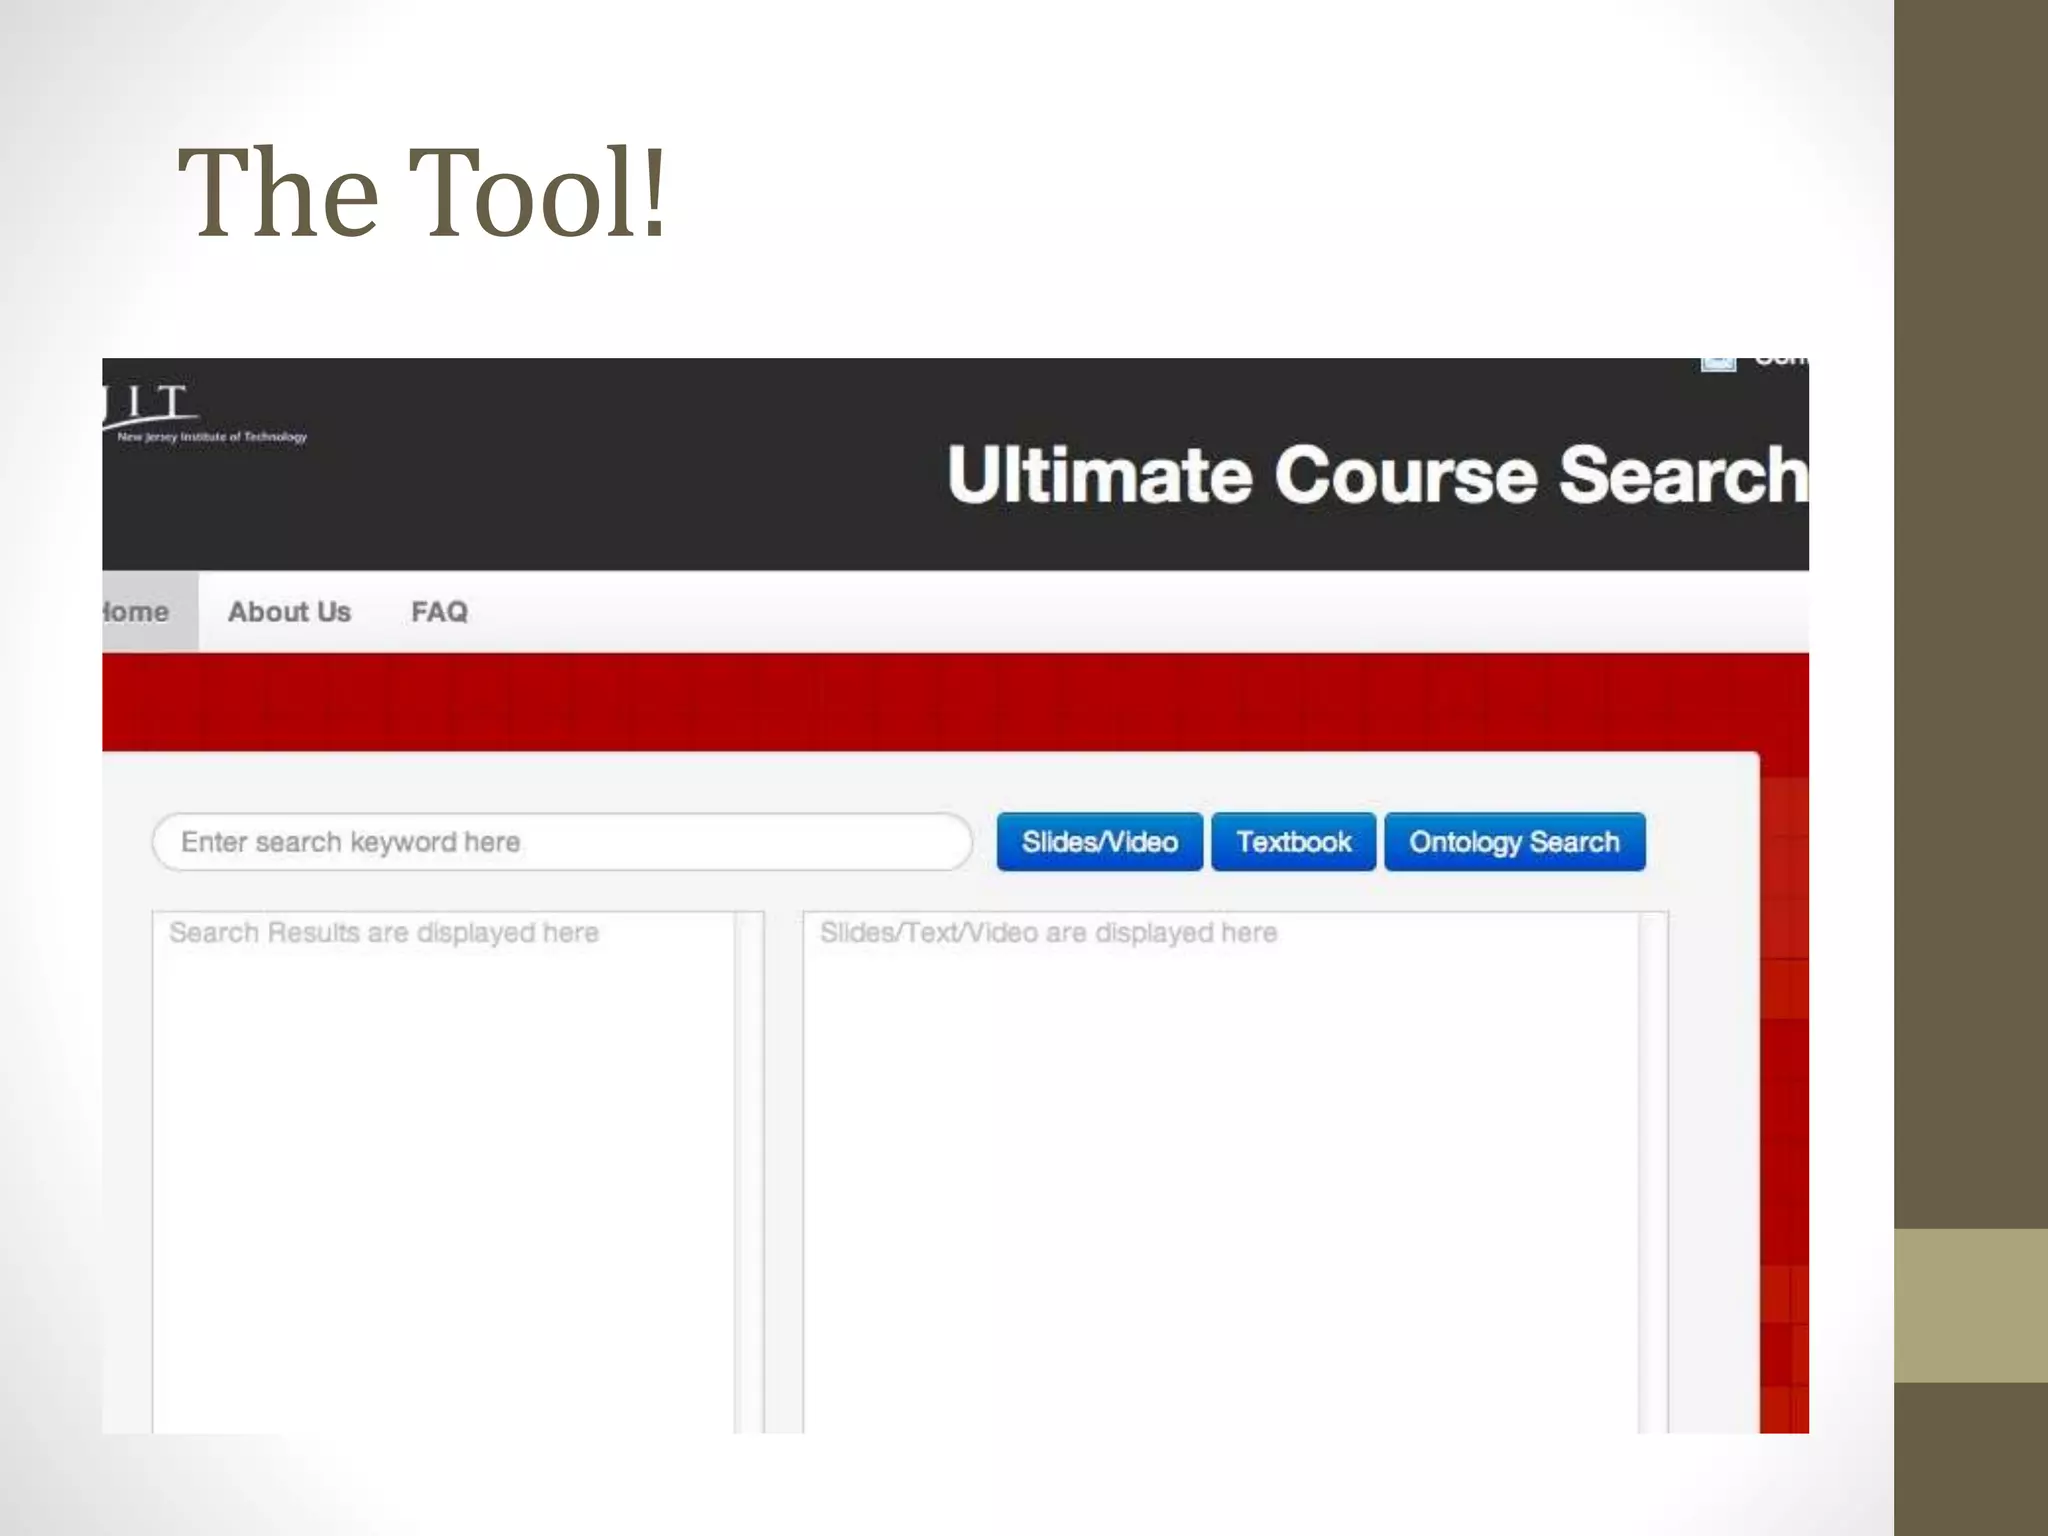
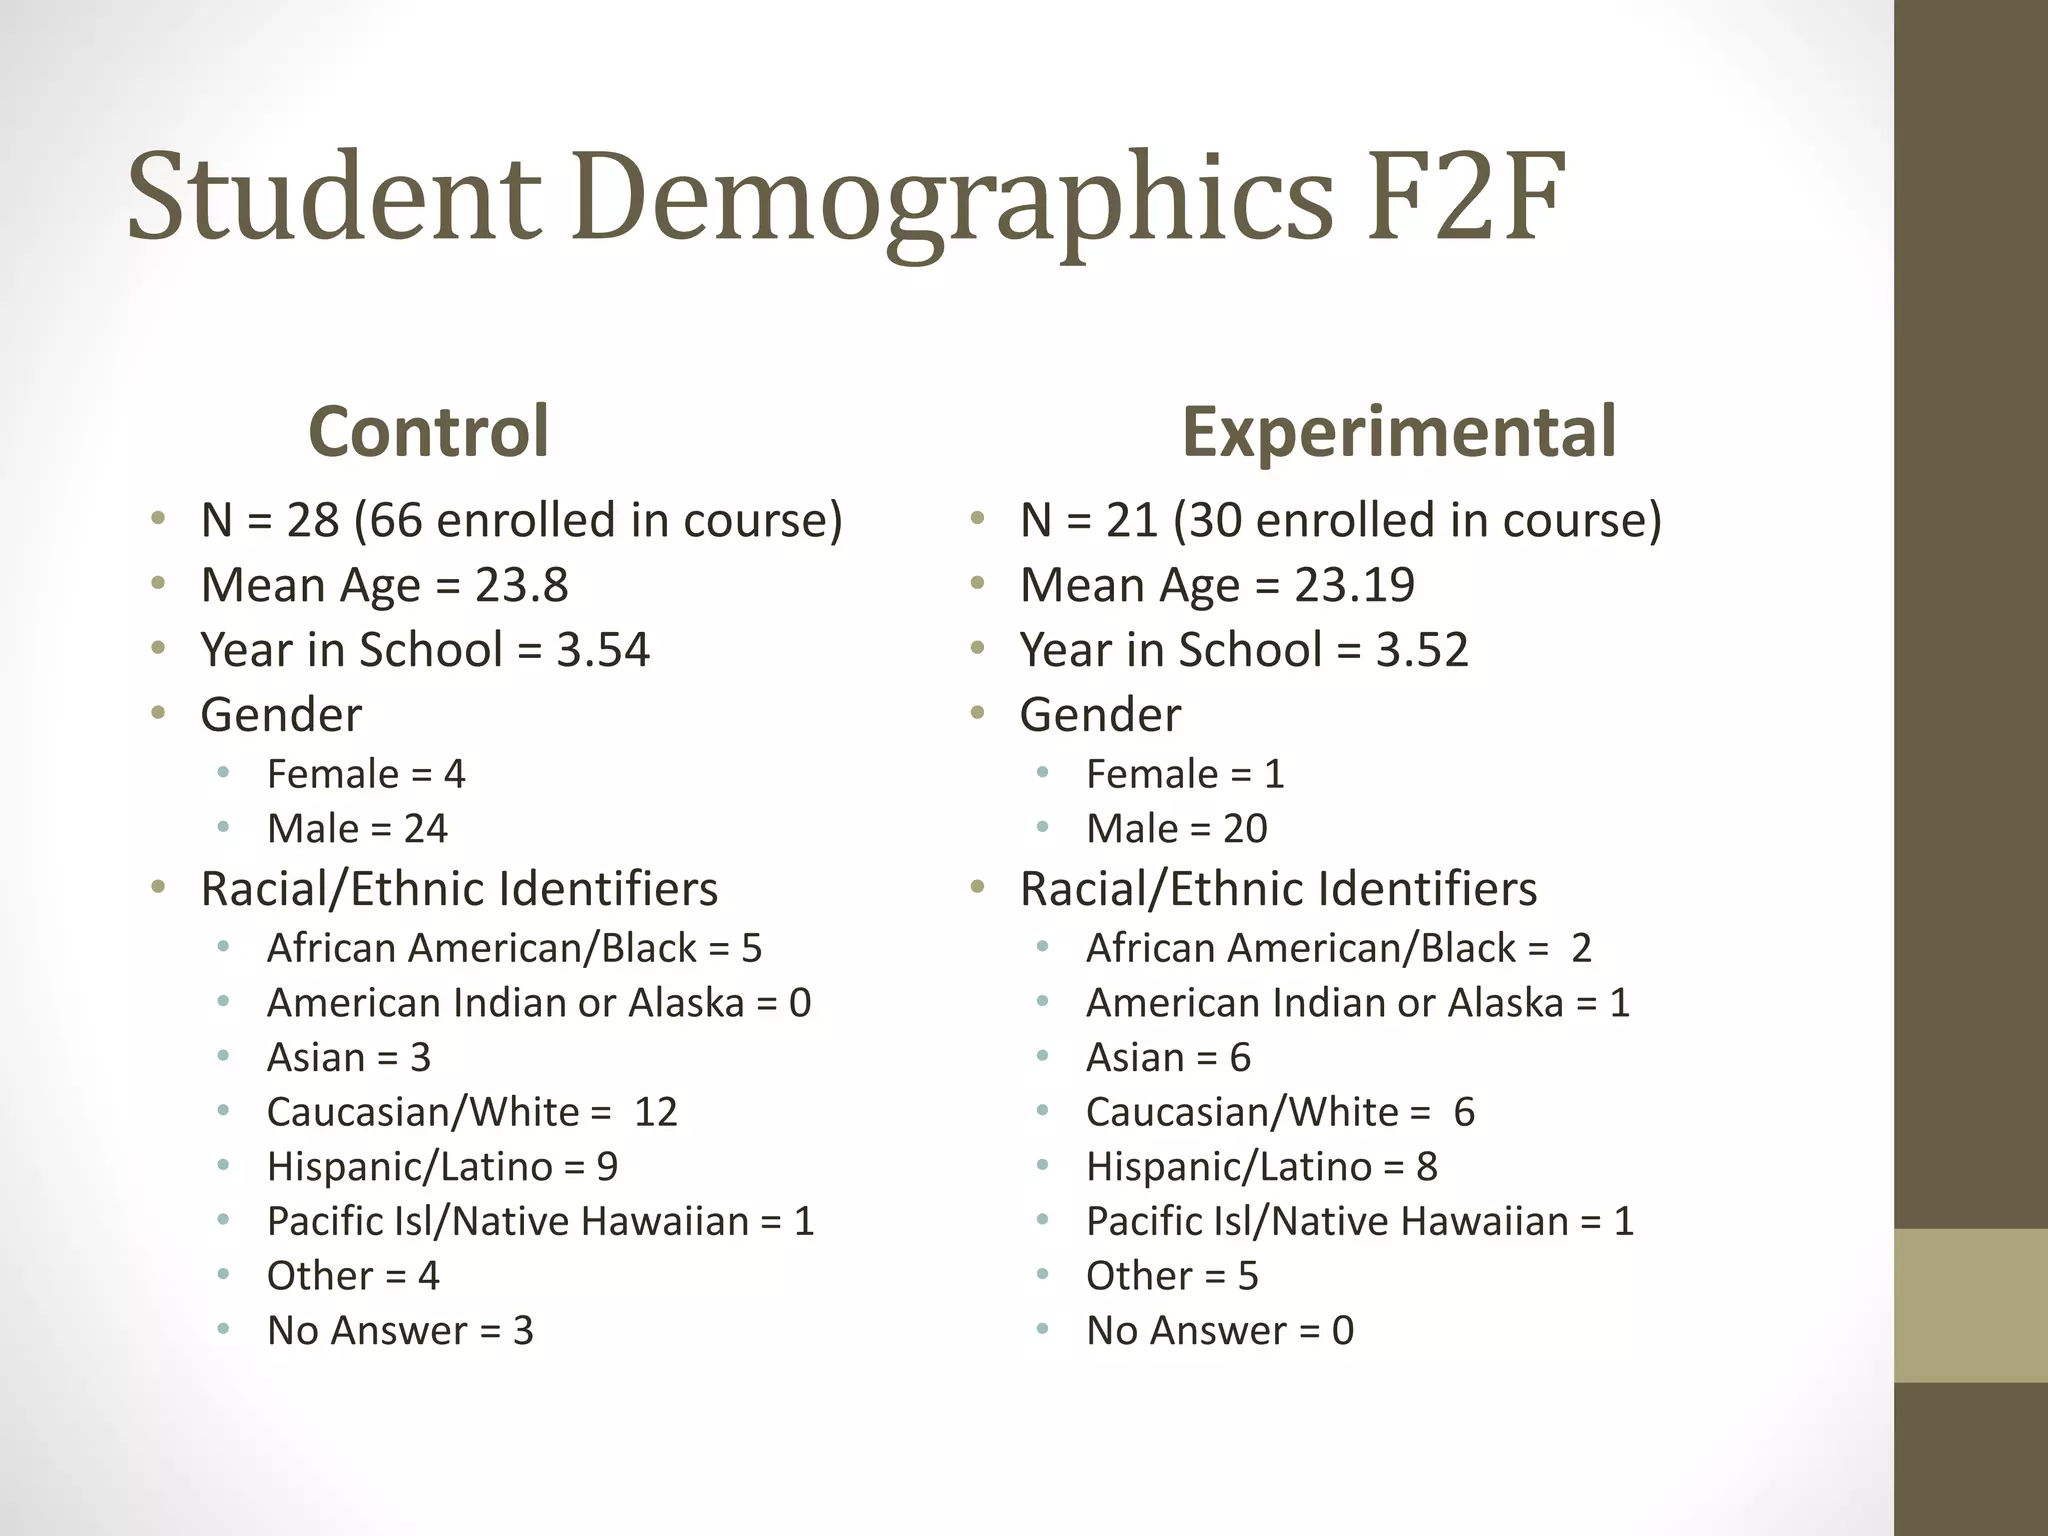
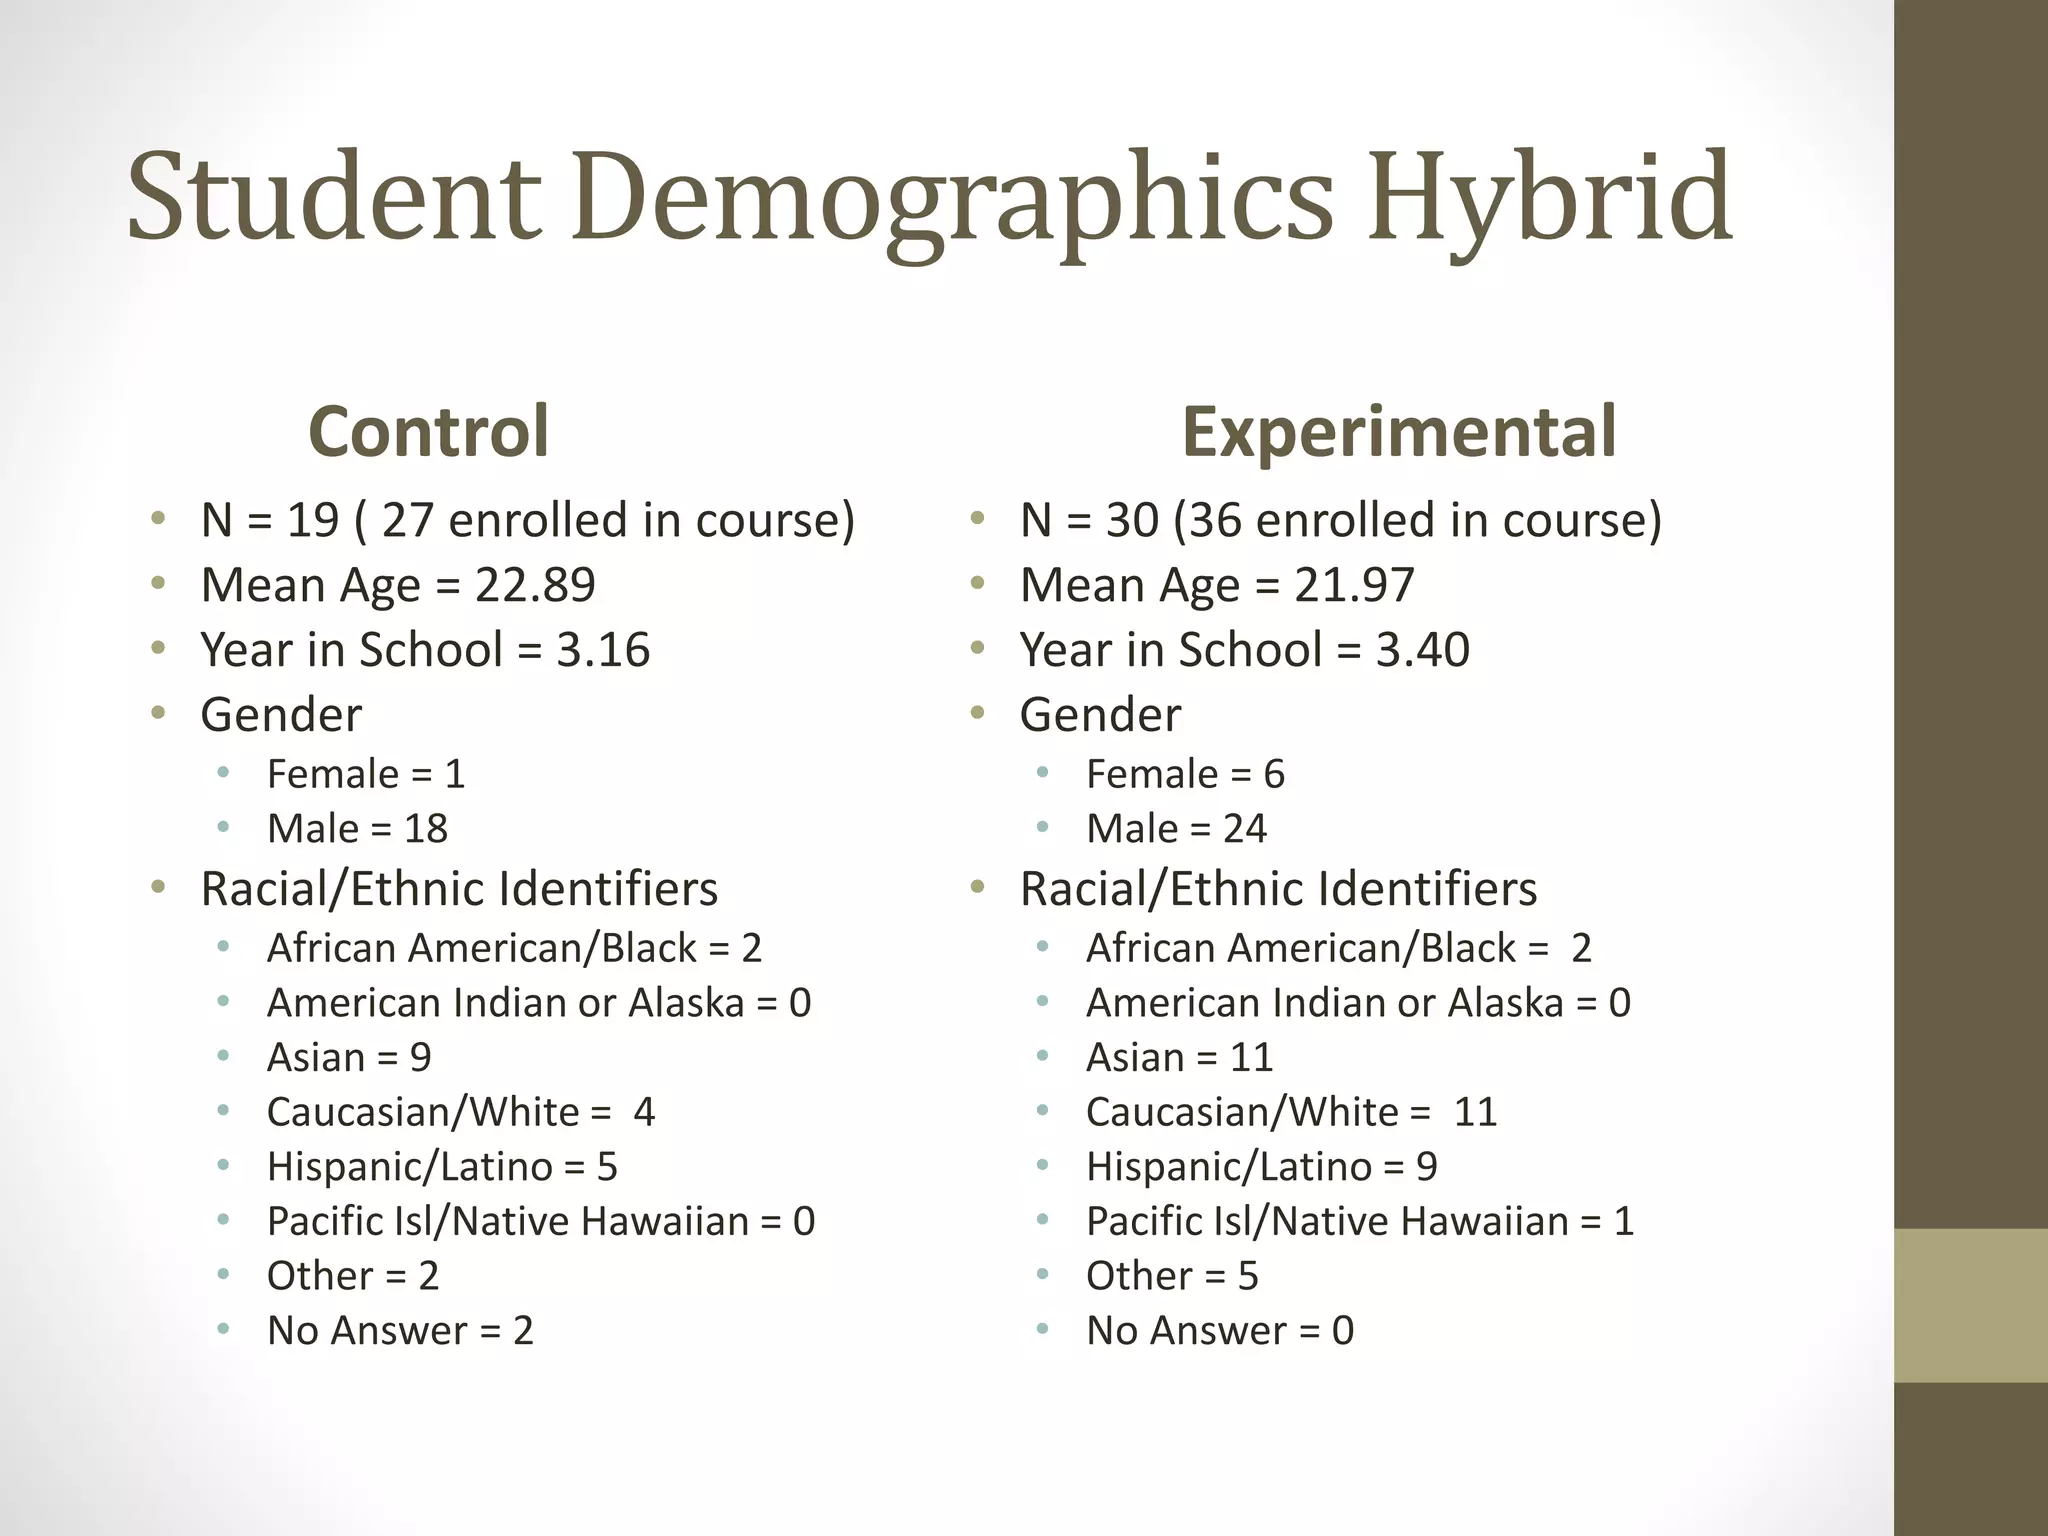
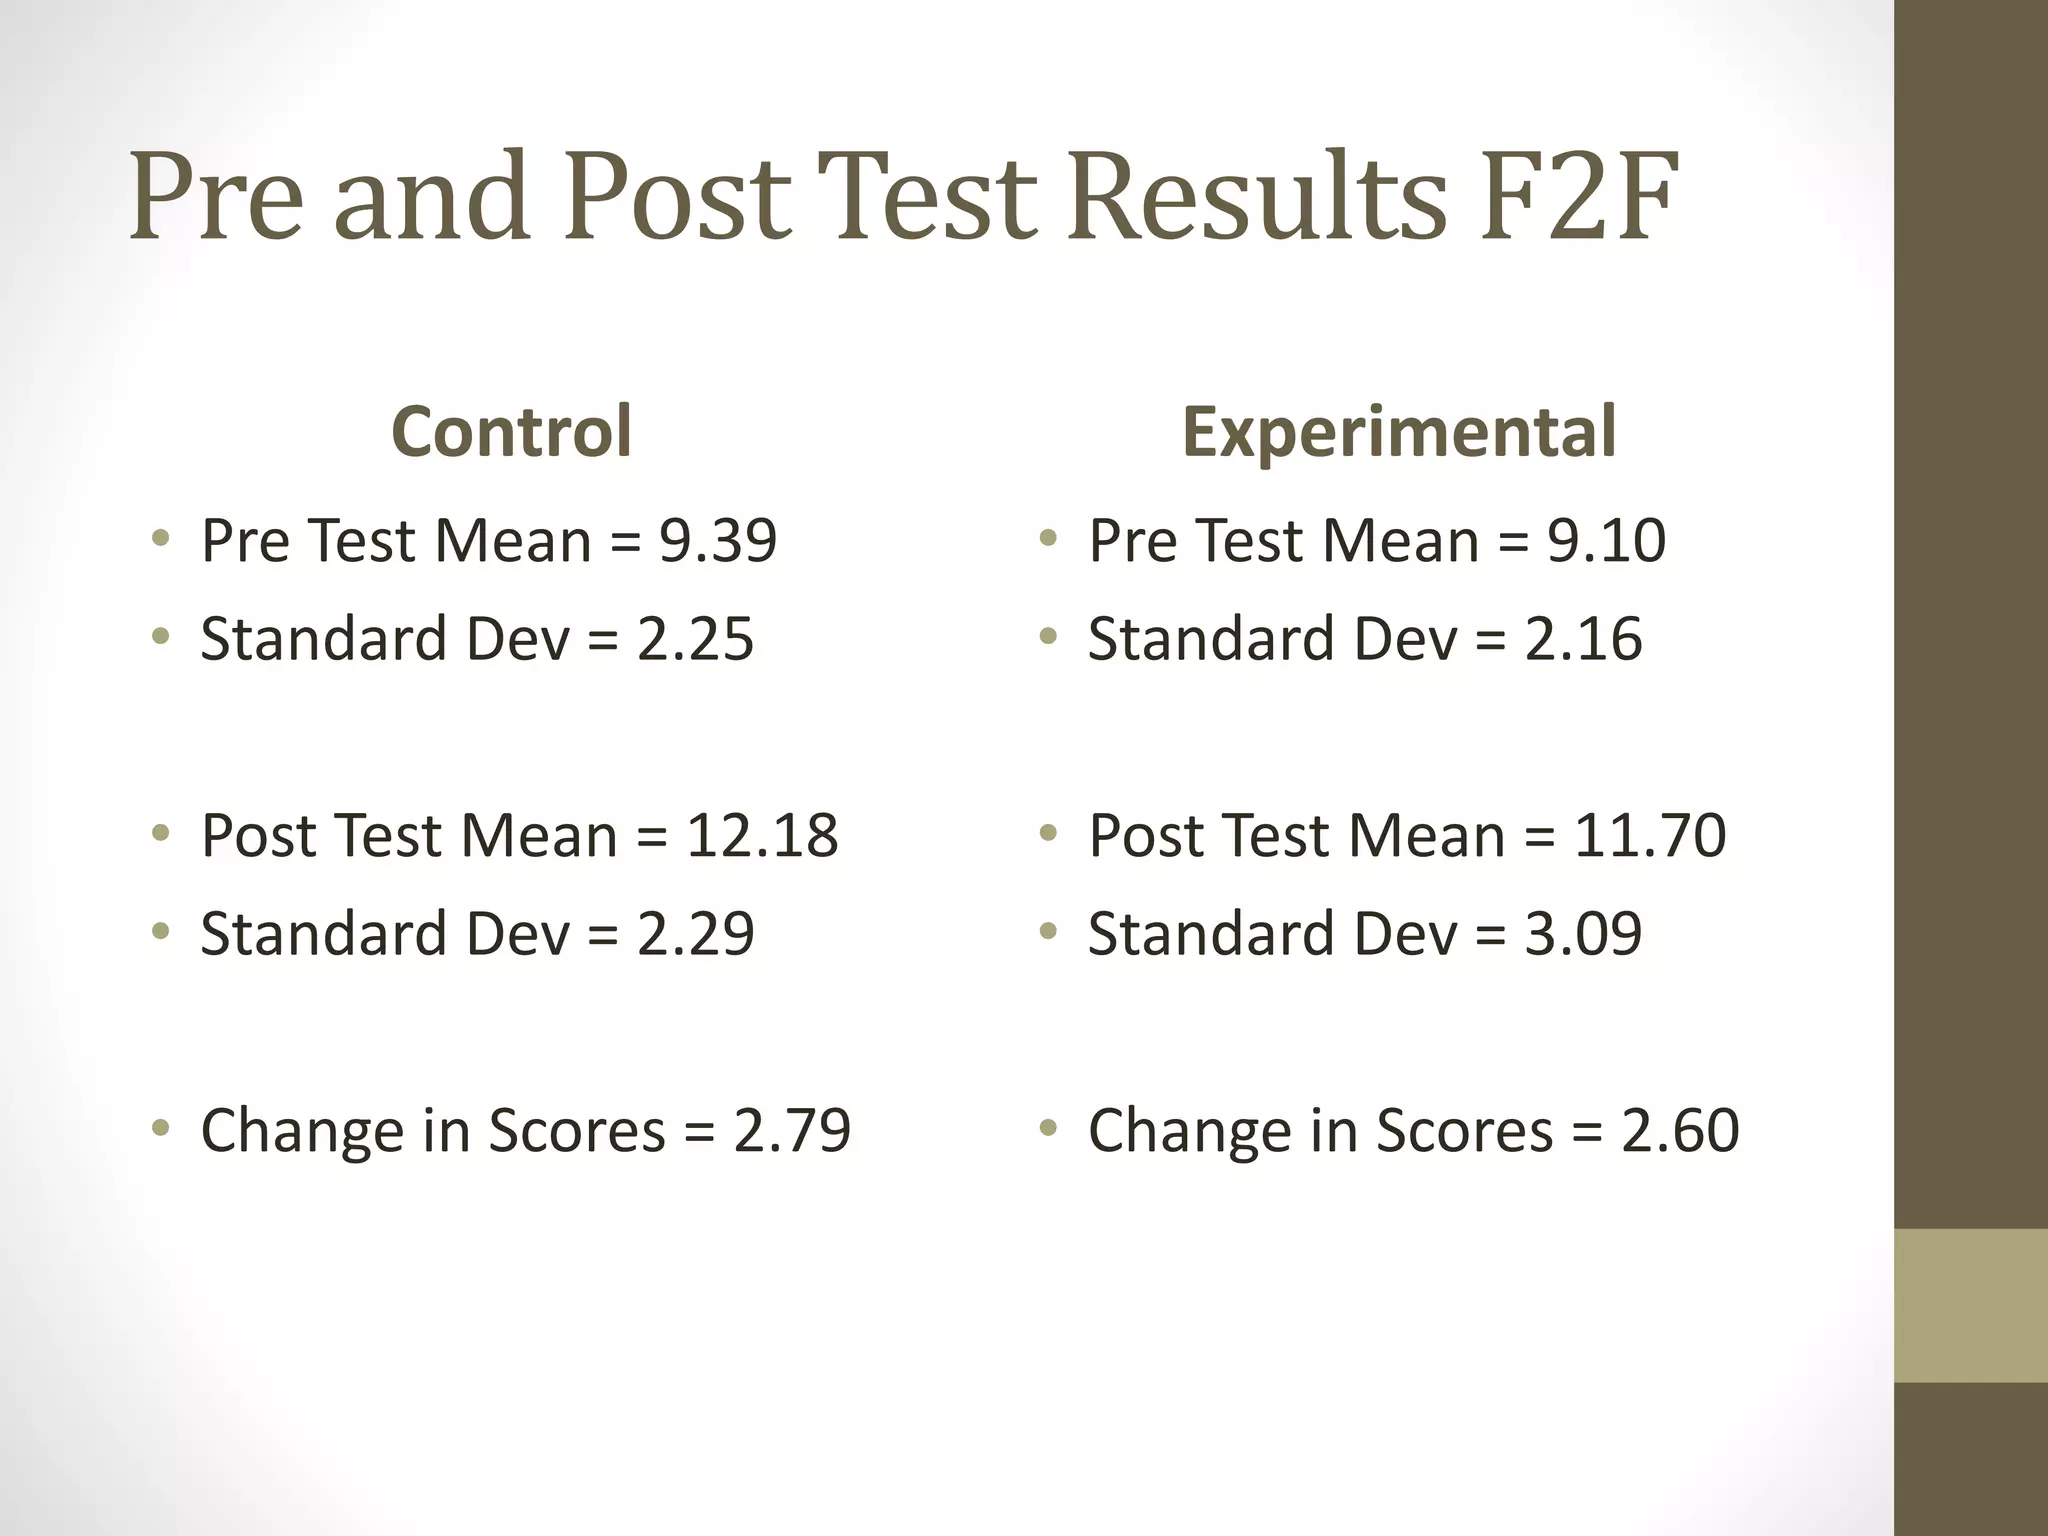
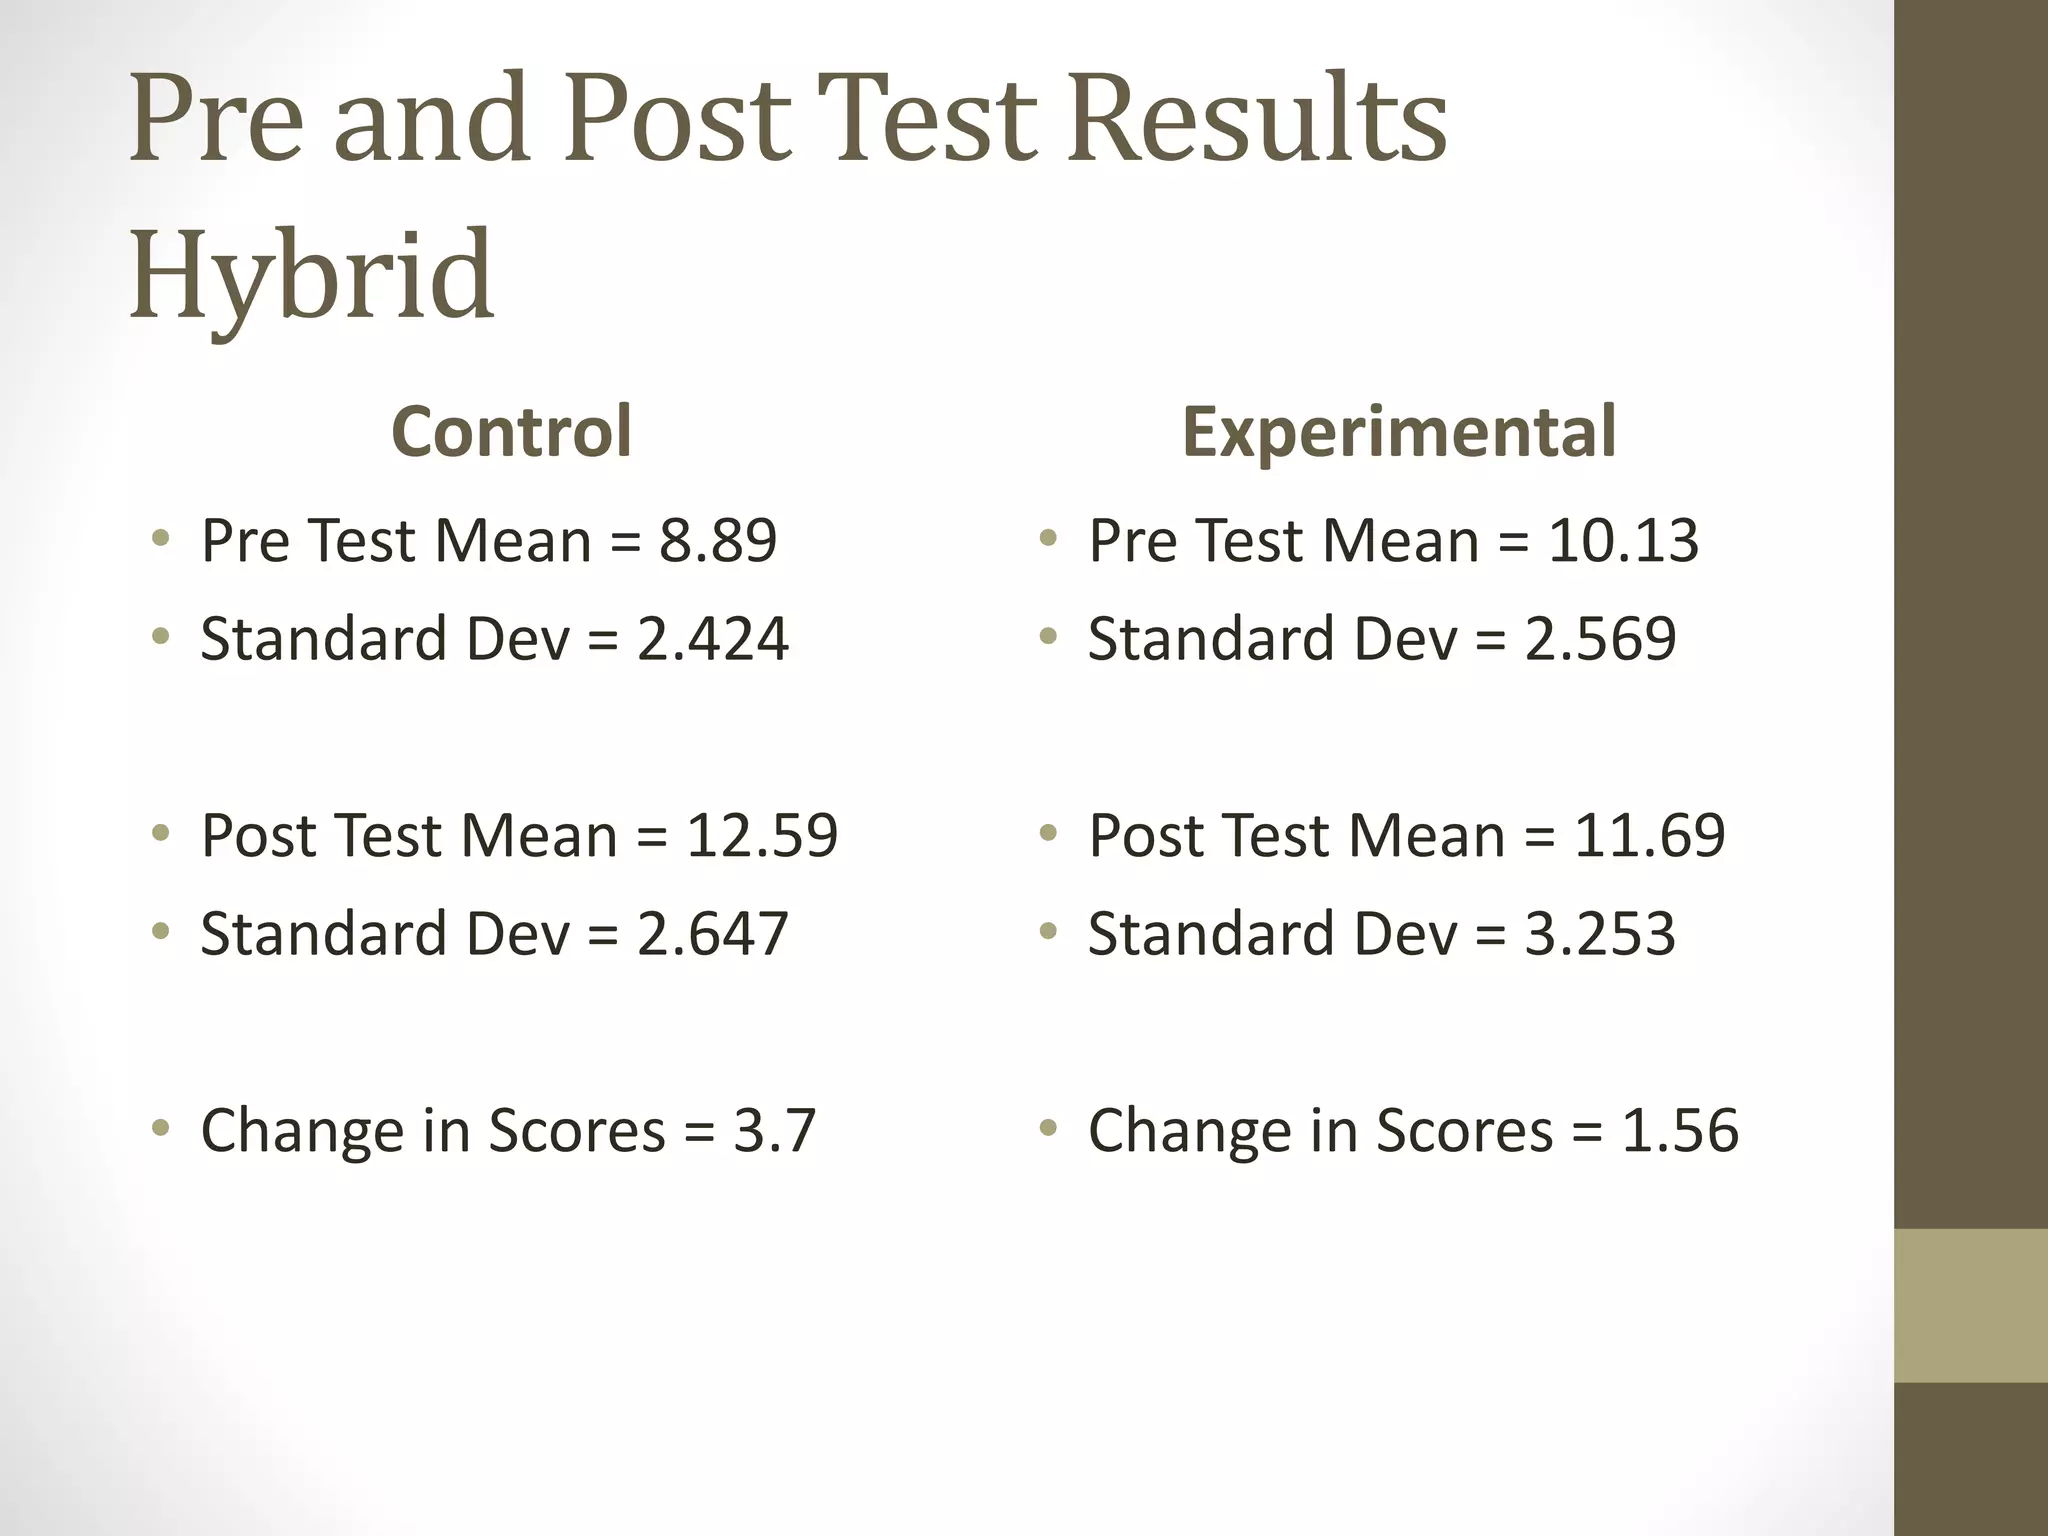


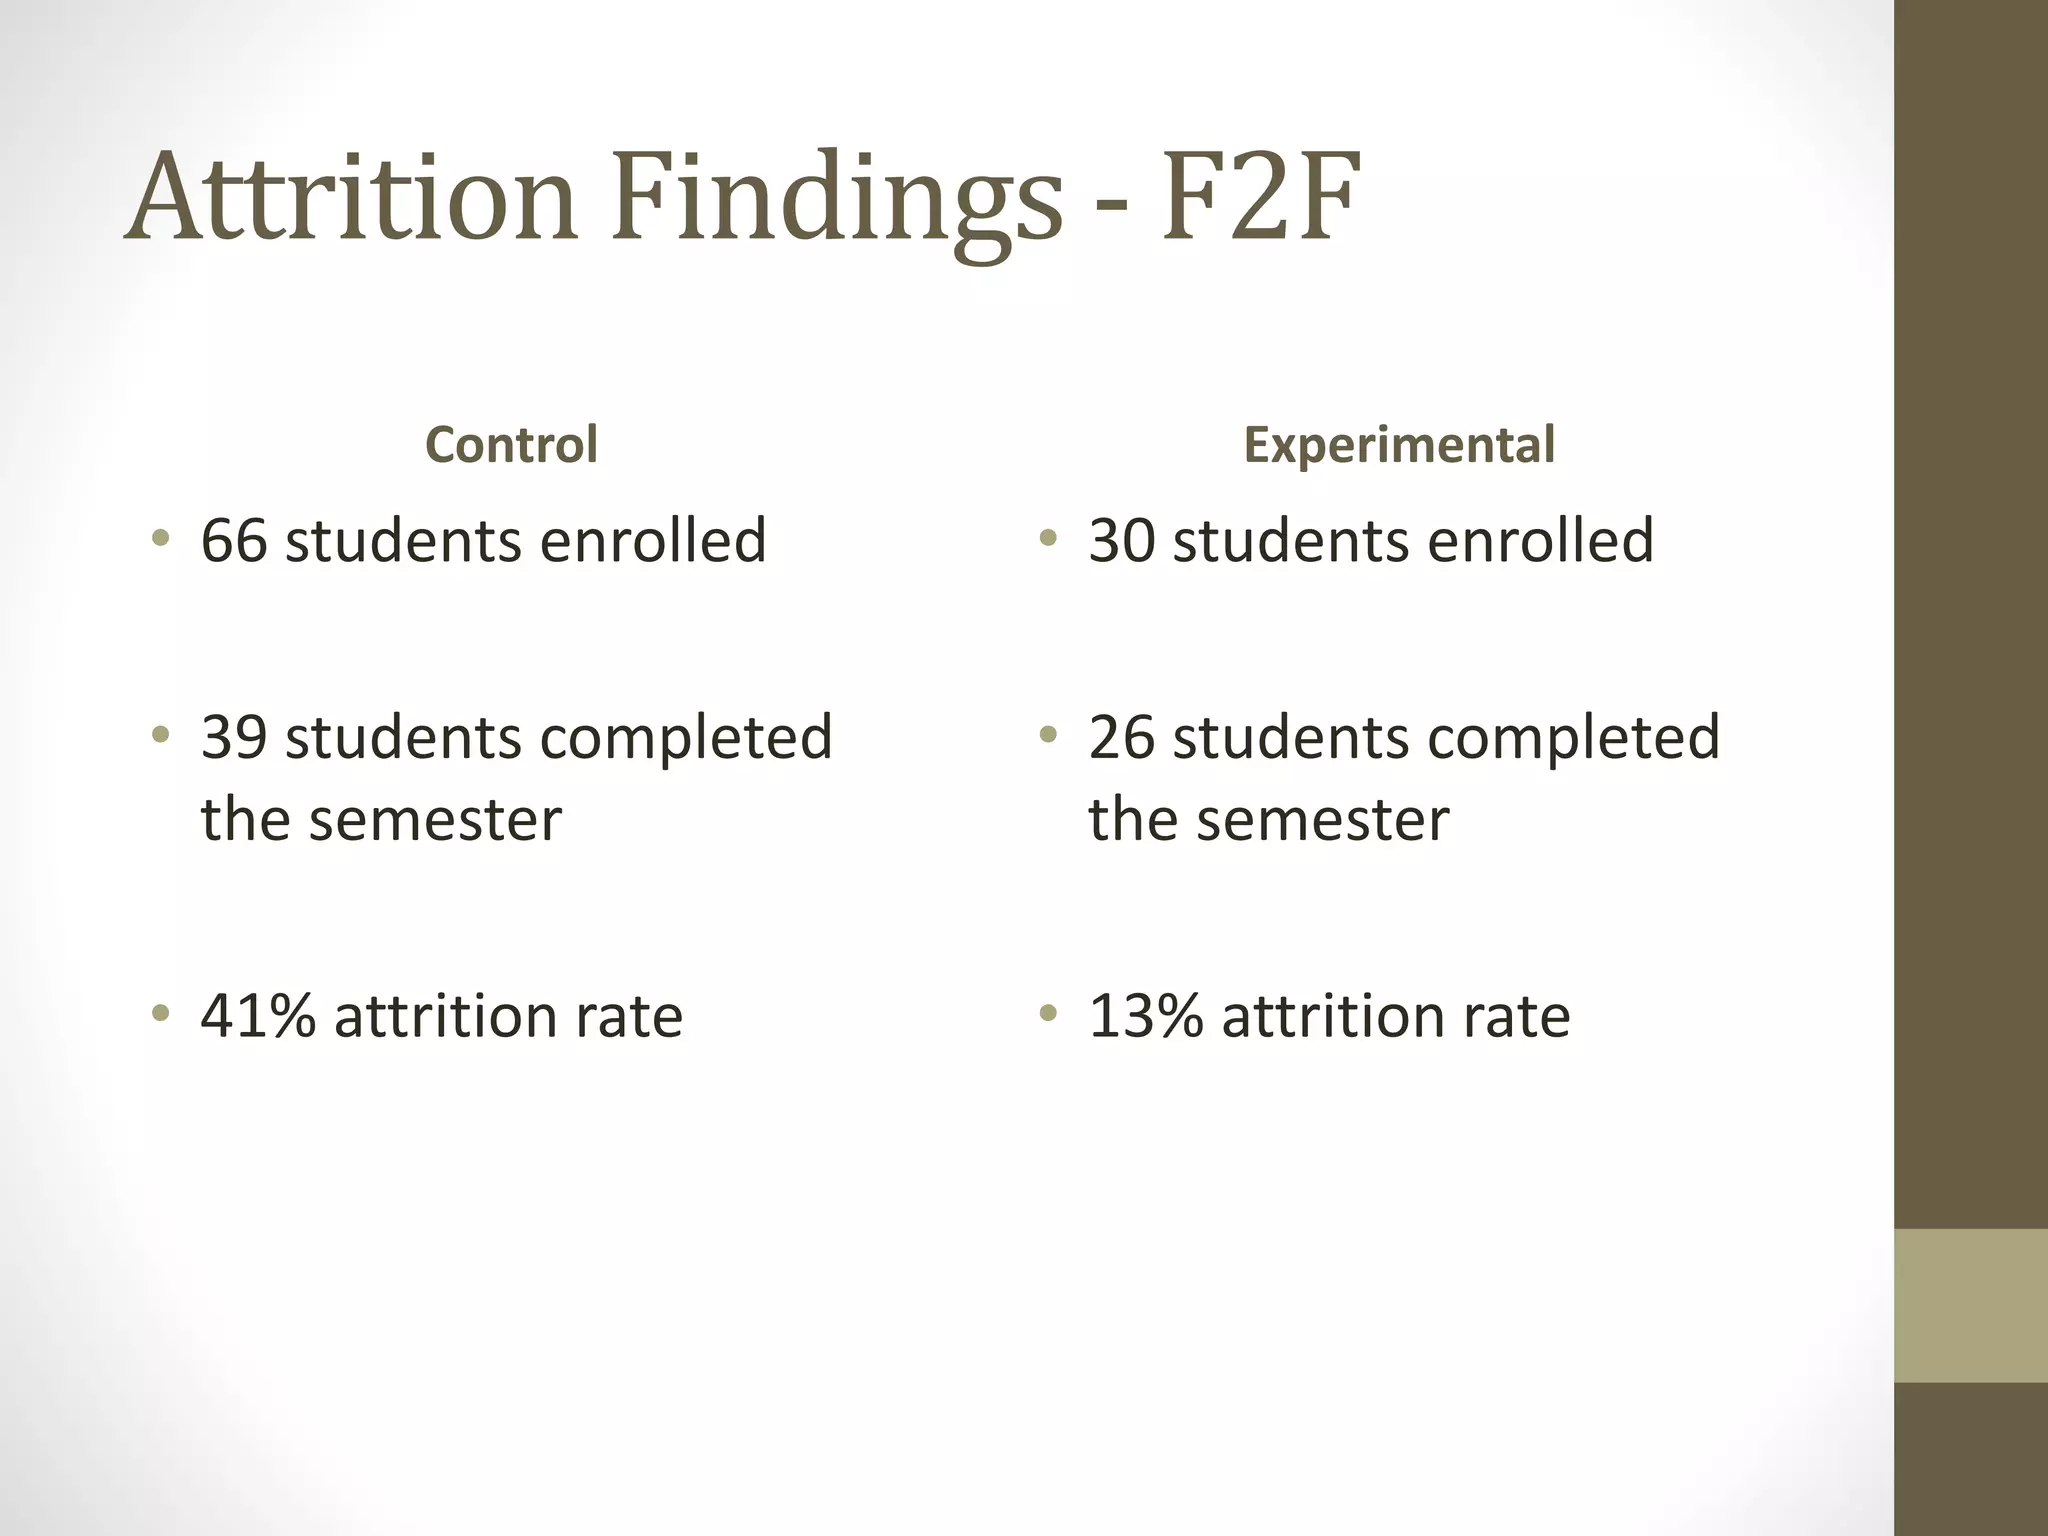
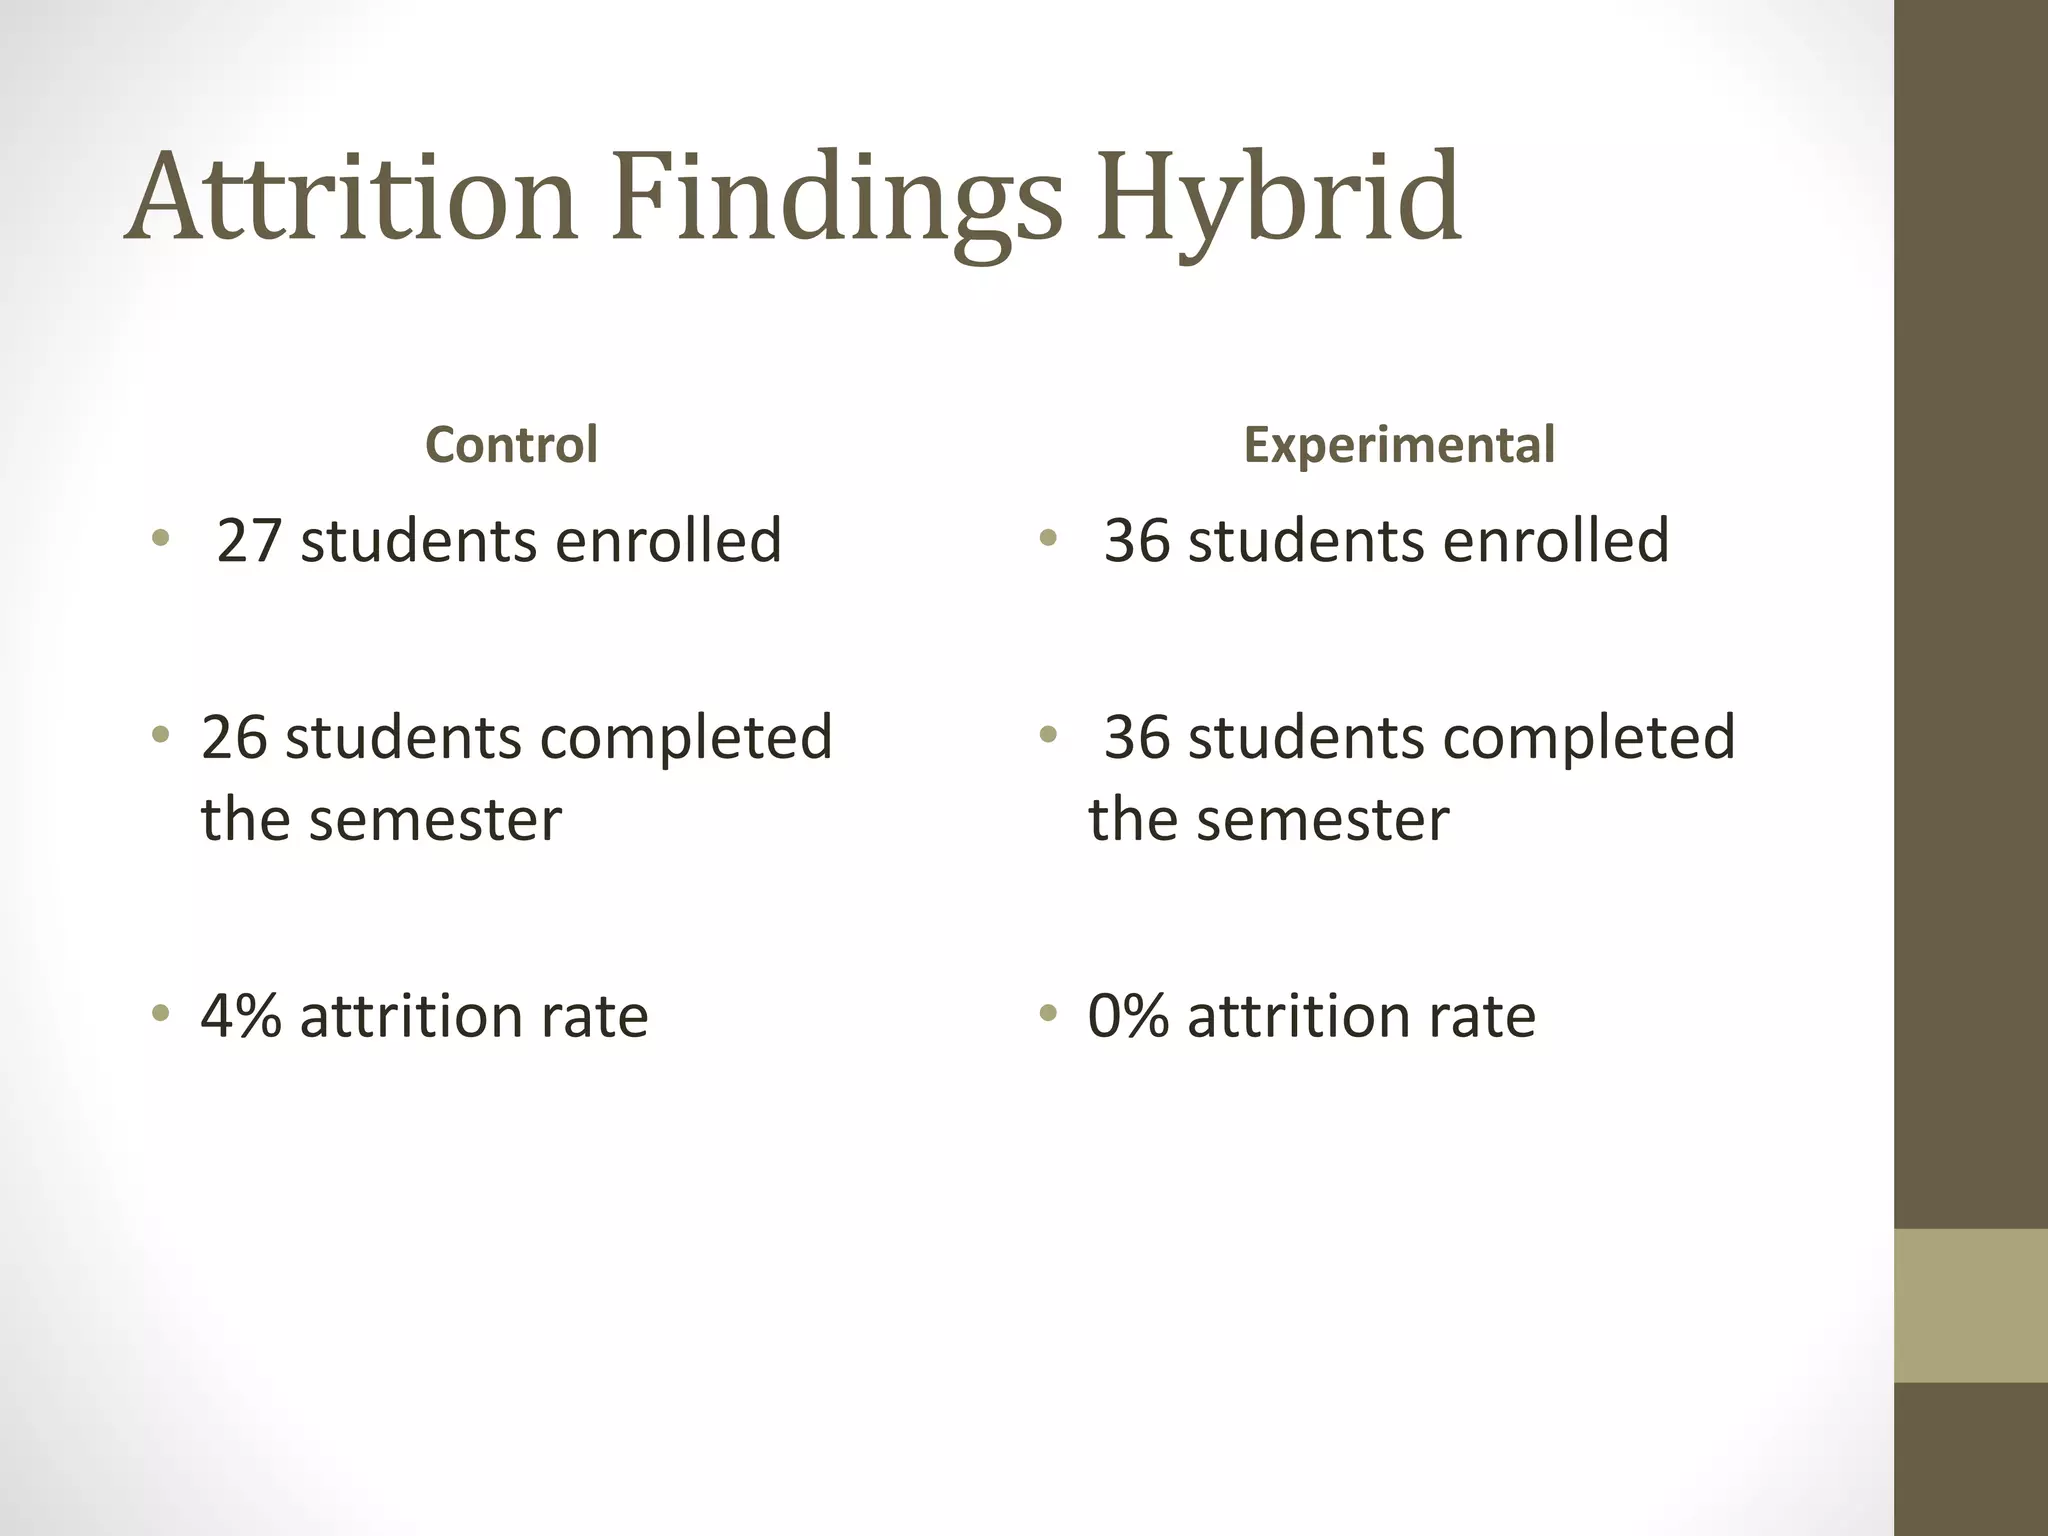
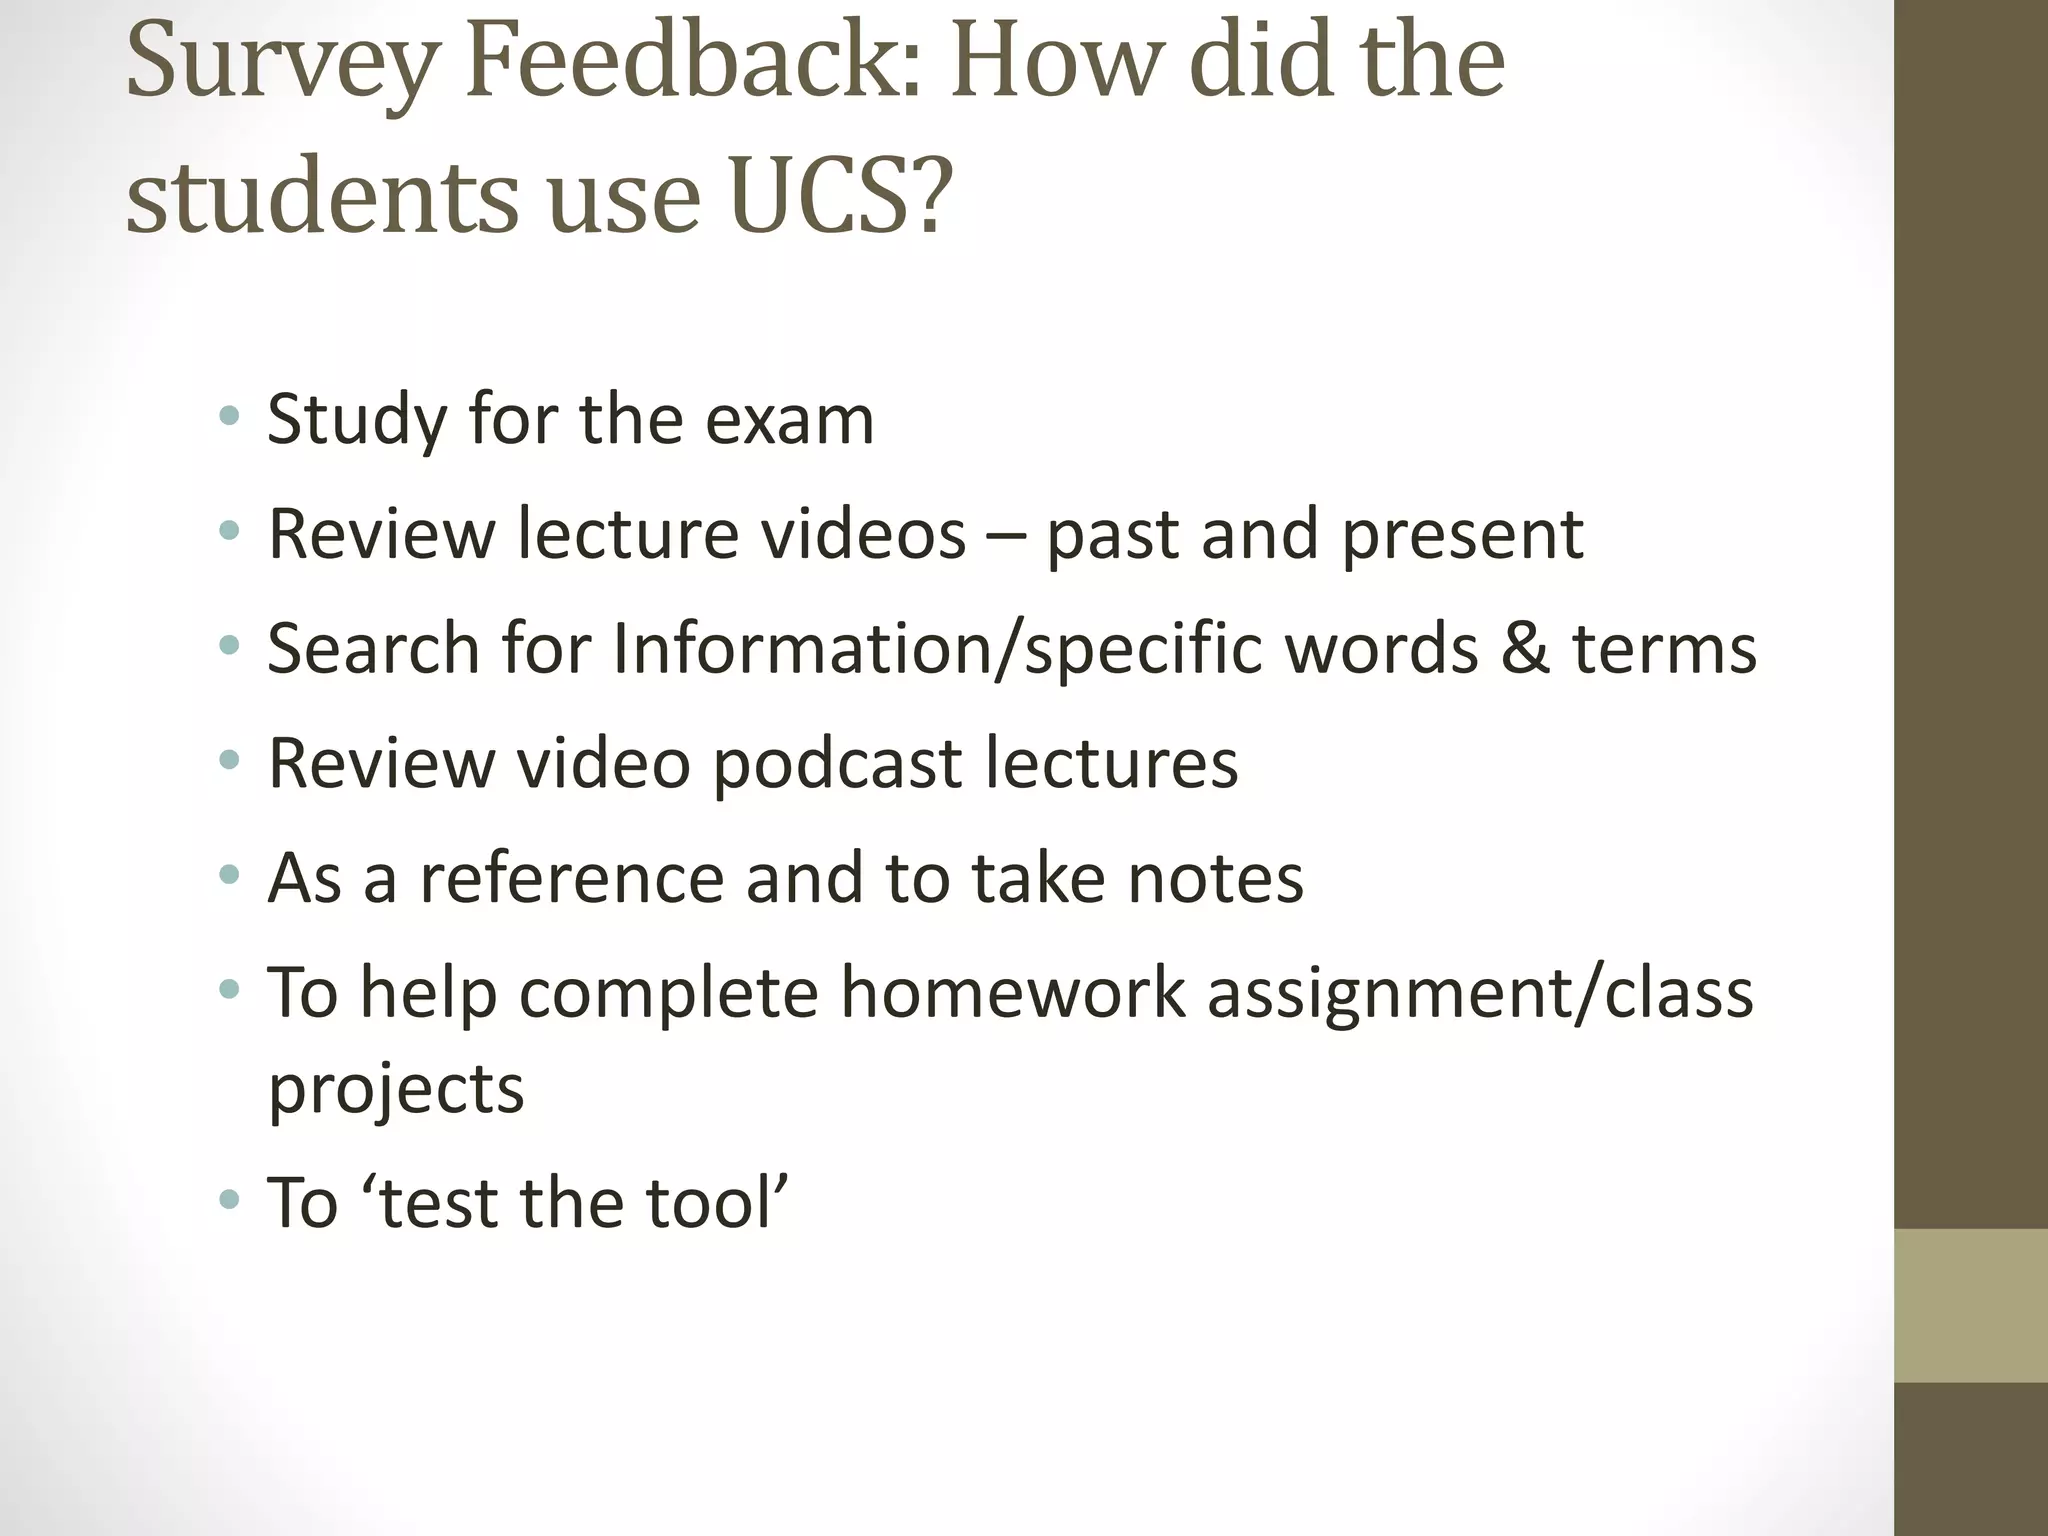
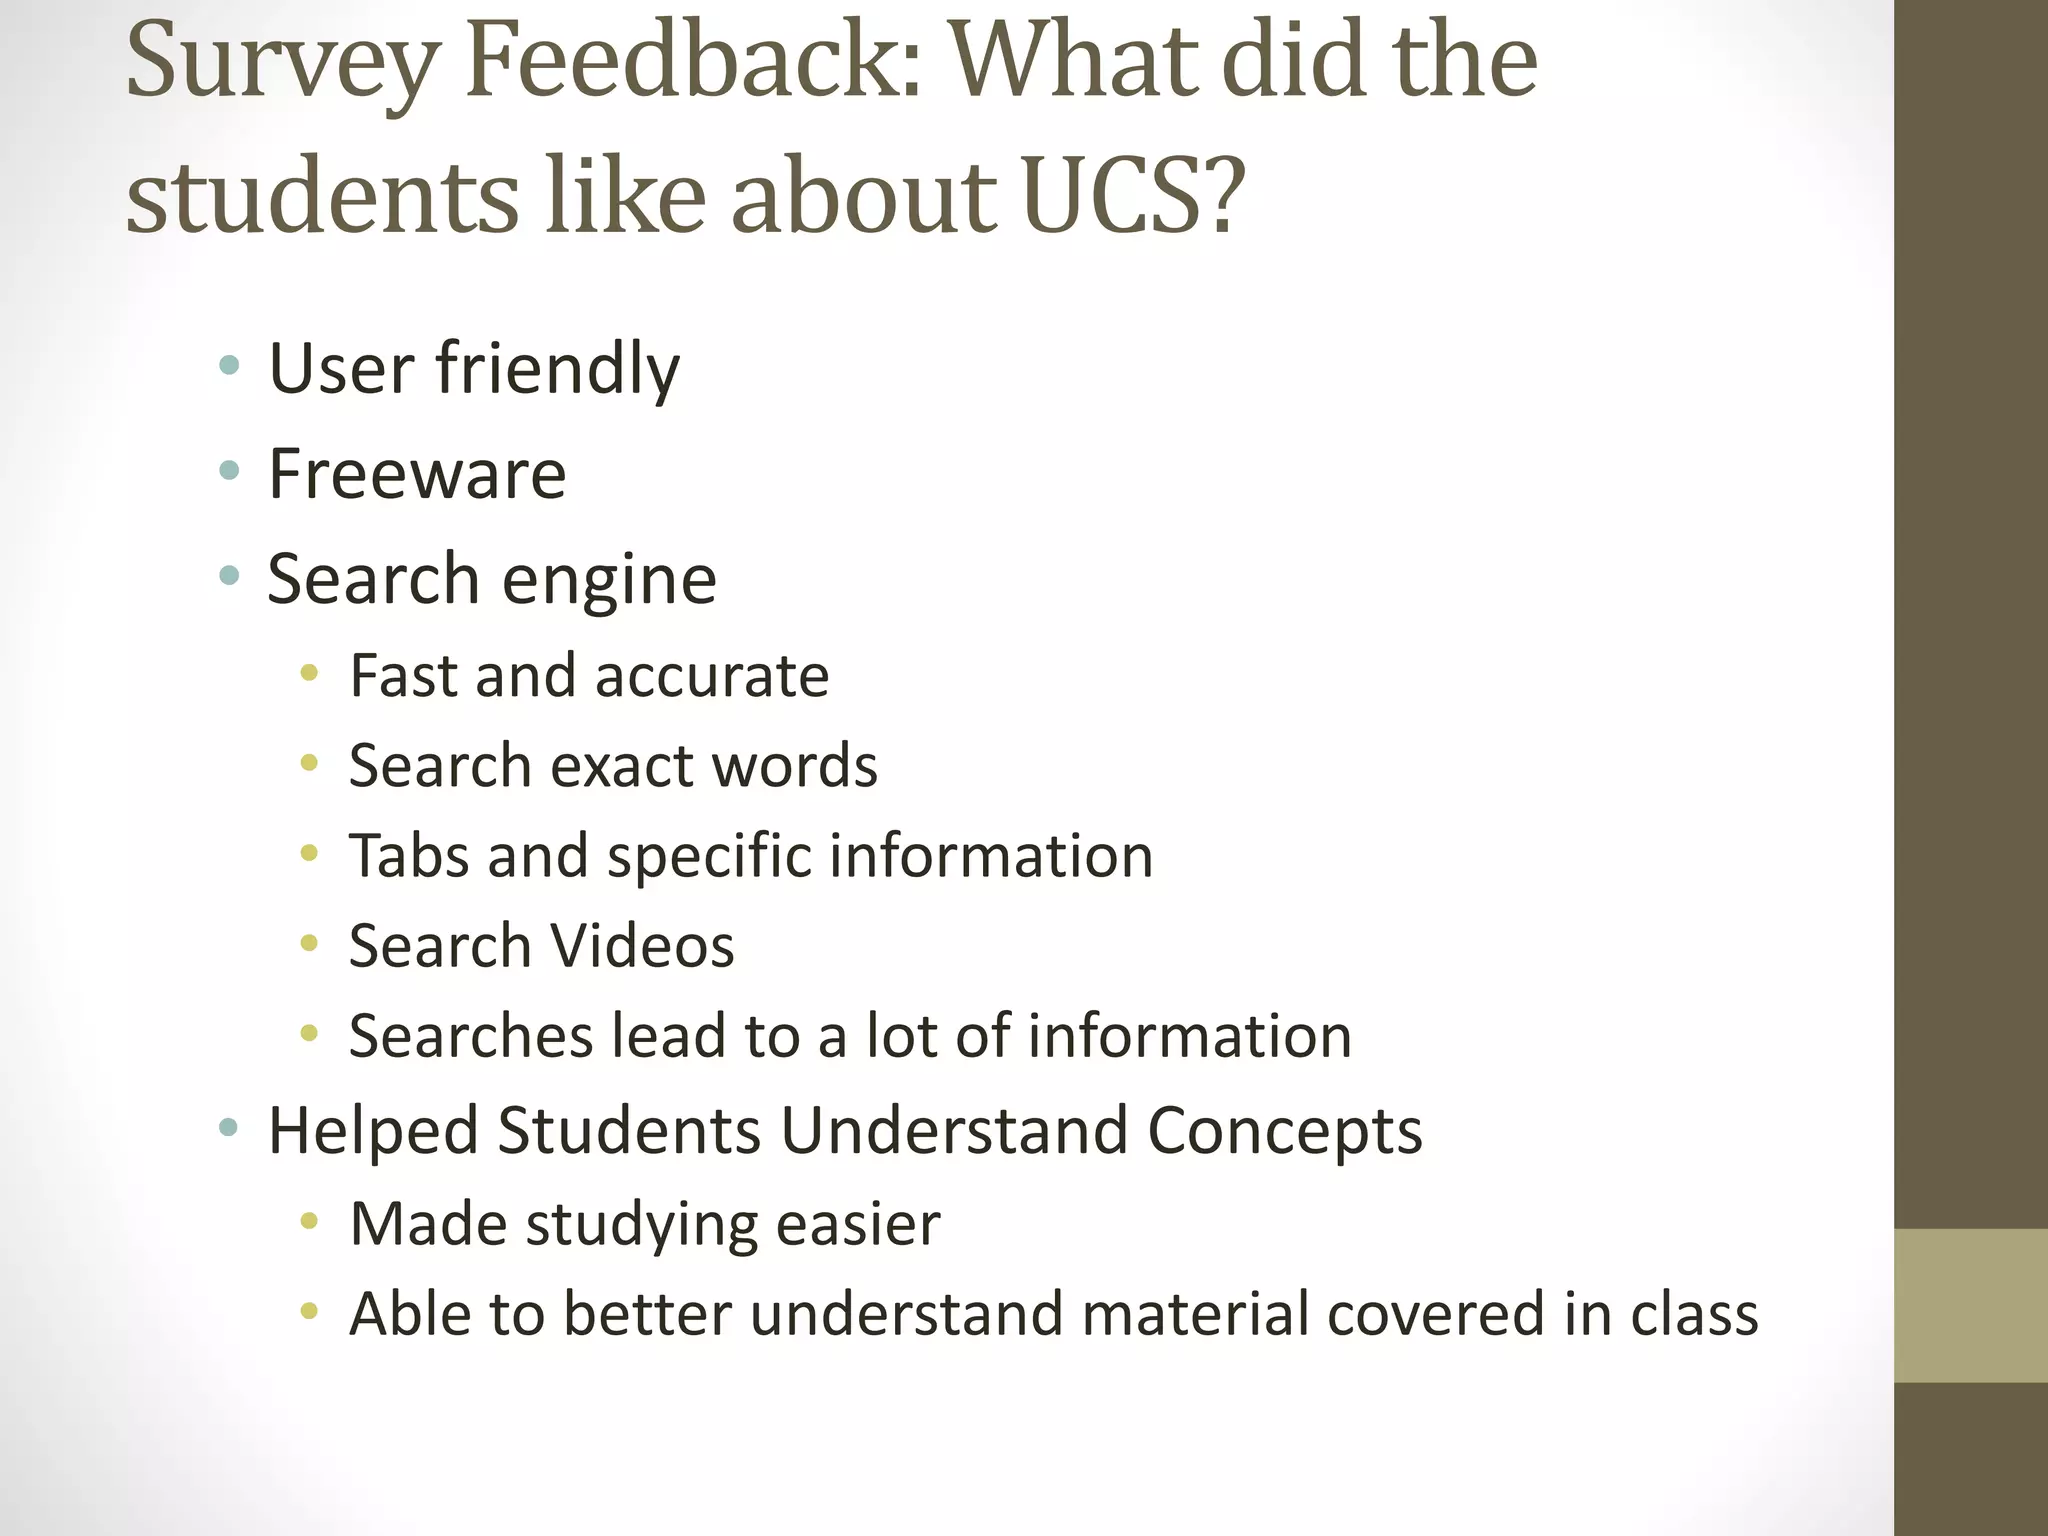
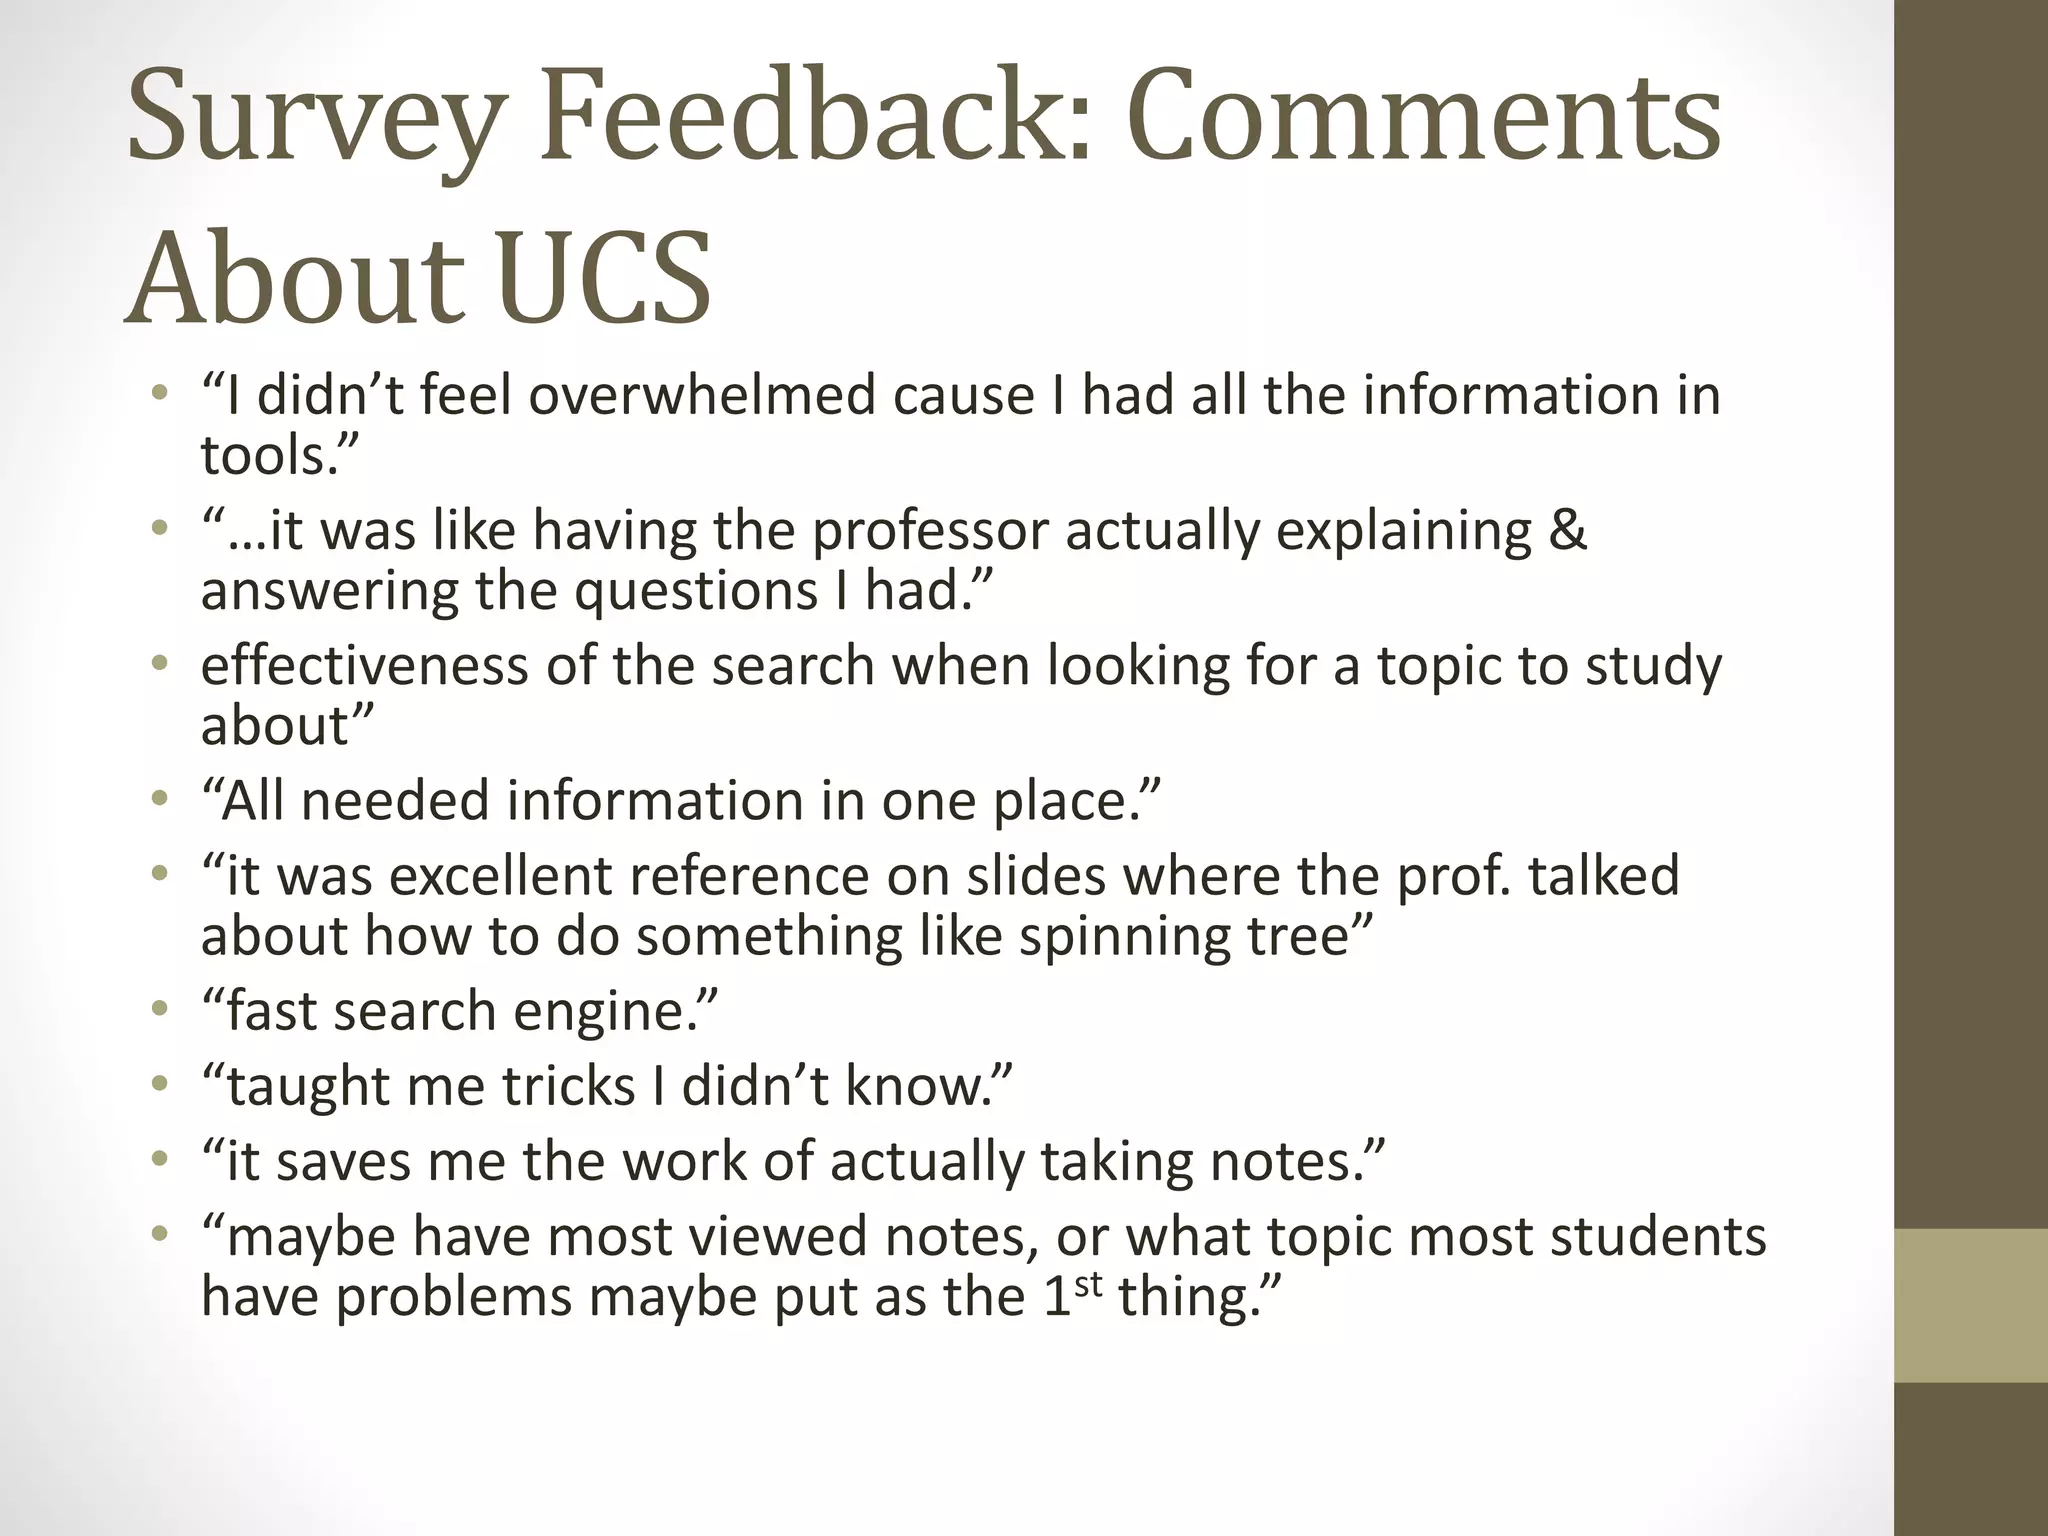
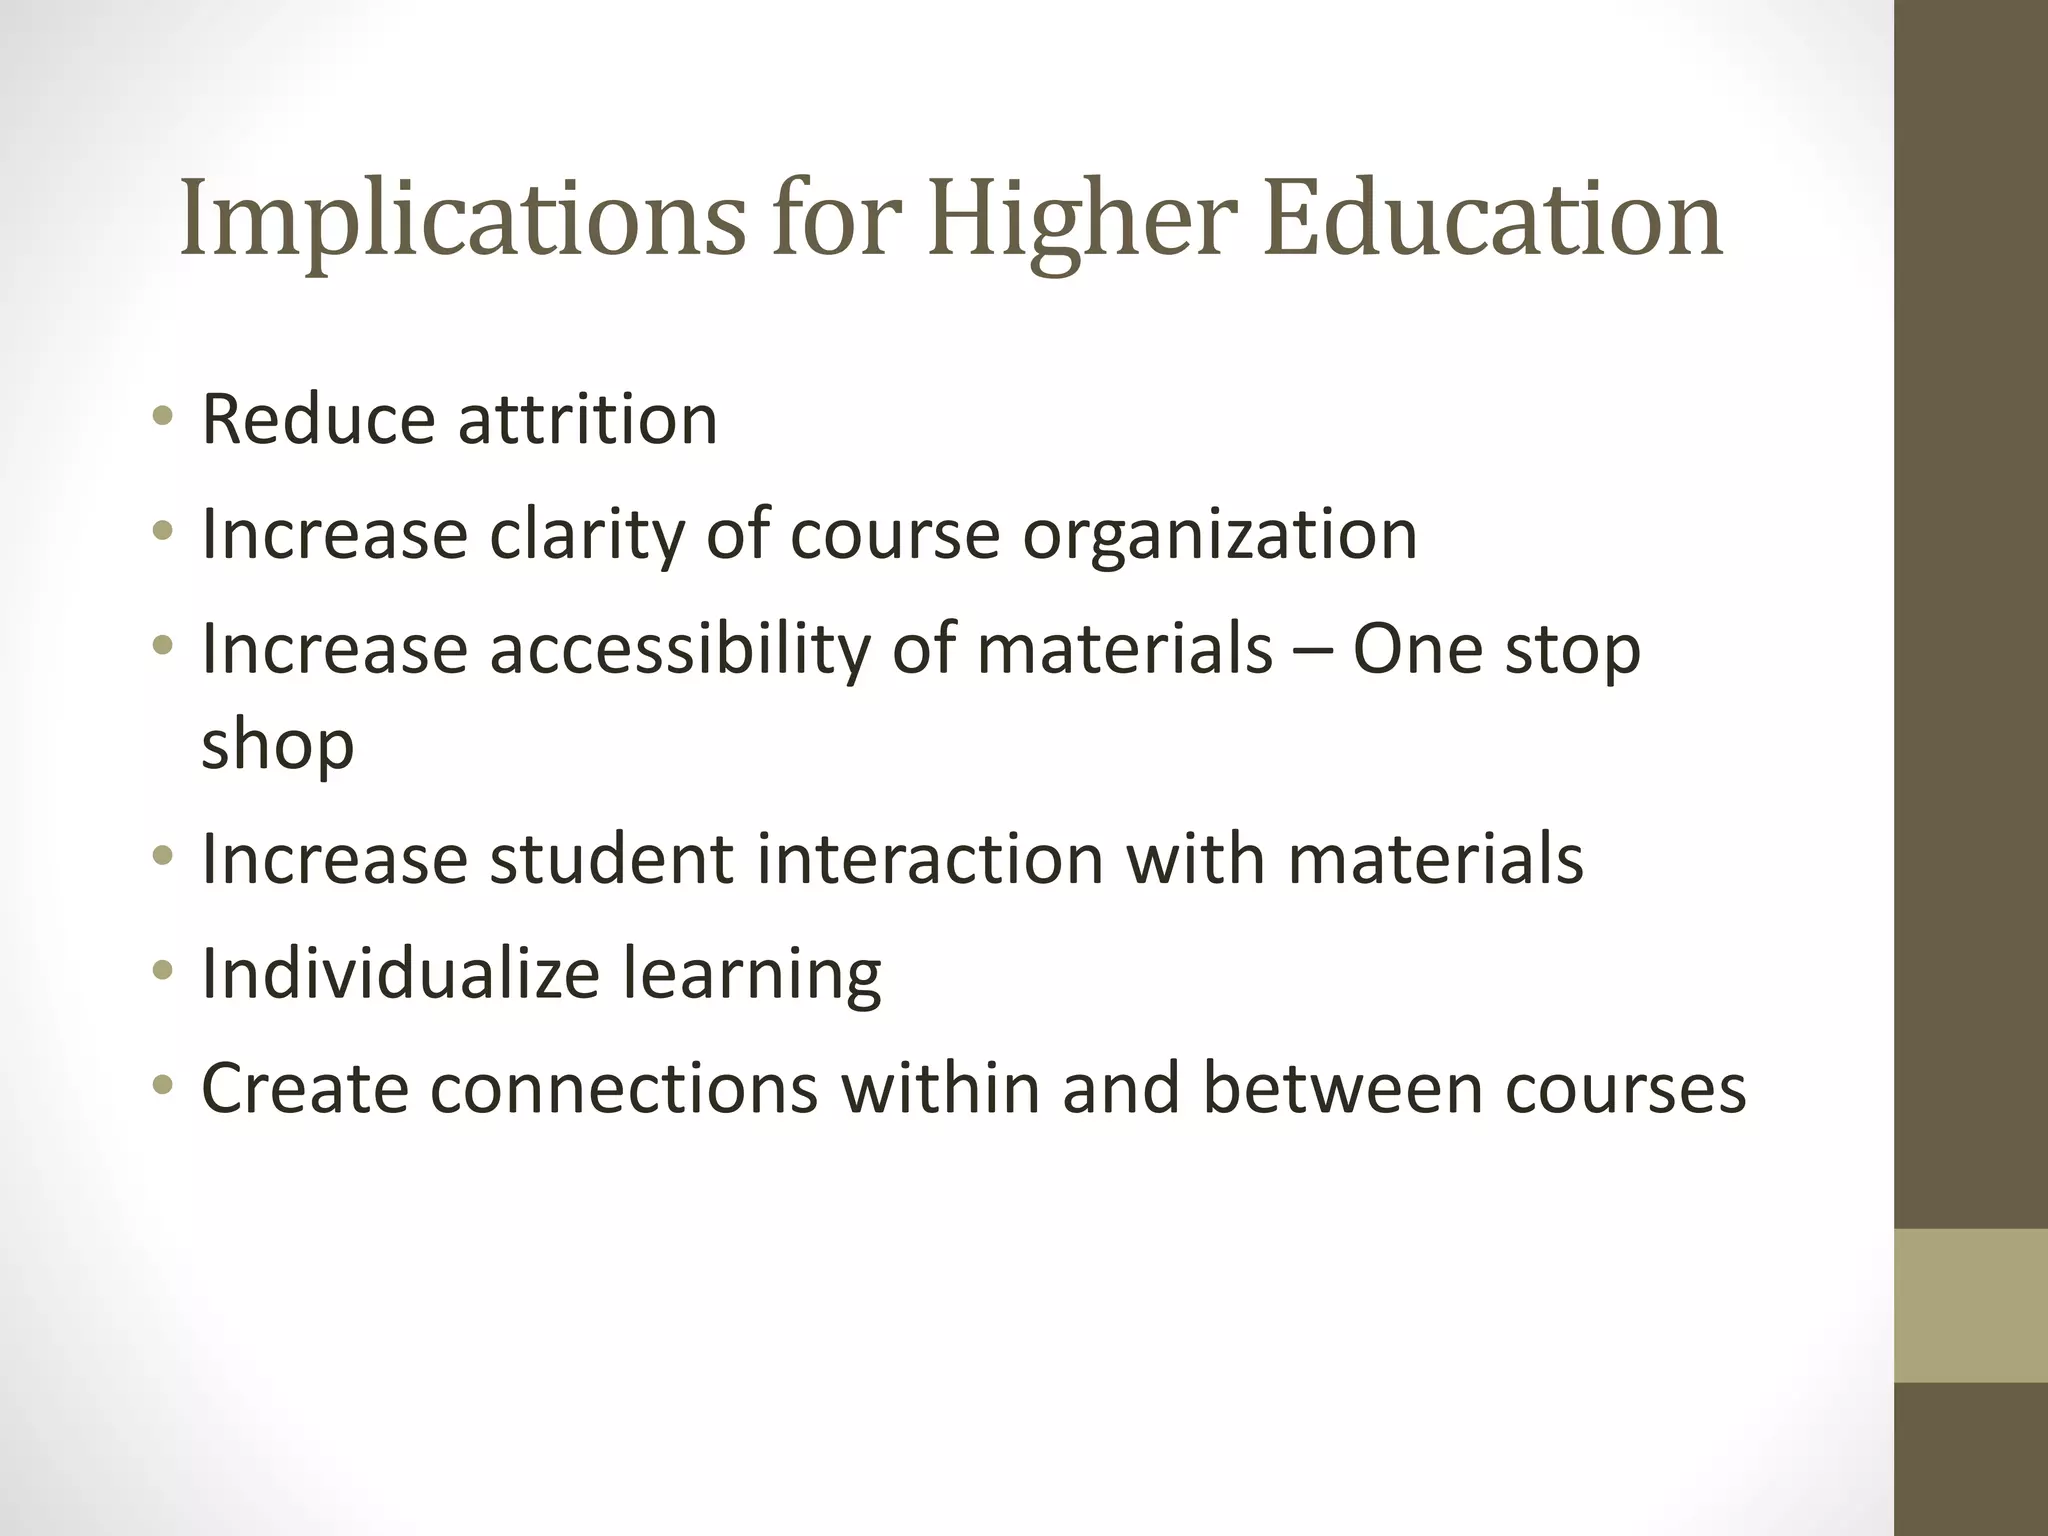


The document discusses the development of the Ultimate Course Search (UCS) tool aimed at enhancing learning for millennials in computer science courses. It presents the objectives of UCS, findings from research comparing control and experimental groups in terms of student performance, and feedback on the tool's usability. Key implications for higher education include reduced attrition, improved course organization, and the need for individualized learning opportunities.