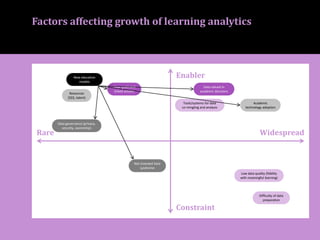
Using Learning Analytics
to Create Our ‘Preferred Future’
Vision, Proof Points & Trends
John Whitmer, Ed.D.
john.whitmer@blackboard.com
@johncwhitmer
Online Learning
Consortium Collaborate
February 24, 2015
Quick bio
15 years managing academic technology
at public higher ed institutions
(R1, 4-year, CC’s)
• Always multi-campus projects, innovative uses
of academic technologies
• Driving interest: what’s the impact of these projects?
Most recently: California State University,
Chancellor’s Office, Academic Technology Services
Doctorate in Education from UC Davis (2013)
with Learning Analytics study on Hybrid,
Large Enrollment course
Active academic research practice
(San Diego State Learning Analytics, MOOC
Research Initiative, Udacity SJSU Study…)
Quick poll
A Unfamiliar; Never heard of it
Somewhat familiar; I’ve seen a reference or two
Very familiar; I follow the literature and/or use it in my practice
Expert; I’m very knowledgeable and actively contributing to the field
How familiar are you with learning analytics?
B
C
D
My Driving Questions
How do we really know
academic technologies
are improving
student learning?
(post-hoc)
How can we improve
the design/build/assess
cycle for academic
technology
innovation?
(design research)
1. Defining Learning Analytics
2 .What we’re learning from research
3. Looking to the future
4. Immediate applications (time permitting)
Outline
1. Defining
Learning
Analytics
200MBof data emissions annually
Economist. (2010, 11/4/2010). Augmented business: Smart systems will disrupt lots of industries, and perhaps the entire economy. The Economist.
Logged into course
within 24 hours
Interacts frequently
in discussion boards
Failed first exam
Hasn’t taken
college-level math
No declared major
What is learning analytics?
Learning and Knowledge
Analytics Conference, 2011
“ ...measurement, collection,
analysis and reporting of data about
learners and their contexts,
for purposes of understanding
and optimizing learning
and the environments
in which it occurs.”
Strong interest by faculty & students
From Eden Dahlstrom, D. Christopher Brooks, and Jacqueline Bichsel. The Current Ecosystem of Learning Management Systems in Higher Education: Student, Faculty,
and IT Perspectives. Research report. Louisville, CO: ECAR, September 2014. Available from http://www.educause.edu/ecar.
2. What we’re
learning
from research
Learning analytics pilot study
for Introduction to Religious Studies
Redesigned to hybrid delivery
through Academy eLearning
Enrollment: 373 students
(54% increase on largest section)
Highest LMS (Vista) usage entire
campus Fall 2010 (>250k hits)
Bimodal outcomes:
• 10% increased SLO mastery
• 7% & 11% increase in DWF
Why? Can’t tell with aggregated
reporting data
54 F’s
Student retention: Grades vs. LMS logins
Course: “Introduction to Religious Studies”
CSU Chico, Fall 2013 (n=373)
At-risk students: “Over-working gap”
Activities by Pell and grade
Grade / Pell-Eligible
A B+ C C-
0K
5K
10K
15K
20K
25K
30K
35K
Measure Names
Admin
Assess
Engage
Content
Not Pell-
Eligible
Pell-
Eligible
Not Pell-
Eligible
Pell-
Eligible
Not Pell-
Eligible
Pell-
Eligible
Not Pell-
Eligible
Pell-
Eligible
Extra effort
In content-related
activities
Learning analytics triggers & interventions
proof of concept study
President-level initiative
Goals: (1) find accurate learning analytics
triggers; (2) create effective interventions
Multiple academic technology “triggers”
(e.g., LMS access, Grade, Online
Homework/Quiz, Clicker use)
Conducted Spring 2014, Fall 2015
(3 courses, 7 sections)
Frequency of interventions (Spring 2014)
# Students Receiving >0 Interventions:
PSY: 177 (84%) STAT: 165 (70%)
14%
19%
11%
17%
10%
6%
5%
6%
2% 1%
3% 2%
30%
17%
13%
12%
7%
6% 6%
3%
4%
1%
2%
4%
0%
5%
10%
15%
20%
25%
30%
35%
0 1 2 3 4 5 6 7 8 9 10 >10
Students
Interventions
PSY
STAT
Fall 2014 Multimedia Interventions
Poll question
A Not significant
<10%, significant .05 level
20%, significant .01 level
30%, significant .01 level
Did triggers predict achievement? What level significance?
How much variation in student grade was explained?
B
C
D
E 50%+, significant .001 level
Poll question
A Not significant
<10%, significant .05 level
20%, significant .01 level
30%, significant .01 level
Did triggers predict achievement? What level significance?
How much variation in student grade was explained?
B
C
D
E 50%+, significant .001 level
Statistics
Learning analytics triggers vs. final course points
Spring 2014: 4 sections, 2 courses, 882 students
Psychology
p<0.0001; r2=0.4828 p<0.0001; r2=0.6558
Fall 2014 results: Almost identical
5 Sections, 3 Courses, N=1,220 students
p<0.00001; r2=0.4836
77%
91%
23%
9%
0%
10%
20%
30%
40%
50%
60%
70%
80%
90%
100%
No Interventions
(n=87, PSY, Pell-Eligible)
Interventions
(n=81, PSY, Pell-eligible)
Passing Grade Repeatible Grade
24 additional Pell-
eligible students would
have passed the class
if the intervention
was applied to all
participating students.
Experimentalparticipationvs.repeatablegrade(Pell-eligible)
n=168, Spring 2014, PSY 101
Summary findings previous LMS analytics studies
Institution-Wide Analysis
with Only LMS Data
Course-Specific
with Only LMS Data
Course-Specific
with LMS Data & Other Sources
%GradeExplained#
60%
50%
40%
30%
20%
10%
0%
25%
4%
51%
0%
33% 31%
57%
35%
(Whitmer,
2013a)
(Campbell
2007a)
(Campbell
2007b)
(Jayaprakash,
Lauria 2014)
(Macfadyen
and Dawson
2010)
(Morris,
Finnegan et al.
2005)
Whitmer &
Dodge (2015)
Whitmer
(2013b)
Hybrid
Course
Format:
Hybrid,
online
Online
3. Looking
to the future
Factors affecting growth of learning analytics
Enabler
Constraint
WidespreadRare
New education
models
Resources
($$$, talent)
Data governance (privacy,
security, ownership)
Clear goals and
linked actions
Data valued in
academic decisions
Tools/systems for data
co-mingling and analysis
Academic
technology adoption
Low data quality (fidelity
with meaningful learning)
Difficulty of data
preparation
Not invented here
syndrome
Call to action
(from a May 2012 Keynote Presentation @ San Diego State U)
You’re not behind the curve, this is a rapidly emerging area
that we can (should) lead...
Metrics reporting is the foundation for analytics
Start with what you have! Don’t wait for student characteristics and
detailed database information; LMS data can provide significant insights
If there’s any ed tech software folks in the audience,
please help us with better reporting!
Thank you!
John Whitmer, Ed.D.
john.whitmer@blackboard.com
@johncwhitmer

Using Learning Analytics to Create our 'Preferred Future'

  • 1.
    Using Learning Analytics toCreate Our ‘Preferred Future’ Vision, Proof Points & Trends John Whitmer, Ed.D. john.whitmer@blackboard.com @johncwhitmer Online Learning Consortium Collaborate February 24, 2015
  • 2.
    Quick bio 15 yearsmanaging academic technology at public higher ed institutions (R1, 4-year, CC’s) • Always multi-campus projects, innovative uses of academic technologies • Driving interest: what’s the impact of these projects? Most recently: California State University, Chancellor’s Office, Academic Technology Services Doctorate in Education from UC Davis (2013) with Learning Analytics study on Hybrid, Large Enrollment course Active academic research practice (San Diego State Learning Analytics, MOOC Research Initiative, Udacity SJSU Study…)
  • 3.
    Quick poll A Unfamiliar;Never heard of it Somewhat familiar; I’ve seen a reference or two Very familiar; I follow the literature and/or use it in my practice Expert; I’m very knowledgeable and actively contributing to the field How familiar are you with learning analytics? B C D
  • 4.
    My Driving Questions Howdo we really know academic technologies are improving student learning? (post-hoc) How can we improve the design/build/assess cycle for academic technology innovation? (design research)
  • 5.
    1. Defining LearningAnalytics 2 .What we’re learning from research 3. Looking to the future 4. Immediate applications (time permitting) Outline
  • 6.
  • 7.
    200MBof data emissionsannually Economist. (2010, 11/4/2010). Augmented business: Smart systems will disrupt lots of industries, and perhaps the entire economy. The Economist.
  • 8.
    Logged into course within24 hours Interacts frequently in discussion boards Failed first exam Hasn’t taken college-level math No declared major
  • 9.
    What is learninganalytics? Learning and Knowledge Analytics Conference, 2011 “ ...measurement, collection, analysis and reporting of data about learners and their contexts, for purposes of understanding and optimizing learning and the environments in which it occurs.”
  • 10.
    Strong interest byfaculty & students From Eden Dahlstrom, D. Christopher Brooks, and Jacqueline Bichsel. The Current Ecosystem of Learning Management Systems in Higher Education: Student, Faculty, and IT Perspectives. Research report. Louisville, CO: ECAR, September 2014. Available from http://www.educause.edu/ecar.
  • 11.
  • 12.
    Learning analytics pilotstudy for Introduction to Religious Studies Redesigned to hybrid delivery through Academy eLearning Enrollment: 373 students (54% increase on largest section) Highest LMS (Vista) usage entire campus Fall 2010 (>250k hits) Bimodal outcomes: • 10% increased SLO mastery • 7% & 11% increase in DWF Why? Can’t tell with aggregated reporting data 54 F’s
  • 13.
    Student retention: Gradesvs. LMS logins Course: “Introduction to Religious Studies” CSU Chico, Fall 2013 (n=373)
  • 14.
  • 15.
    Activities by Pelland grade Grade / Pell-Eligible A B+ C C- 0K 5K 10K 15K 20K 25K 30K 35K Measure Names Admin Assess Engage Content Not Pell- Eligible Pell- Eligible Not Pell- Eligible Pell- Eligible Not Pell- Eligible Pell- Eligible Not Pell- Eligible Pell- Eligible Extra effort In content-related activities
  • 16.
    Learning analytics triggers& interventions proof of concept study President-level initiative Goals: (1) find accurate learning analytics triggers; (2) create effective interventions Multiple academic technology “triggers” (e.g., LMS access, Grade, Online Homework/Quiz, Clicker use) Conducted Spring 2014, Fall 2015 (3 courses, 7 sections)
  • 17.
    Frequency of interventions(Spring 2014) # Students Receiving >0 Interventions: PSY: 177 (84%) STAT: 165 (70%) 14% 19% 11% 17% 10% 6% 5% 6% 2% 1% 3% 2% 30% 17% 13% 12% 7% 6% 6% 3% 4% 1% 2% 4% 0% 5% 10% 15% 20% 25% 30% 35% 0 1 2 3 4 5 6 7 8 9 10 >10 Students Interventions PSY STAT
  • 18.
    Fall 2014 MultimediaInterventions
  • 19.
    Poll question A Notsignificant <10%, significant .05 level 20%, significant .01 level 30%, significant .01 level Did triggers predict achievement? What level significance? How much variation in student grade was explained? B C D E 50%+, significant .001 level
  • 20.
    Poll question A Notsignificant <10%, significant .05 level 20%, significant .01 level 30%, significant .01 level Did triggers predict achievement? What level significance? How much variation in student grade was explained? B C D E 50%+, significant .001 level
  • 21.
    Statistics Learning analytics triggersvs. final course points Spring 2014: 4 sections, 2 courses, 882 students Psychology p<0.0001; r2=0.4828 p<0.0001; r2=0.6558
  • 22.
    Fall 2014 results:Almost identical 5 Sections, 3 Courses, N=1,220 students p<0.00001; r2=0.4836
  • 23.
    77% 91% 23% 9% 0% 10% 20% 30% 40% 50% 60% 70% 80% 90% 100% No Interventions (n=87, PSY,Pell-Eligible) Interventions (n=81, PSY, Pell-eligible) Passing Grade Repeatible Grade 24 additional Pell- eligible students would have passed the class if the intervention was applied to all participating students. Experimentalparticipationvs.repeatablegrade(Pell-eligible) n=168, Spring 2014, PSY 101
  • 24.
    Summary findings previousLMS analytics studies Institution-Wide Analysis with Only LMS Data Course-Specific with Only LMS Data Course-Specific with LMS Data & Other Sources %GradeExplained# 60% 50% 40% 30% 20% 10% 0% 25% 4% 51% 0% 33% 31% 57% 35% (Whitmer, 2013a) (Campbell 2007a) (Campbell 2007b) (Jayaprakash, Lauria 2014) (Macfadyen and Dawson 2010) (Morris, Finnegan et al. 2005) Whitmer & Dodge (2015) Whitmer (2013b) Hybrid Course Format: Hybrid, online Online
  • 25.
  • 26.
    Factors affecting growthof learning analytics Enabler Constraint WidespreadRare New education models Resources ($$$, talent) Data governance (privacy, security, ownership) Clear goals and linked actions Data valued in academic decisions Tools/systems for data co-mingling and analysis Academic technology adoption Low data quality (fidelity with meaningful learning) Difficulty of data preparation Not invented here syndrome
  • 27.
    Call to action (froma May 2012 Keynote Presentation @ San Diego State U) You’re not behind the curve, this is a rapidly emerging area that we can (should) lead... Metrics reporting is the foundation for analytics Start with what you have! Don’t wait for student characteristics and detailed database information; LMS data can provide significant insights If there’s any ed tech software folks in the audience, please help us with better reporting!
  • 28.
    Thank you! John Whitmer,Ed.D. john.whitmer@blackboard.com @johncwhitmer

Editor's Notes

  • #17 John
  • #18 Weekly reports; triggered students sent email “interventions” (low intensity)
  • #19 Talking points: Almost ¾ of students got at least one trigger in each course More PSY students got interventions than Stat students (b/c not completing homework) The pattern of the # of interventions in both courses is about the same – high up to 2-3, then trails off. Interesting findings – when consider that the triggers were very different between courses (e.g. PSY only 2 graded items, PSY: Online Homework, Stat: Online Quizzes. Etc).
  • #23 These graphs illustrate that DECREASES in triggers are related to INCREASES in student grade. (explanation: Each dot is a student; Y axis is the total points (lower to higher), and X axis is the total # of triggers (higher to lower)) Significantly significant results for both courses; possibility due to chance less than 1 in 1,000. Size of effect different: PSY: triggers explain 48% variation in final grade STAT: triggers explain 66% of variation in final grade (if remove graded items from Stat, triggers explains 49%)
  • #30 Overall, SDSU sees this as a differentiator and as a way to help us reach our graduation rate improvement targets. It is also helping us with our course redesign efforts.