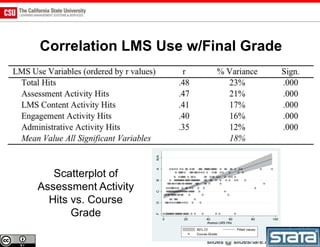
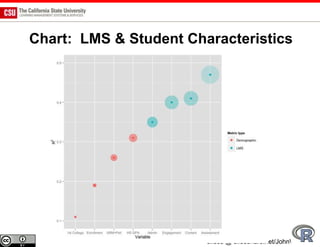
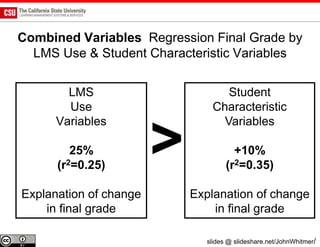
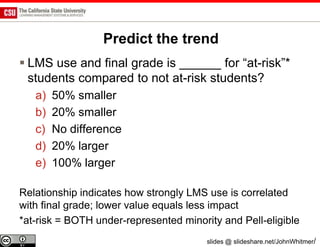
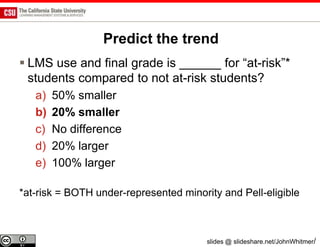
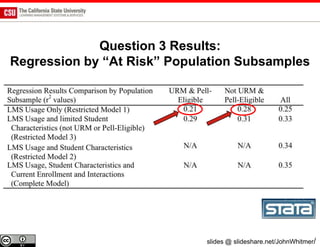
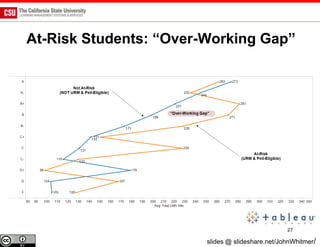
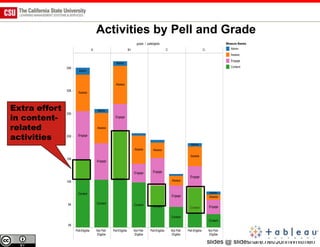
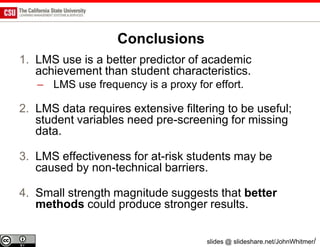
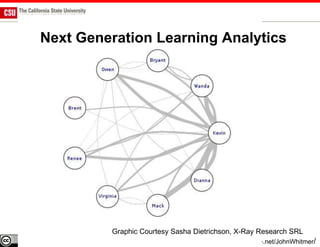
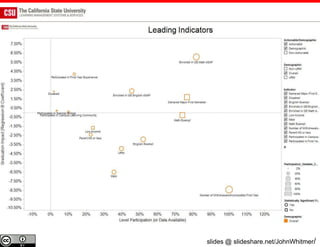
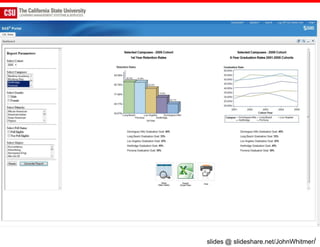
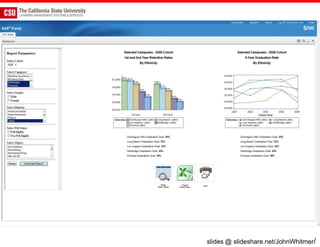
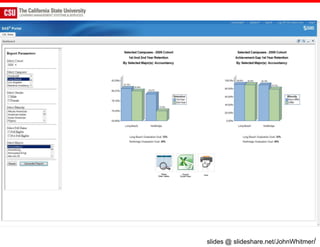
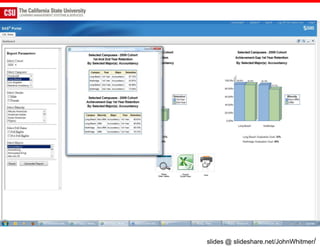
Improving Student Achievement with
     New Approaches to Data:
       Learning Analytics &
     the CSU Data Dashboard

                     John Whitmer, Ed.D.
                Academic Technology Services
     California State University, Office of the Chancellor

                   WASC ARC Conference
                        April 11, 2013
                                      slides @ slideshare.net/JohnWhitmer/
Outline
1. Context: California State University &
   Graduation Initiative

2. Chico State Learning Analytics Case Study

3. CSU Data Dashboard Project

4. Next Steps

5. Discussion

                                  slides @ slideshare.net/JohnWhitmer/
1. CONTEXT


             slides @ slideshare.net/JohnWhitmer/
California State University
             http://calstate.edu
 23 campuses
 437,000 FTE students
 44,000 faculty and staff
 Largest, most diverse, &
  one of the most
  affordable university
  systems in the country
 Play a vital role in the
  growth & development of
  California's communities
  and economy
                             slides @ slideshare.net/JohnWhitmer/
CSU Achievement Gap


               slides @ slideshare.net/JohnWhitmer/
.
– Baseline 6-Year Graduation Rate:         46%
– Target 6-Year Graduation Rate:           54%

– Baseline Achievement Gap:                11%
– Target Achievement Gap:                  5.5%


                                                                  2
                               slides @ slideshare.net/JohnWhitmer/
New Approaches to Using Data
Enable data-driven decision making for
interventions earlier in the student experience by

   1. Integrate new data sources & variables

   2. Disseminate findings to a broader audience

   3. Provide ability to interact with data analysis,
      conduct ad-hoc and custom reporting


                                    slides @ slideshare.net/JohnWhitmer/
2. CHICO STATE LEARNING
ANALYTICS CASE STUDY

                  slides @ slideshare.net/JohnWhitmer/
200MB of data emissions annually!
Economist. (2010, 11/4/2010). Augmented business: Smart systems will disrupt lots of industries, and perhaps the entire economy.
   The Economist.
                                                                             slides @ slideshare.net/JohnWhitmer/
Logged into course within 24
                                               hours

                                        Interacts frequently in
                                          discussion boards

                                           Failed first exam

                                       Hasn’t taken college-level
                                                 math
Source: jisc_infonet @ Flickr.com
                                          No declared major


   Source: jisc_infonet @ Flickr.com          slides @ slideshare.net/JohnWhitmer/
Case Study: Intro to Religious Studies
•   Undergraduate, introductory, high
    demand
                                                       54 F’s
•   Redesigned to hybrid delivery format
    through “academy eLearning program”

•   Enrollment: 373 students
    (54% increase on largest section)

•   Highest LMS (Vista) usage
    entire campus Fall 2010
    (>250k hits)

•   Bimodal outcomes compared to
    traditional course
    •    10% increase on final exam
    •    7% & 11% increase in DWF

•   Why? Can’t tell with aggregated data
                                           slides @ slideshare.net/JohnWhitmer/
slides @ slideshare.net/JohnWhitmer/
Learner Analytics

“ ... measurement, collection, analysis and
  reporting of data about learners and their
  contexts, for purposes of understanding and
  optimizing learning and the environments in
  which it occurs.” (Siemens, 2011)


                               slides @ slideshare.net/JohnWhitmer/
Pervasive Adoption of Learning Management Systems


                                              Institution-Supported IT
                                              Resources and Tools. Reprinted
                                              from “The ECAR Study of
                                              Undergraduate Students and
                                              Information Technology,” Eden
                                              Dahlstrom, 2012 by the
                                              EDUCAUSE Center for Applied
                                              Research.

                                 slides @ slideshare.net/JohnWhitmer/
Guiding Questions
1. How is student LMS use related to academic
   achievement in a single course section?

2. How does that finding compare to the relationship of
   achievement with traditional student characteristic
   variables?

3. How are these relationships different for
   “at-risk” students (URM & Pell-eligible)?

4. What data sources, variables and methods are most
   useful to answer these questions?

                                    slides @ slideshare.net/JohnWhitmer/
LMS Use Variables              Student Char. Variables
1. Administrative Activities        1. Enrollment Status
   (calendar, announcements)        2. First in Family to Attend
2. Assessment Activities               College
   (quiz, homework, assignments,    3. Gender
   grade center)                    4. HS GPA
3. Content Activities               5. Major-College
   (web hits, PDF, content pages)
                                    6. Pell Eligible
4. Engagement Activities
   (discussion, mail)               7. URM and Pell-Eligibility
                                       Interaction
                                    8. Under-Represented
                                       Minority
                                    9. URM and Gender
                                       Interaction
                                          slides @ slideshare.net/JohnWhitmer/
Correlation: Student Char. w/Final Grade


    Scatterplot of
  HS GPA vs. Course
       Grade
                          slides @ slideshare.net/JohnWhitmer/
Predict the trend
 LMS use and final grade is _______ compared to
  student characteristics and final grade:

  a)   50% smaller
  b)   25% smaller
  c)   the same
  d)   200% larger
  e)   400% larger


                               slides @ slideshare.net/JohnWhitmer/
Predict the trend
 LMS use and final grade is _______ compared to
  student characteristics and final grade:

  a)   50% smaller
  b)   25% smaller
  c)   the same
  d)   200% larger
  e)   400% larger


                               slides @ slideshare.net/JohnWhitmer/
Correlation LMS Use w/Final Grade


   Scatterplot of
Assessment Activity
  Hits vs. Course
       Grade

                      slides @ slideshare.net/JohnWhitmer/
Chart: LMS & Student Characteristics


                        slides @ slideshare.net/JohnWhitmer/
Combined Variables Regression Final Grade by
  LMS Use & Student Characteristic Variables

        LMS                        Student
        Use                     Characteristic
      Variables                   Variables

         25%
      (r2=0.25)
                        >             +10%
                                    (r2=0.35)

Explanation of change       Explanation of change
    in final grade              in final grade

                              slides @ slideshare.net/JohnWhitmer/
Predict the trend
 LMS use and final grade is ______ for “at-risk”*
  students compared to not at-risk students?
   a)   50% smaller
   b)   20% smaller
   c)   No difference
   d)   20% larger
   e)   100% larger

Relationship indicates how strongly LMS use is correlated
with final grade; lower value equals less impact
*at-risk = BOTH under-represented minority and Pell-eligible
                                        slides @ slideshare.net/JohnWhitmer/
Predict the trend
 LMS use and final grade is ______ for “at-risk”*
  students compared to not at-risk students?
   a)   50% smaller
   b)   20% smaller
   c)   No difference
   d)   20% larger
   e)   100% larger

*at-risk = BOTH under-represented minority and Pell-eligible


                                        slides @ slideshare.net/JohnWhitmer/
Question 3 Results:
Regression by “At Risk” Population Subsamples


                             slides @ slideshare.net/JohnWhitmer/
At-Risk Students: “Over-Working Gap”


                                                  27

                        slides @ slideshare.net/JohnWhitmer/
Activities by Pell and Grade


Extra effort
in content-
related
activities


                                  slides @ slideshare.net/JohnWhitmer/
Conclusions
1. LMS use is a better predictor of academic
   achievement than student characteristics.
   – LMS use frequency is a proxy for effort.

2. LMS data requires extensive filtering to be useful;
   student variables need pre-screening for missing
   data.

3. LMS effectiveness for at-risk students may be
   caused by non-technical barriers.

4. Small strength magnitude suggests that better
   methods could produce stronger results.


                                     slides @ slideshare.net/JohnWhitmer/
Next Generation Learning Analytics


         Graphic Courtesy Sasha Dietrichson, X-Ray Research SRL
                                   slides @ slideshare.net/JohnWhitmer/
3. DATA DASHBOARD PROJECT


                 slides @ slideshare.net/JohnWhitmer/
THE FRAMEWORK
Advancing by Degrees: A
Framework for Increasing
College Completion by
Offenstein, Moore &
Schulock

Institute for Higher
Education Leadership and
Policy and The Education
Trust (http://bit.ly/10QtMXC)


                                slides @ slideshare.net/JohnWhitmer/
This research describes
academic patterns (or leading
indicators) that occur early in
the pipeline that can be tracked
and monitored in real time
against milestones on the
graduation route.


                     slides @ slideshare.net/JohnWhitmer/
Milestones                                 Leading Indicators
  Year-to-year Retention                   Remediation
  Transition to college level coursework     Begin remedial coursework in the first term, if
  (English and Math)                         needed.
  Earn one year of college level credits     Complete needed remediation
  Complete General Education
  Complete degree                          Gateway Courses
                                              Complete college-level math and/or English in
                                              the first or second year
                                              Complete a college-success course or other
                                              first-year experience program

                                           Credit Accumulation and Related Academic
                                           Behaviors
                                              Complete high percentage of courses
                                              attempted (low rate of course dropping and/or
                                              failure)
                                              Complete 20-30 credits in the first year
                                              Earn summer credits
                                              Enroll full time
                                              Enroll continuously, without stop-outs
                                              Register on-time for courses
                                              Maintain adequate academic progress
                                                            slides @ slideshare.net/JohnWhitmer/
Driving Questions for Dashboard
1. What percentage of students reach each of the
   leading indicators?
2. What is the impact of reaching each of the
   leading indicators on success rate?
3. Does meeting any of the indicators reduce or
   eliminate gaps between student demographic
   groups?


                                slides @ slideshare.net/JohnWhitmer/
PROOF OF CONCEPT


                   slides @ slideshare.net/JohnWhitmer/
Purpose
 Demonstrate potential value of combined
  reporting and statistics

 Evaluate availability and integration of data

 Pilot potential tools in real-world scenario

 NOTE: production system may be dramatically
  different from POC, given lessons learned and
  scalability

                                    slides @ slideshare.net/JohnWhitmer/
slides @ slideshare.net/JohnWhitmer/
1. Report
Parameters


             slides @ slideshare.net/JohnWhitmer/
2. Retention Rates


                     slides @ slideshare.net/JohnWhitmer/
3. Retention Rates by URM Status


         slides @ slideshare.net/JohnWhitmer/
4. Data Export Options
                     slides @ slideshare.net/JohnWhitmer/
slides @ slideshare.net/JohnWhitmer/
Concern: Male, 2nd
Year Persistence


             slides @ slideshare.net/JohnWhitmer/
slides @ slideshare.net/JohnWhitmer/
4. NEXT STEPS


                slides @ slideshare.net/JohnWhitmer/
What’s Now … And Next
 Conducting 3 multi-campus pilots
   1. mCURL: Moodle Common Usage Reporting & Learning
      Analytics: (8 CSU & 2 UC campuses)
   2. Blackboard Analytics for Learn (3 campuses)
   3. LMS-agnostic campus surveys

 Investigating additional pilot with LMS-agnostic tool to
  move beyond “clickometry” into social network analysis,
  discourse analysis, etc.

 Raises question for MOOC research: relationship between
  student intent/motivation, student characteristics/leading
  indicators, MOOC use, and achievement

                                        slides @ slideshare.net/JohnWhitmer/
Data Dashboard

         CCA                LMS
         Data               Data

                                     Other
ERS
                                     Data
Data
                  Data              Sources
                Dashboard


                             slides @ slideshare.net/JohnWhitmer/
Feedback? Questions?

John Whitmer
jwhitmer@calstate.edu

 Monograph @
  http:www.johnwhitmer.net
 Twitter: johncwhitmer


Desdemona Cardoza
dcardoza@calstate.edu


                             slides @ slideshare.net/JohnWhitmer/

Improving Student Achievement with New Approaches to Data

  • 1.
    Improving Student Achievementwith New Approaches to Data: Learning Analytics & the CSU Data Dashboard John Whitmer, Ed.D. Academic Technology Services California State University, Office of the Chancellor WASC ARC Conference April 11, 2013 slides @ slideshare.net/JohnWhitmer/
  • 2.
    Outline 1. Context: CaliforniaState University & Graduation Initiative 2. Chico State Learning Analytics Case Study 3. CSU Data Dashboard Project 4. Next Steps 5. Discussion slides @ slideshare.net/JohnWhitmer/
  • 3.
    1. CONTEXT slides @ slideshare.net/JohnWhitmer/
  • 4.
    California State University http://calstate.edu  23 campuses  437,000 FTE students  44,000 faculty and staff  Largest, most diverse, & one of the most affordable university systems in the country  Play a vital role in the growth & development of California's communities and economy slides @ slideshare.net/JohnWhitmer/
  • 5.
    CSU Achievement Gap slides @ slideshare.net/JohnWhitmer/
  • 6.
    . – Baseline 6-YearGraduation Rate: 46% – Target 6-Year Graduation Rate: 54% – Baseline Achievement Gap: 11% – Target Achievement Gap: 5.5% 2 slides @ slideshare.net/JohnWhitmer/
  • 7.
    New Approaches toUsing Data Enable data-driven decision making for interventions earlier in the student experience by 1. Integrate new data sources & variables 2. Disseminate findings to a broader audience 3. Provide ability to interact with data analysis, conduct ad-hoc and custom reporting slides @ slideshare.net/JohnWhitmer/
  • 8.
    2. CHICO STATELEARNING ANALYTICS CASE STUDY slides @ slideshare.net/JohnWhitmer/
  • 9.
    200MB of dataemissions annually! Economist. (2010, 11/4/2010). Augmented business: Smart systems will disrupt lots of industries, and perhaps the entire economy. The Economist. slides @ slideshare.net/JohnWhitmer/
  • 10.
    Logged into coursewithin 24 hours Interacts frequently in discussion boards Failed first exam Hasn’t taken college-level math Source: jisc_infonet @ Flickr.com No declared major Source: jisc_infonet @ Flickr.com slides @ slideshare.net/JohnWhitmer/
  • 11.
    Case Study: Introto Religious Studies • Undergraduate, introductory, high demand 54 F’s • Redesigned to hybrid delivery format through “academy eLearning program” • Enrollment: 373 students (54% increase on largest section) • Highest LMS (Vista) usage entire campus Fall 2010 (>250k hits) • Bimodal outcomes compared to traditional course • 10% increase on final exam • 7% & 11% increase in DWF • Why? Can’t tell with aggregated data slides @ slideshare.net/JohnWhitmer/
  • 12.
  • 13.
    Learner Analytics “ ...measurement, collection, analysis and reporting of data about learners and their contexts, for purposes of understanding and optimizing learning and the environments in which it occurs.” (Siemens, 2011) slides @ slideshare.net/JohnWhitmer/
  • 14.
    Pervasive Adoption ofLearning Management Systems Institution-Supported IT Resources and Tools. Reprinted from “The ECAR Study of Undergraduate Students and Information Technology,” Eden Dahlstrom, 2012 by the EDUCAUSE Center for Applied Research. slides @ slideshare.net/JohnWhitmer/
  • 15.
    Guiding Questions 1. Howis student LMS use related to academic achievement in a single course section? 2. How does that finding compare to the relationship of achievement with traditional student characteristic variables? 3. How are these relationships different for “at-risk” students (URM & Pell-eligible)? 4. What data sources, variables and methods are most useful to answer these questions? slides @ slideshare.net/JohnWhitmer/
  • 16.
    LMS Use Variables Student Char. Variables 1. Administrative Activities 1. Enrollment Status (calendar, announcements) 2. First in Family to Attend 2. Assessment Activities College (quiz, homework, assignments, 3. Gender grade center) 4. HS GPA 3. Content Activities 5. Major-College (web hits, PDF, content pages) 6. Pell Eligible 4. Engagement Activities (discussion, mail) 7. URM and Pell-Eligibility Interaction 8. Under-Represented Minority 9. URM and Gender Interaction slides @ slideshare.net/JohnWhitmer/
  • 17.
    Correlation: Student Char.w/Final Grade Scatterplot of HS GPA vs. Course Grade slides @ slideshare.net/JohnWhitmer/
  • 18.
    Predict the trend LMS use and final grade is _______ compared to student characteristics and final grade: a) 50% smaller b) 25% smaller c) the same d) 200% larger e) 400% larger slides @ slideshare.net/JohnWhitmer/
  • 19.
    Predict the trend LMS use and final grade is _______ compared to student characteristics and final grade: a) 50% smaller b) 25% smaller c) the same d) 200% larger e) 400% larger slides @ slideshare.net/JohnWhitmer/
  • 20.
    Correlation LMS Usew/Final Grade Scatterplot of Assessment Activity Hits vs. Course Grade slides @ slideshare.net/JohnWhitmer/
  • 21.
    Chart: LMS &Student Characteristics slides @ slideshare.net/JohnWhitmer/
  • 22.
    Combined Variables RegressionFinal Grade by LMS Use & Student Characteristic Variables LMS Student Use Characteristic Variables Variables 25% (r2=0.25) > +10% (r2=0.35) Explanation of change Explanation of change in final grade in final grade slides @ slideshare.net/JohnWhitmer/
  • 23.
    Predict the trend LMS use and final grade is ______ for “at-risk”* students compared to not at-risk students? a) 50% smaller b) 20% smaller c) No difference d) 20% larger e) 100% larger Relationship indicates how strongly LMS use is correlated with final grade; lower value equals less impact *at-risk = BOTH under-represented minority and Pell-eligible slides @ slideshare.net/JohnWhitmer/
  • 24.
    Predict the trend LMS use and final grade is ______ for “at-risk”* students compared to not at-risk students? a) 50% smaller b) 20% smaller c) No difference d) 20% larger e) 100% larger *at-risk = BOTH under-represented minority and Pell-eligible slides @ slideshare.net/JohnWhitmer/
  • 25.
    Question 3 Results: Regressionby “At Risk” Population Subsamples slides @ slideshare.net/JohnWhitmer/
  • 26.
    At-Risk Students: “Over-WorkingGap” 27 slides @ slideshare.net/JohnWhitmer/
  • 27.
    Activities by Pelland Grade Extra effort in content- related activities slides @ slideshare.net/JohnWhitmer/
  • 28.
    Conclusions 1. LMS useis a better predictor of academic achievement than student characteristics. – LMS use frequency is a proxy for effort. 2. LMS data requires extensive filtering to be useful; student variables need pre-screening for missing data. 3. LMS effectiveness for at-risk students may be caused by non-technical barriers. 4. Small strength magnitude suggests that better methods could produce stronger results. slides @ slideshare.net/JohnWhitmer/
  • 29.
    Next Generation LearningAnalytics Graphic Courtesy Sasha Dietrichson, X-Ray Research SRL slides @ slideshare.net/JohnWhitmer/
  • 30.
    3. DATA DASHBOARDPROJECT slides @ slideshare.net/JohnWhitmer/
  • 31.
    THE FRAMEWORK Advancing byDegrees: A Framework for Increasing College Completion by Offenstein, Moore & Schulock Institute for Higher Education Leadership and Policy and The Education Trust (http://bit.ly/10QtMXC) slides @ slideshare.net/JohnWhitmer/
  • 32.
    This research describes academicpatterns (or leading indicators) that occur early in the pipeline that can be tracked and monitored in real time against milestones on the graduation route. slides @ slideshare.net/JohnWhitmer/
  • 33.
    Milestones Leading Indicators Year-to-year Retention Remediation Transition to college level coursework Begin remedial coursework in the first term, if (English and Math) needed. Earn one year of college level credits Complete needed remediation Complete General Education Complete degree Gateway Courses Complete college-level math and/or English in the first or second year Complete a college-success course or other first-year experience program Credit Accumulation and Related Academic Behaviors Complete high percentage of courses attempted (low rate of course dropping and/or failure) Complete 20-30 credits in the first year Earn summer credits Enroll full time Enroll continuously, without stop-outs Register on-time for courses Maintain adequate academic progress slides @ slideshare.net/JohnWhitmer/
  • 34.
    Driving Questions forDashboard 1. What percentage of students reach each of the leading indicators? 2. What is the impact of reaching each of the leading indicators on success rate? 3. Does meeting any of the indicators reduce or eliminate gaps between student demographic groups? slides @ slideshare.net/JohnWhitmer/
  • 35.
    PROOF OF CONCEPT slides @ slideshare.net/JohnWhitmer/
  • 36.
    Purpose  Demonstrate potentialvalue of combined reporting and statistics  Evaluate availability and integration of data  Pilot potential tools in real-world scenario  NOTE: production system may be dramatically different from POC, given lessons learned and scalability slides @ slideshare.net/JohnWhitmer/
  • 37.
  • 38.
  • 39.
    1. Report Parameters slides @ slideshare.net/JohnWhitmer/
  • 40.
    2. Retention Rates slides @ slideshare.net/JohnWhitmer/
  • 41.
    3. Retention Ratesby URM Status slides @ slideshare.net/JohnWhitmer/
  • 42.
    4. Data ExportOptions slides @ slideshare.net/JohnWhitmer/
  • 43.
  • 44.
  • 45.
    Concern: Male, 2nd YearPersistence slides @ slideshare.net/JohnWhitmer/
  • 46.
  • 47.
  • 48.
  • 49.
  • 50.
  • 51.
    4. NEXT STEPS slides @ slideshare.net/JohnWhitmer/
  • 52.
    What’s Now …And Next  Conducting 3 multi-campus pilots 1. mCURL: Moodle Common Usage Reporting & Learning Analytics: (8 CSU & 2 UC campuses) 2. Blackboard Analytics for Learn (3 campuses) 3. LMS-agnostic campus surveys  Investigating additional pilot with LMS-agnostic tool to move beyond “clickometry” into social network analysis, discourse analysis, etc.  Raises question for MOOC research: relationship between student intent/motivation, student characteristics/leading indicators, MOOC use, and achievement slides @ slideshare.net/JohnWhitmer/
  • 53.
    Data Dashboard CCA LMS Data Data Other ERS Data Data Data Sources Dashboard slides @ slideshare.net/JohnWhitmer/
  • 54.
    Feedback? Questions? John Whitmer jwhitmer@calstate.edu Monograph @ http:www.johnwhitmer.net  Twitter: johncwhitmer Desdemona Cardoza dcardoza@calstate.edu slides @ slideshare.net/JohnWhitmer/

Editor's Notes

  • #3 Context: California State University & Graduation Initiative (5)Chico State Learning Analytics Case Study (20)CSU Data Dashboard Project (20)Next Steps (5)Q & A (10)
  • #12 Kathy
  • #17 John
  • #22 John
  • #29 John
  • #39 Opportunity: If you have large number of students not meeting a particular indicator, gives you an opportunity
  • #44 Overall graduation rates and goalsAchievement gapShows that we’re “green” for retention rates, but yellow for rates by achievement gap
  • #45 Overall graduation rates and goalsAchievement gapShows that we’re “green” for retention rates, but yellow for rates by achievement gap
  • #46 Overall graduation rates and goalsAchievement gapShows that we’re “green” for retention rates, but yellow for rates by achievement gap
  • #47 Overall graduation rates and goalsAchievement gapShows that we’re “green” for retention rates, but yellow for rates by achievement gap
  • #48 Drill into system – select multiple ethnicities. See the variation by overall ethnicity
  • #49 Select Bakersfield campus – problem in second-year retention – but no problem by achievement gap
  • #50 Bakersfield by gender – big problem for male, especially URM male students.
  • #51 Comparison between campuses – and by cohort year
  • #59 Kathy