Download to read offline

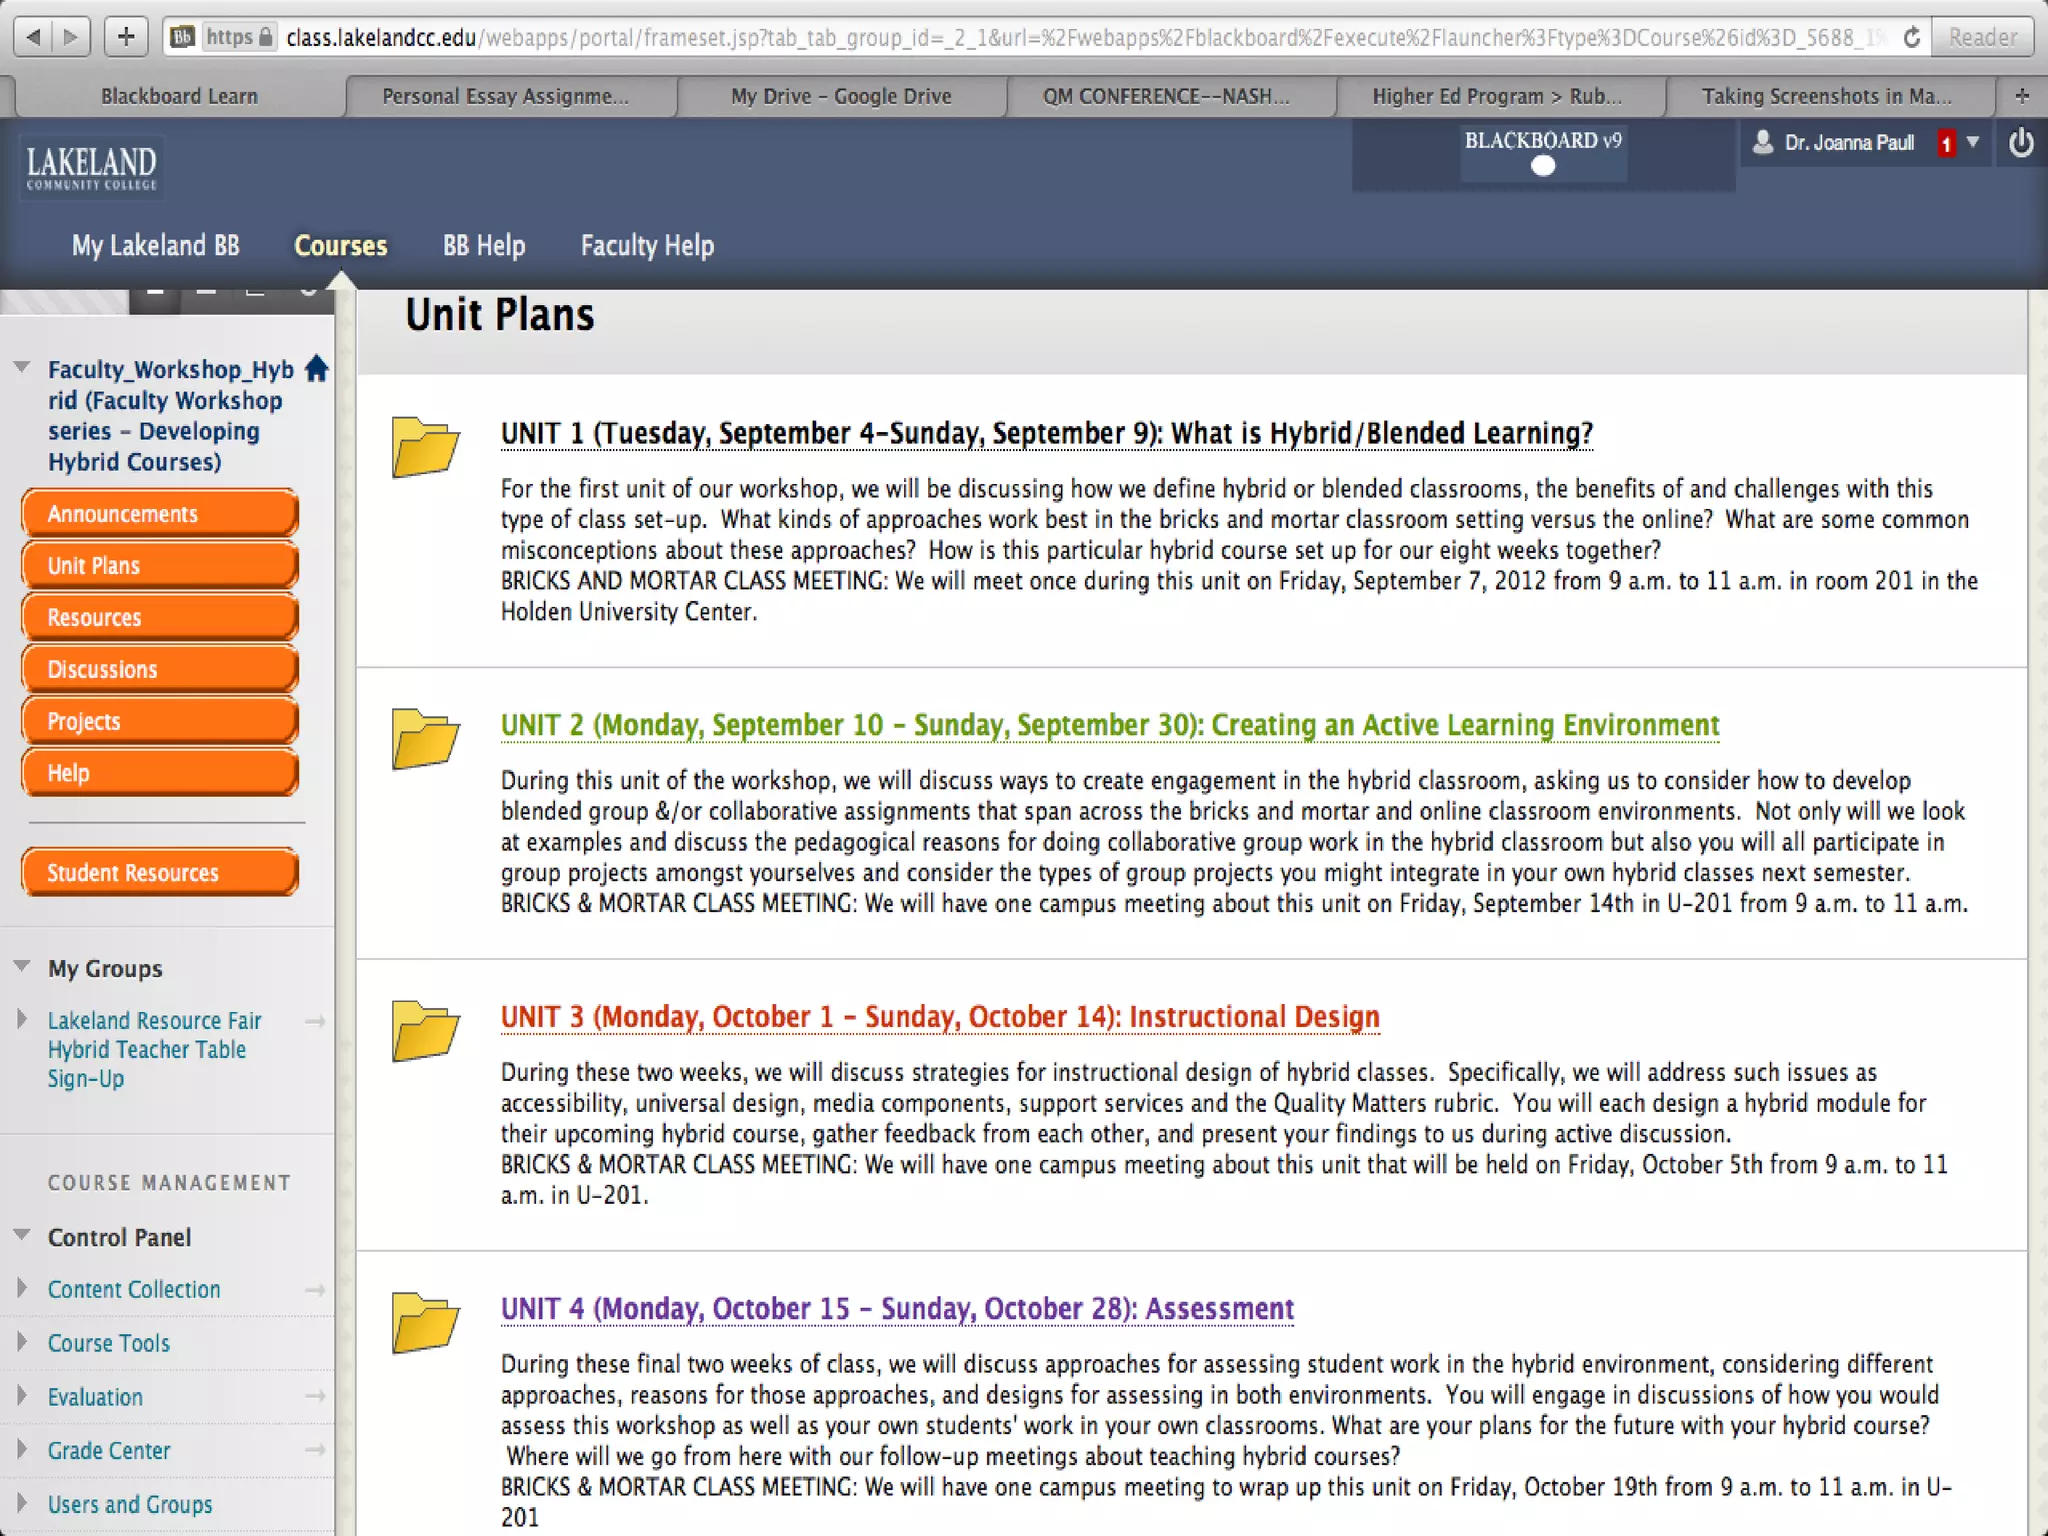
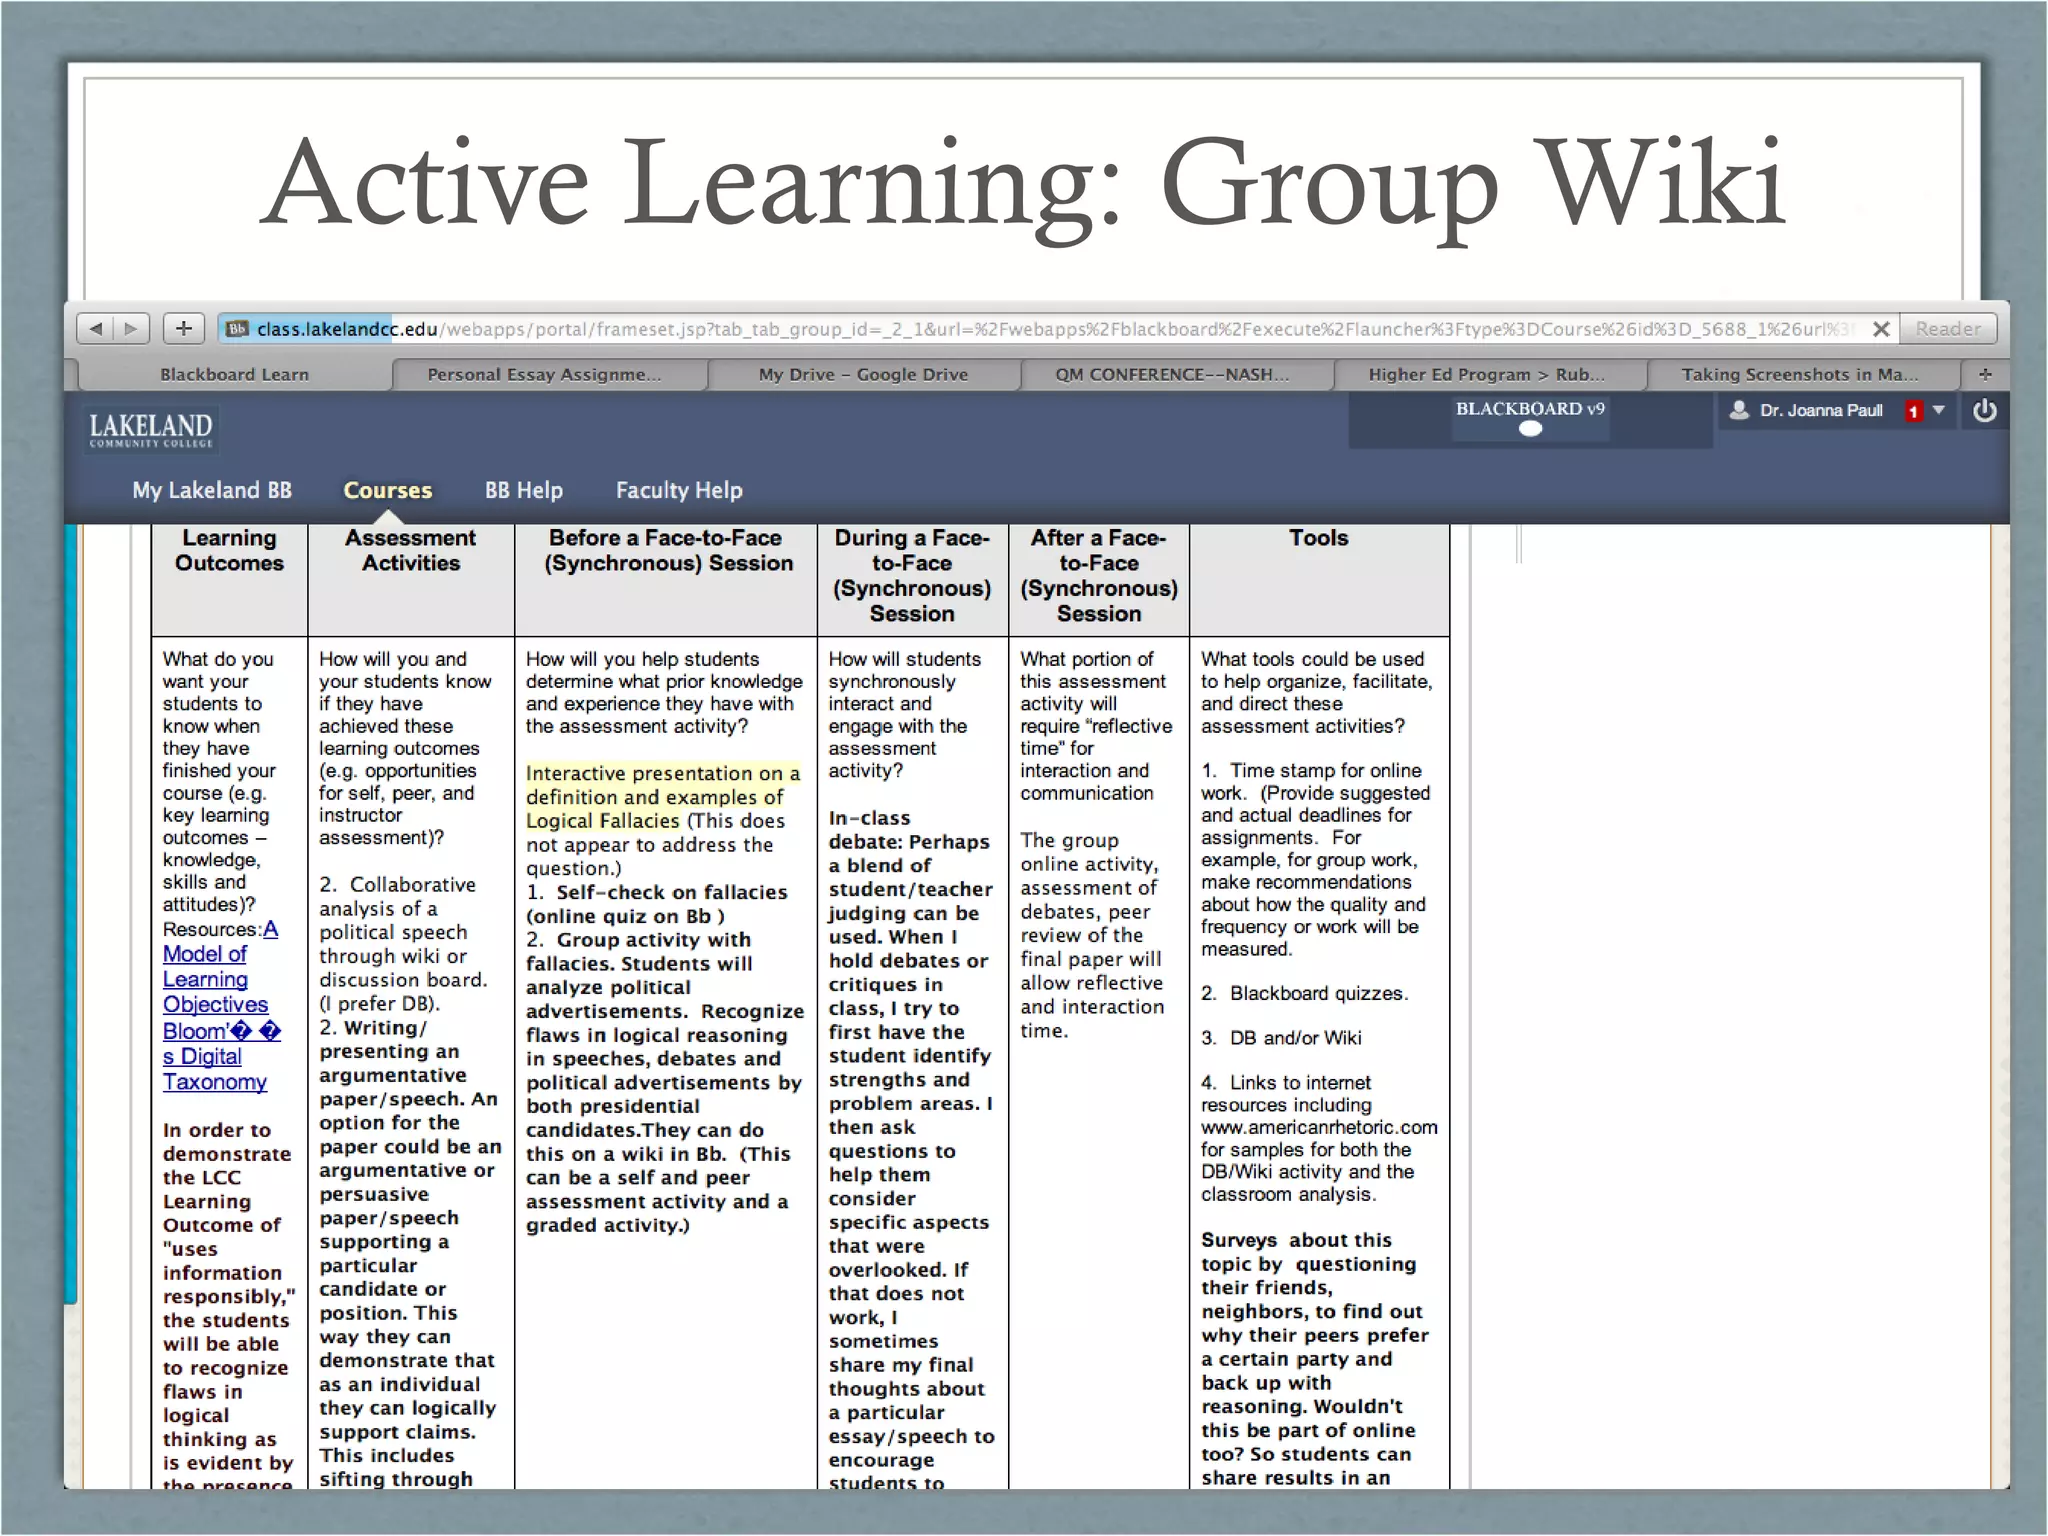
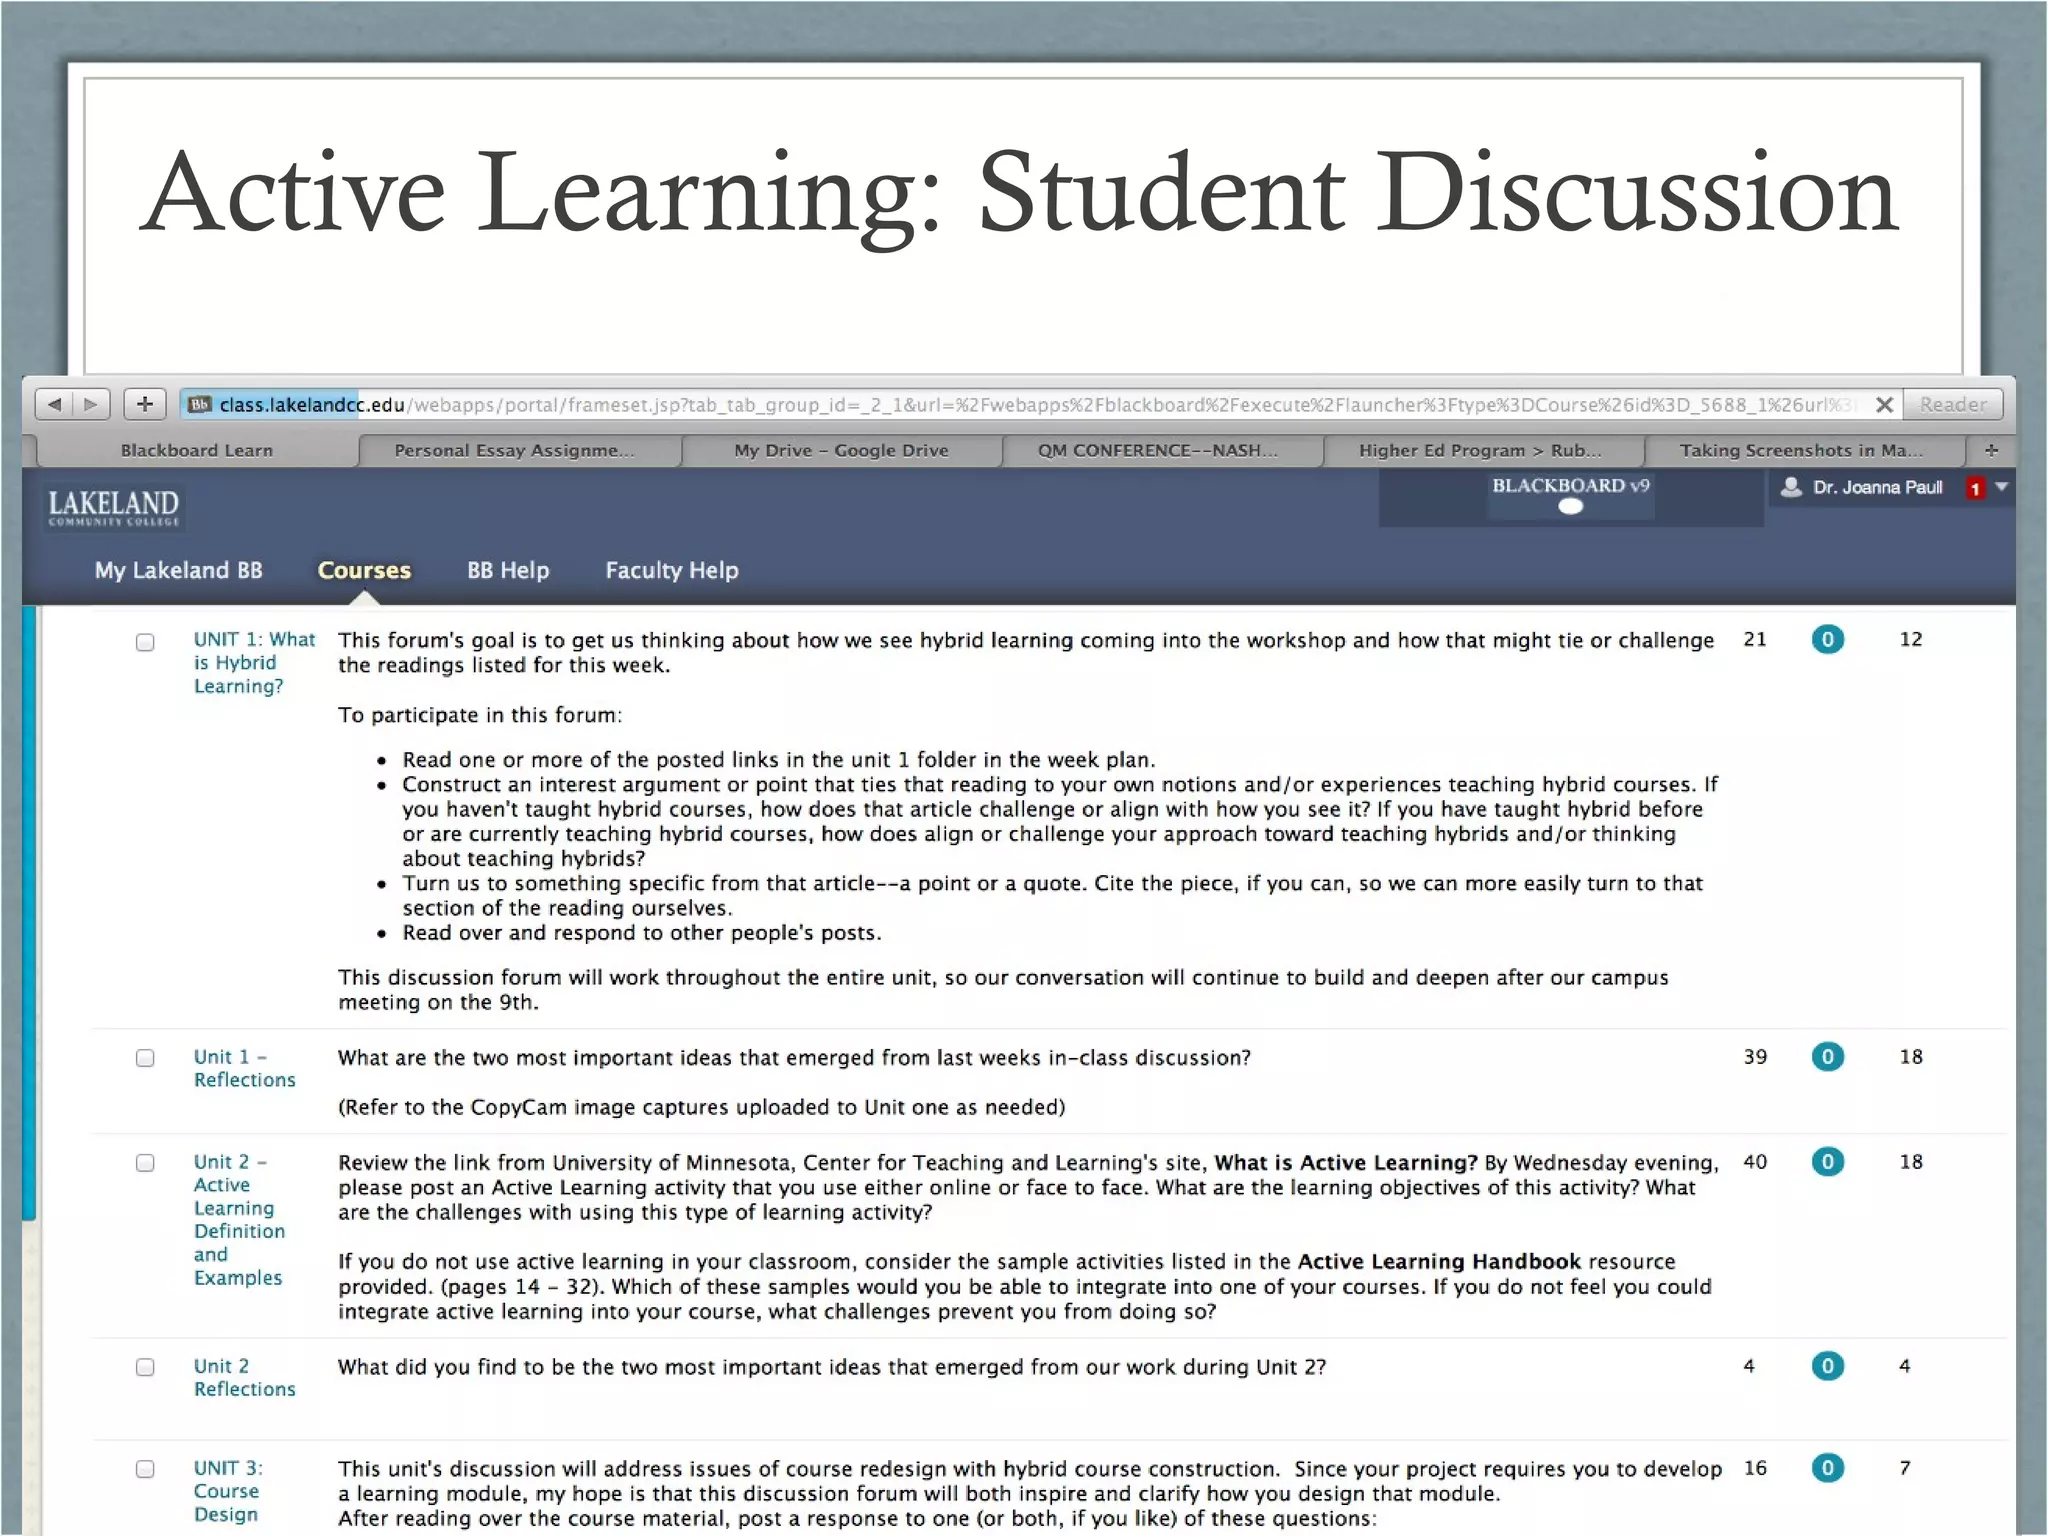
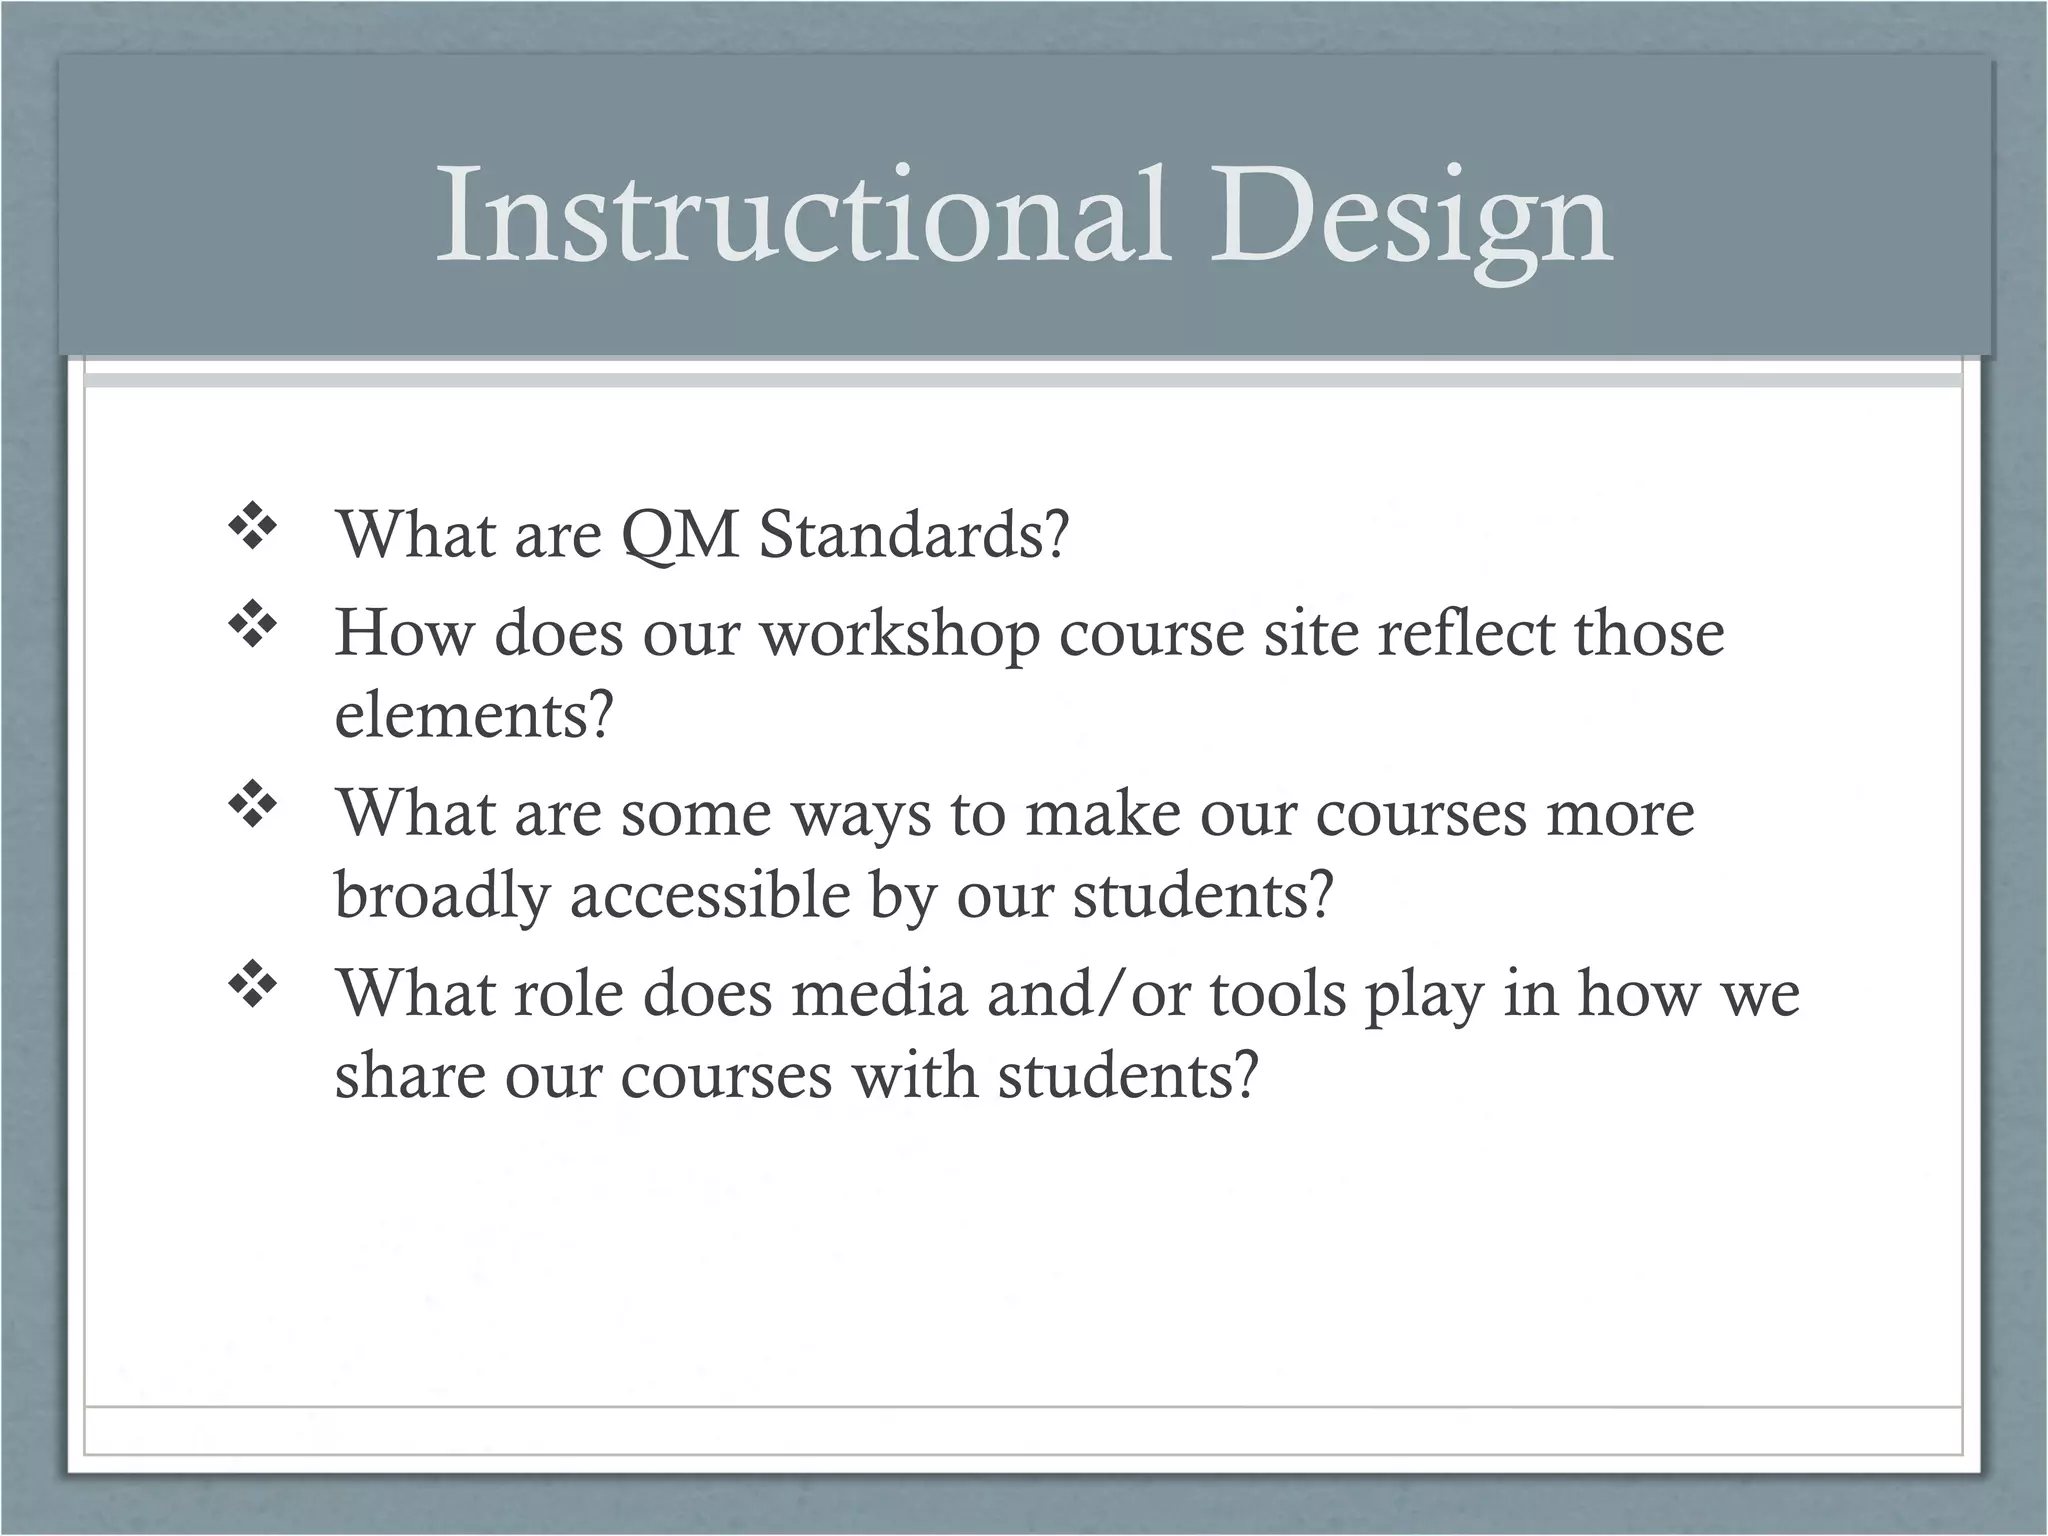
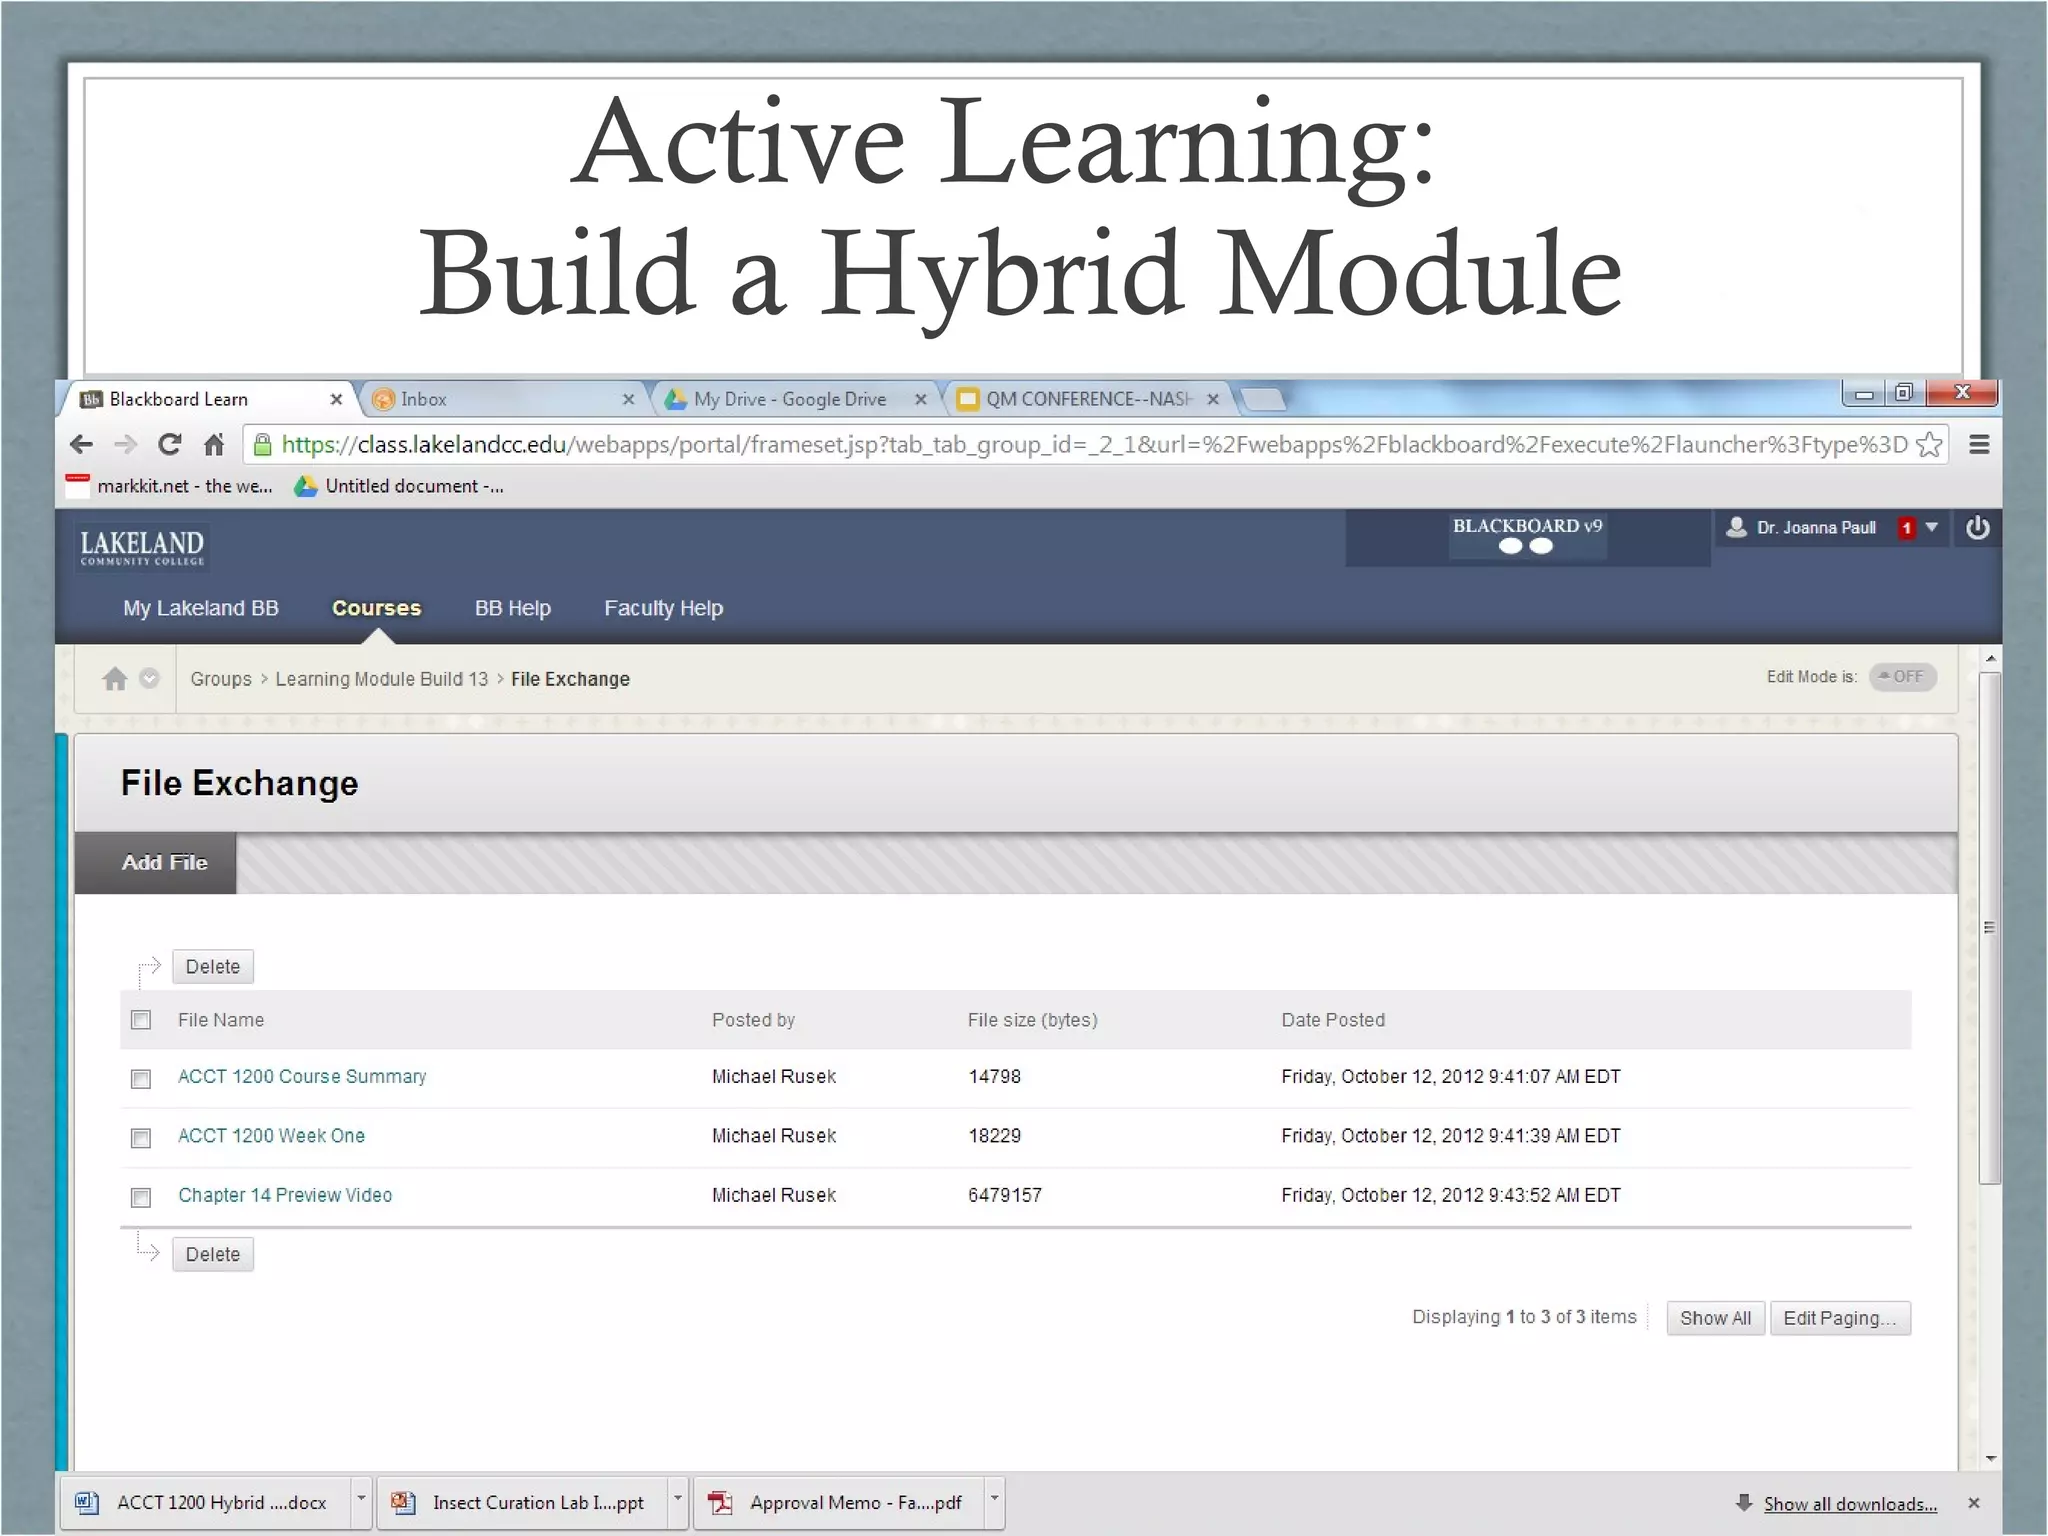
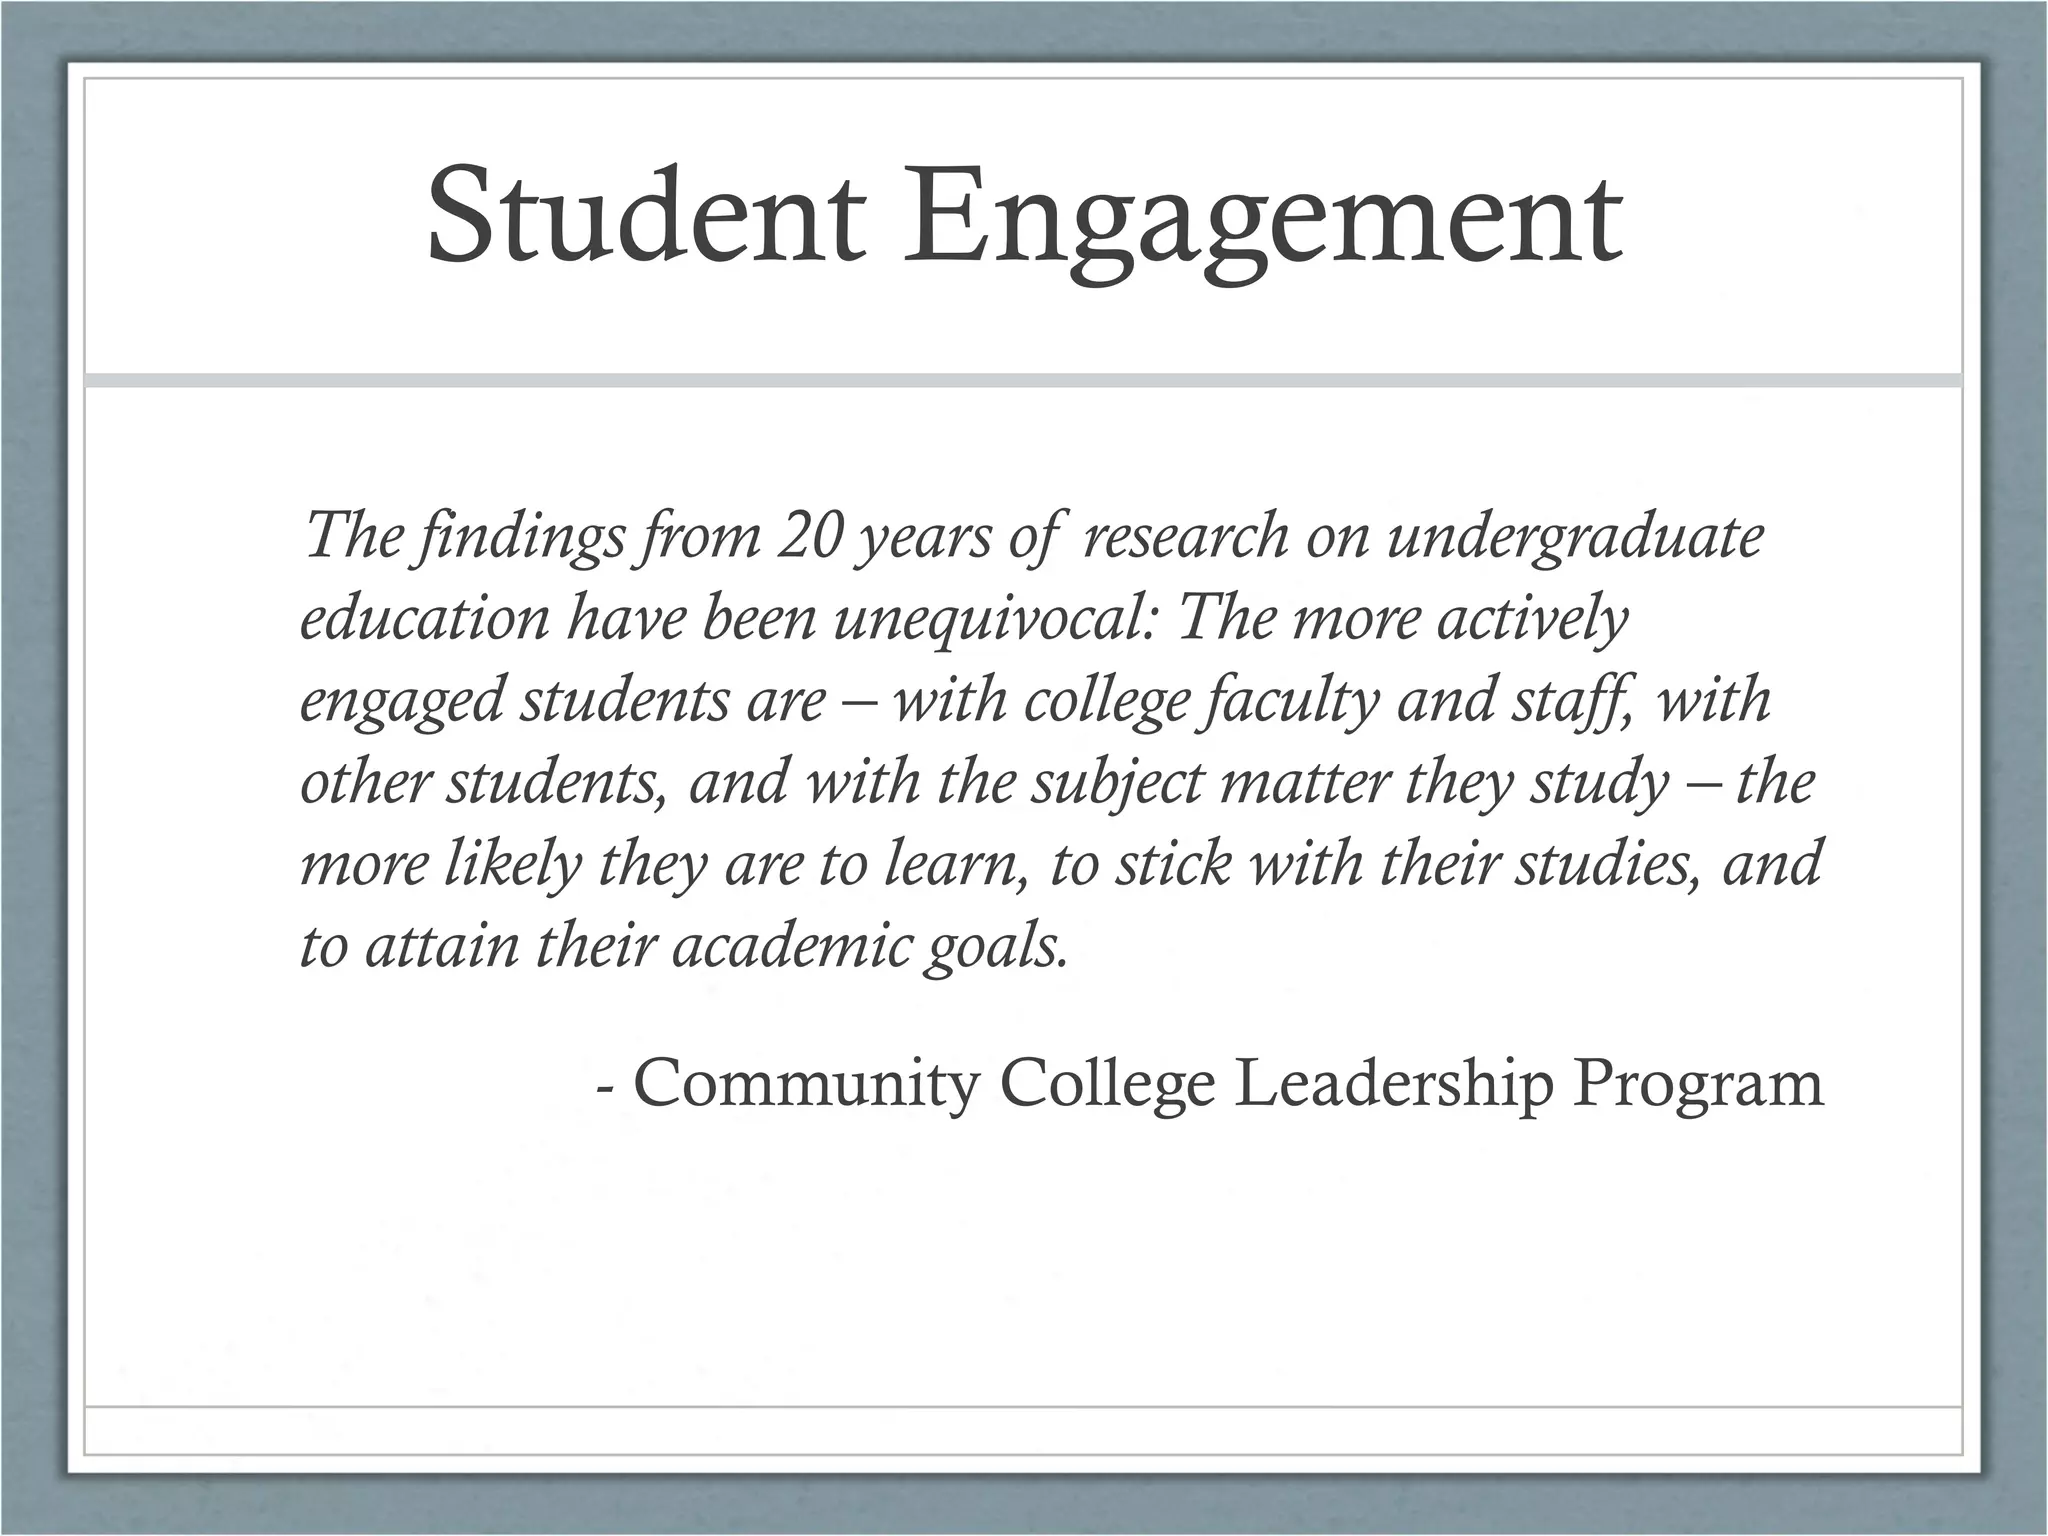
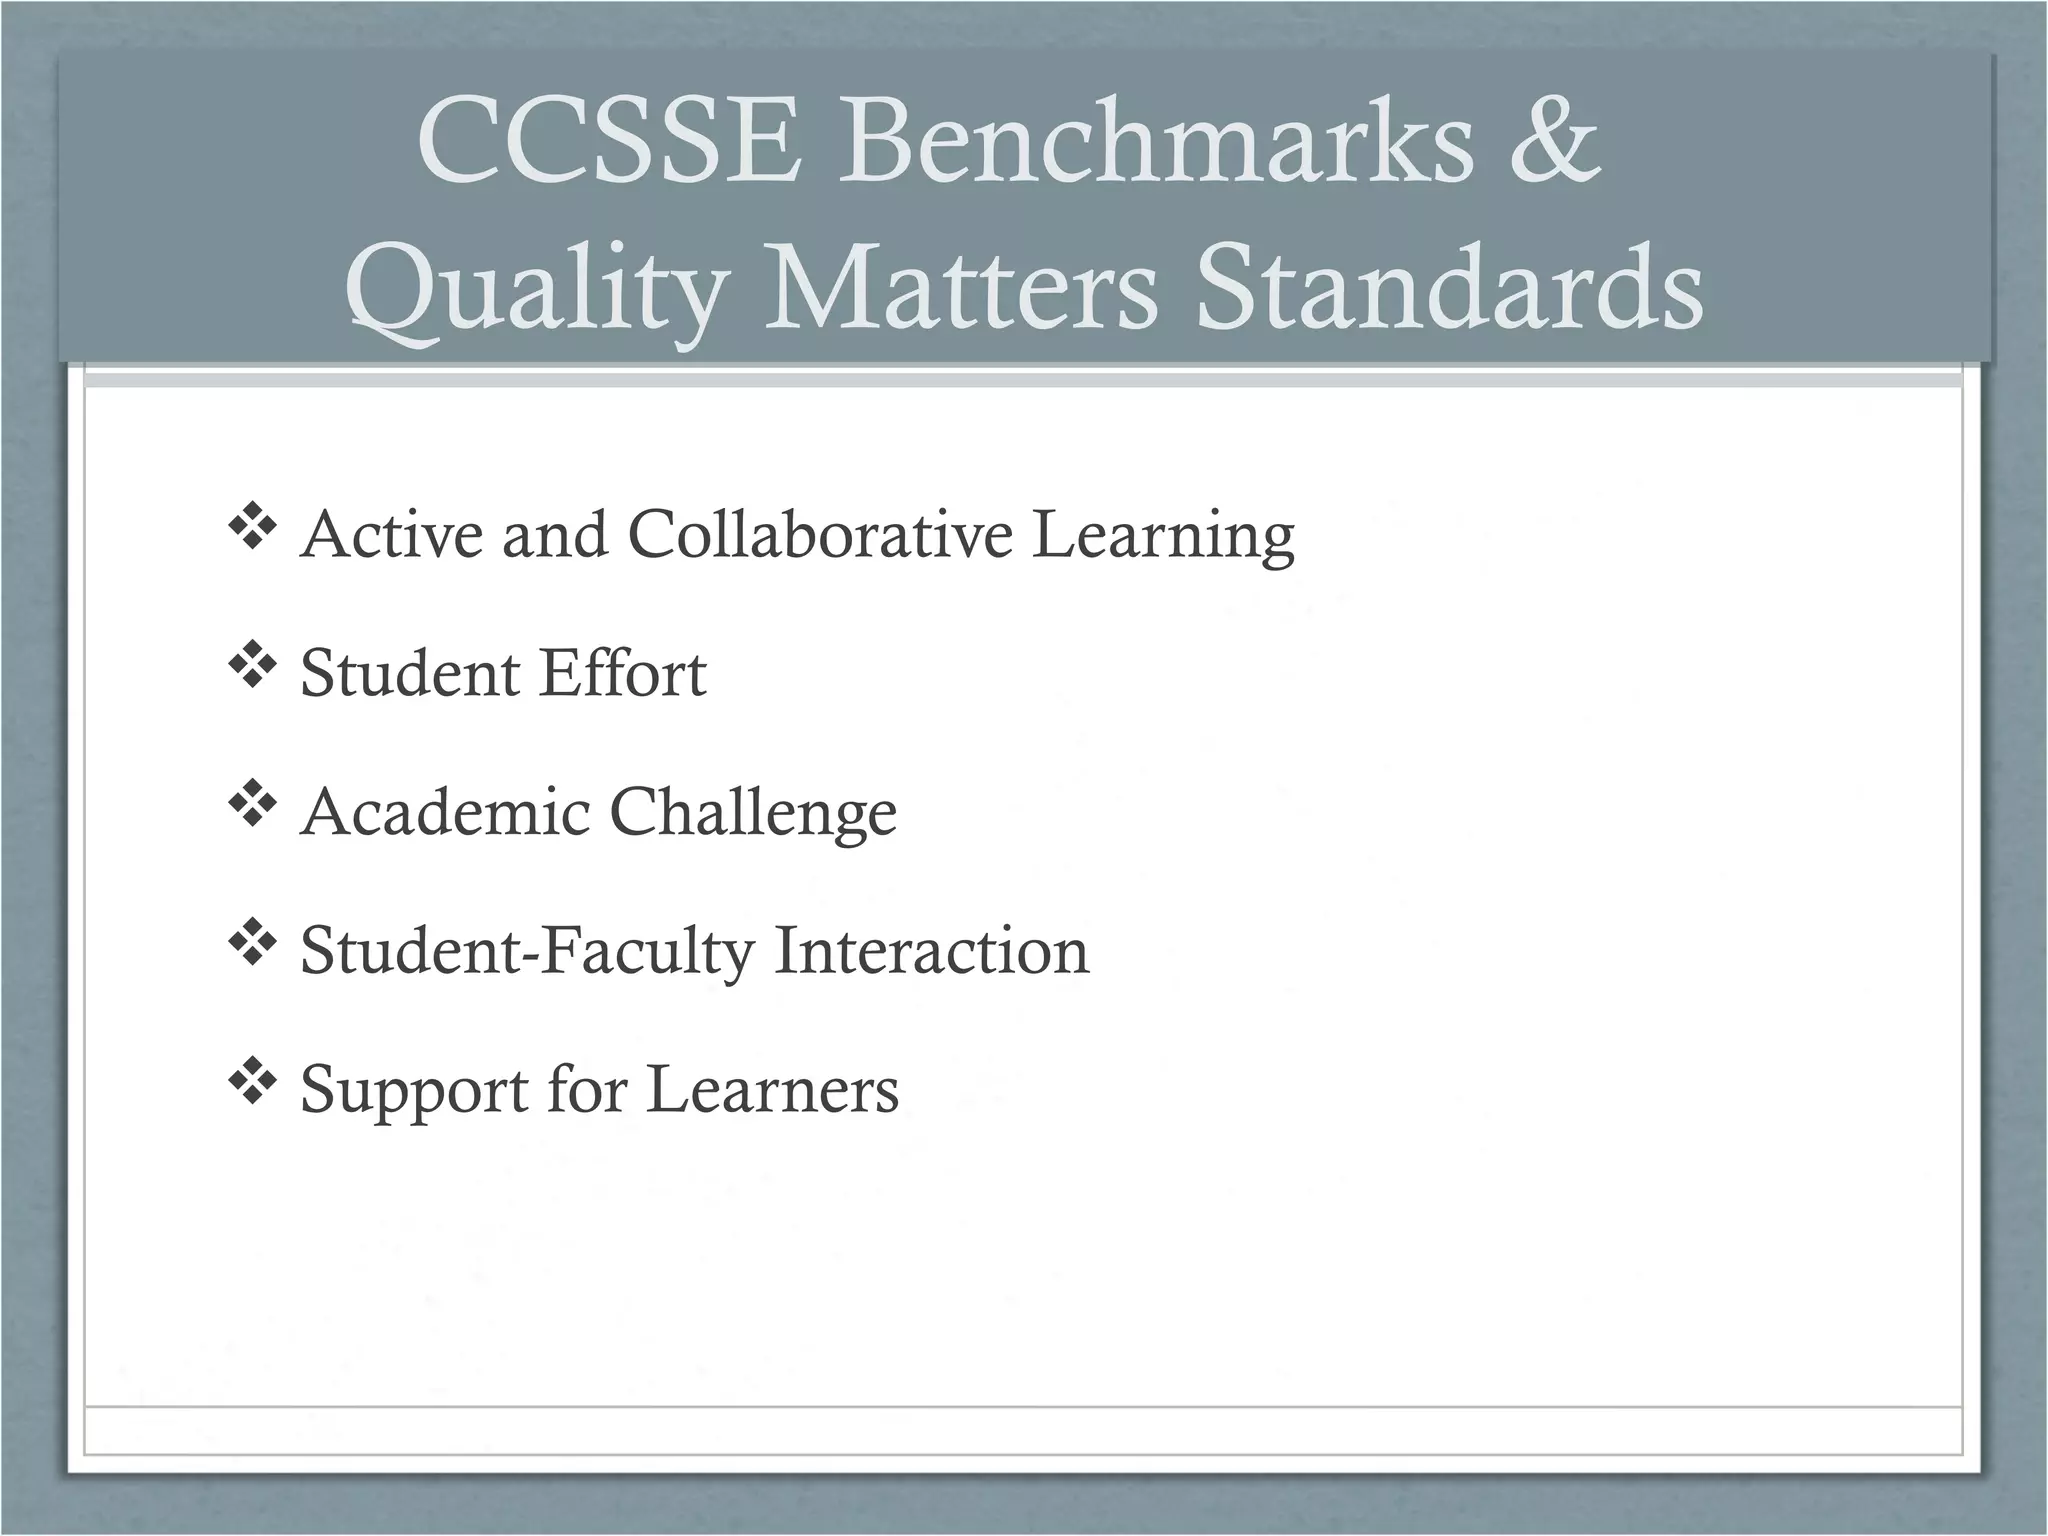
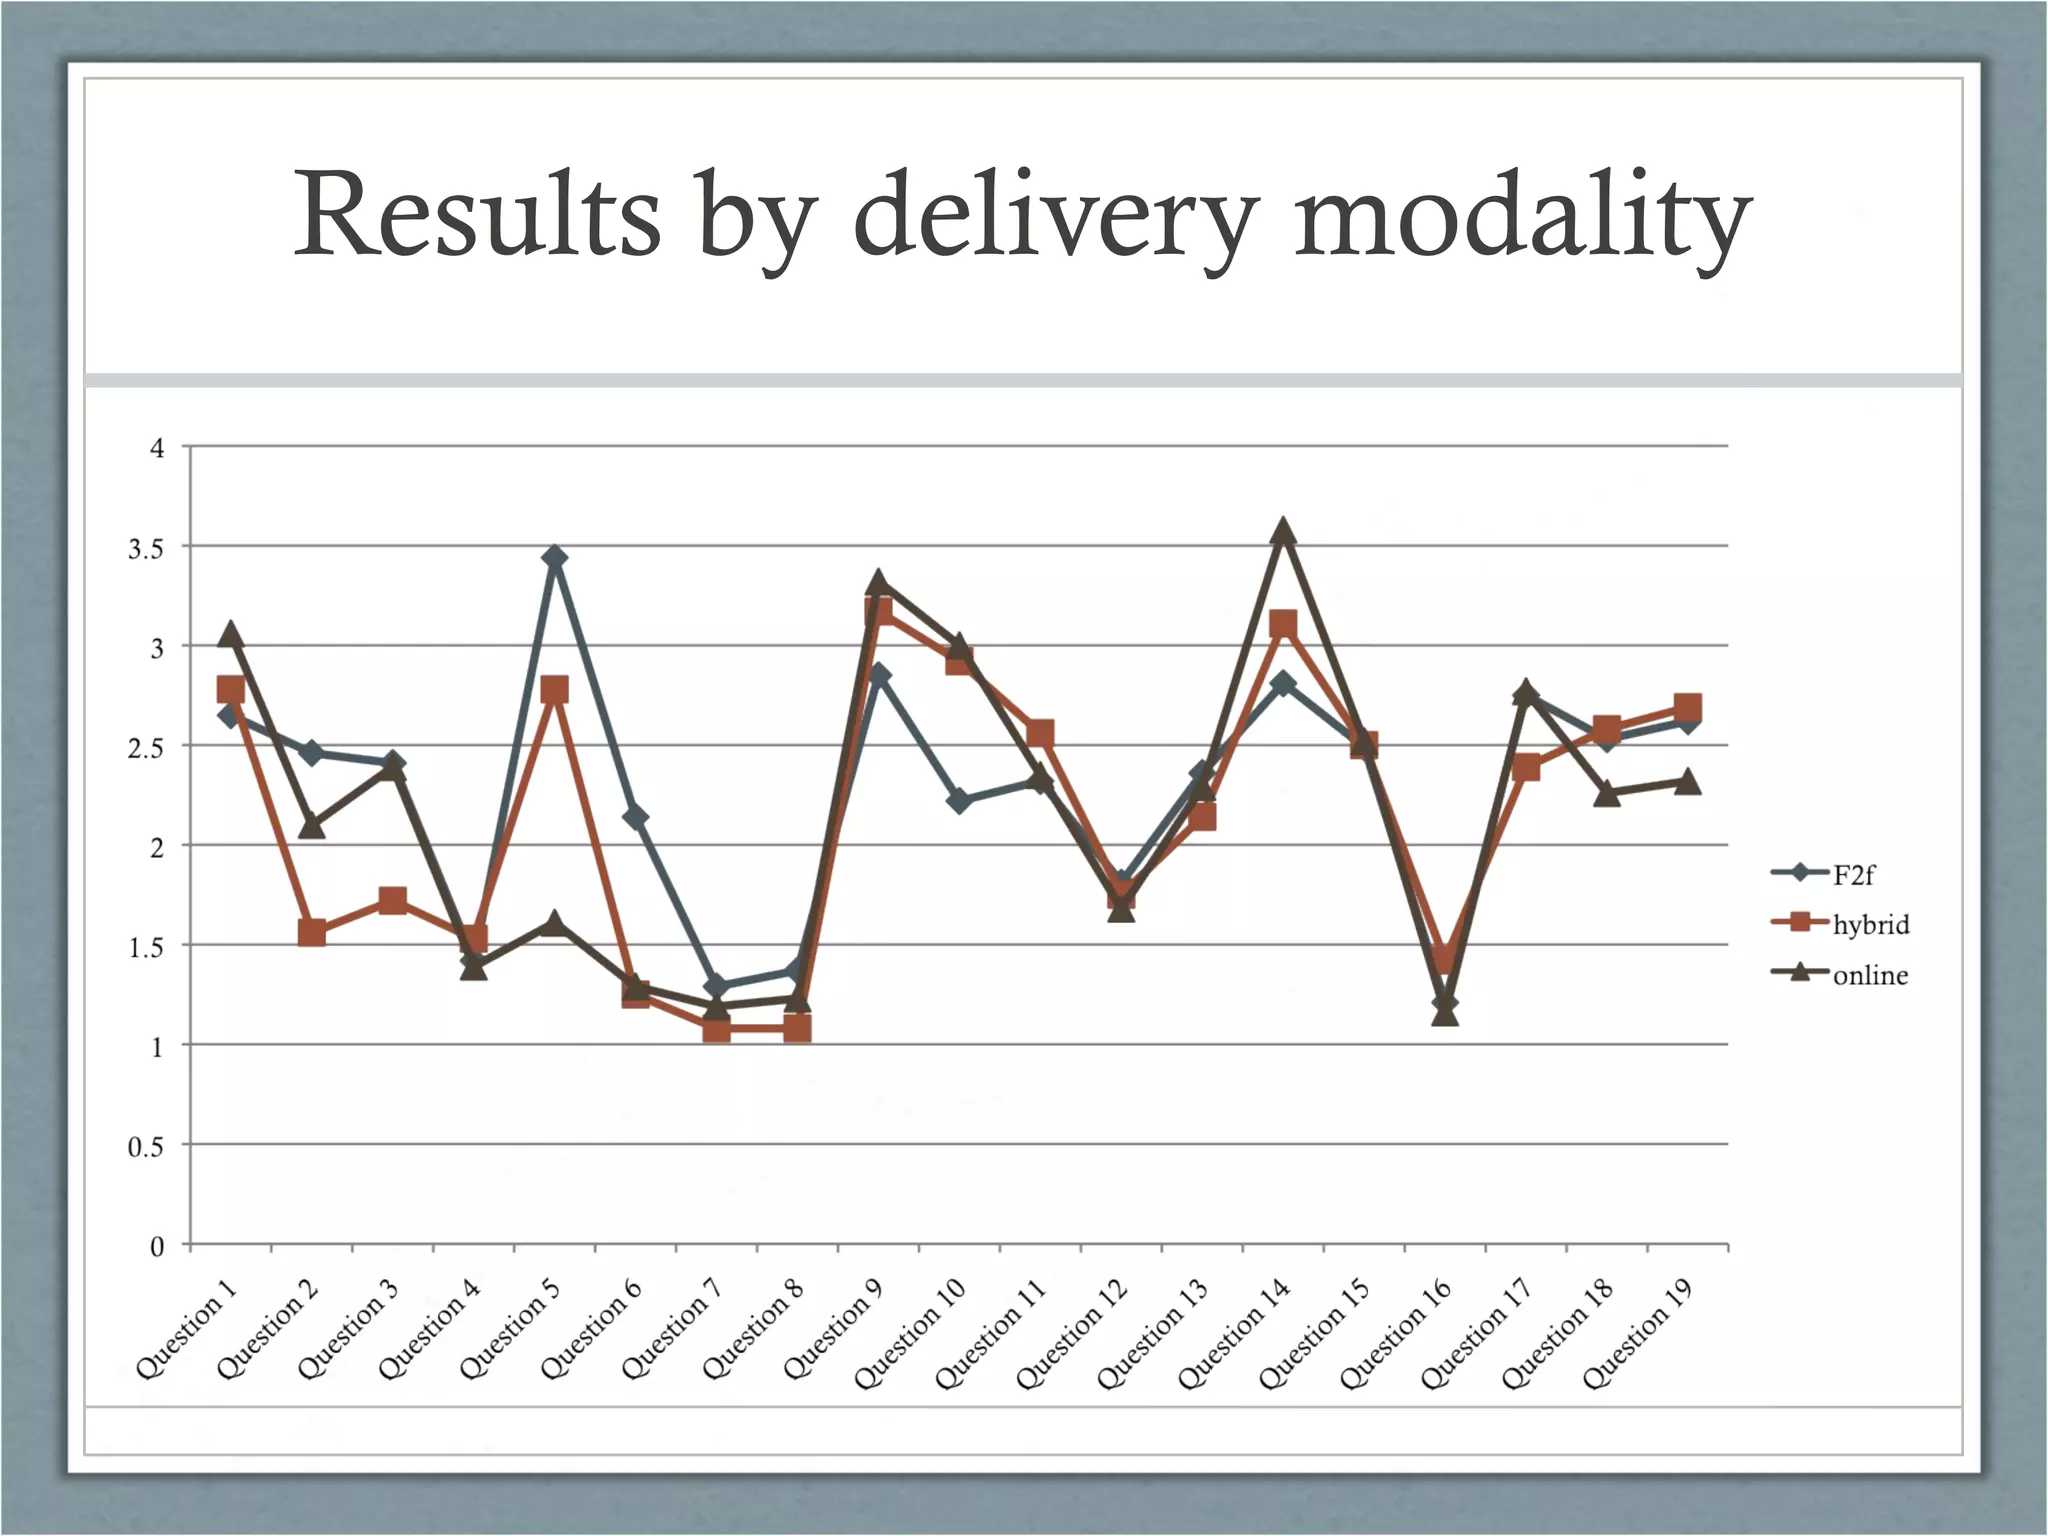
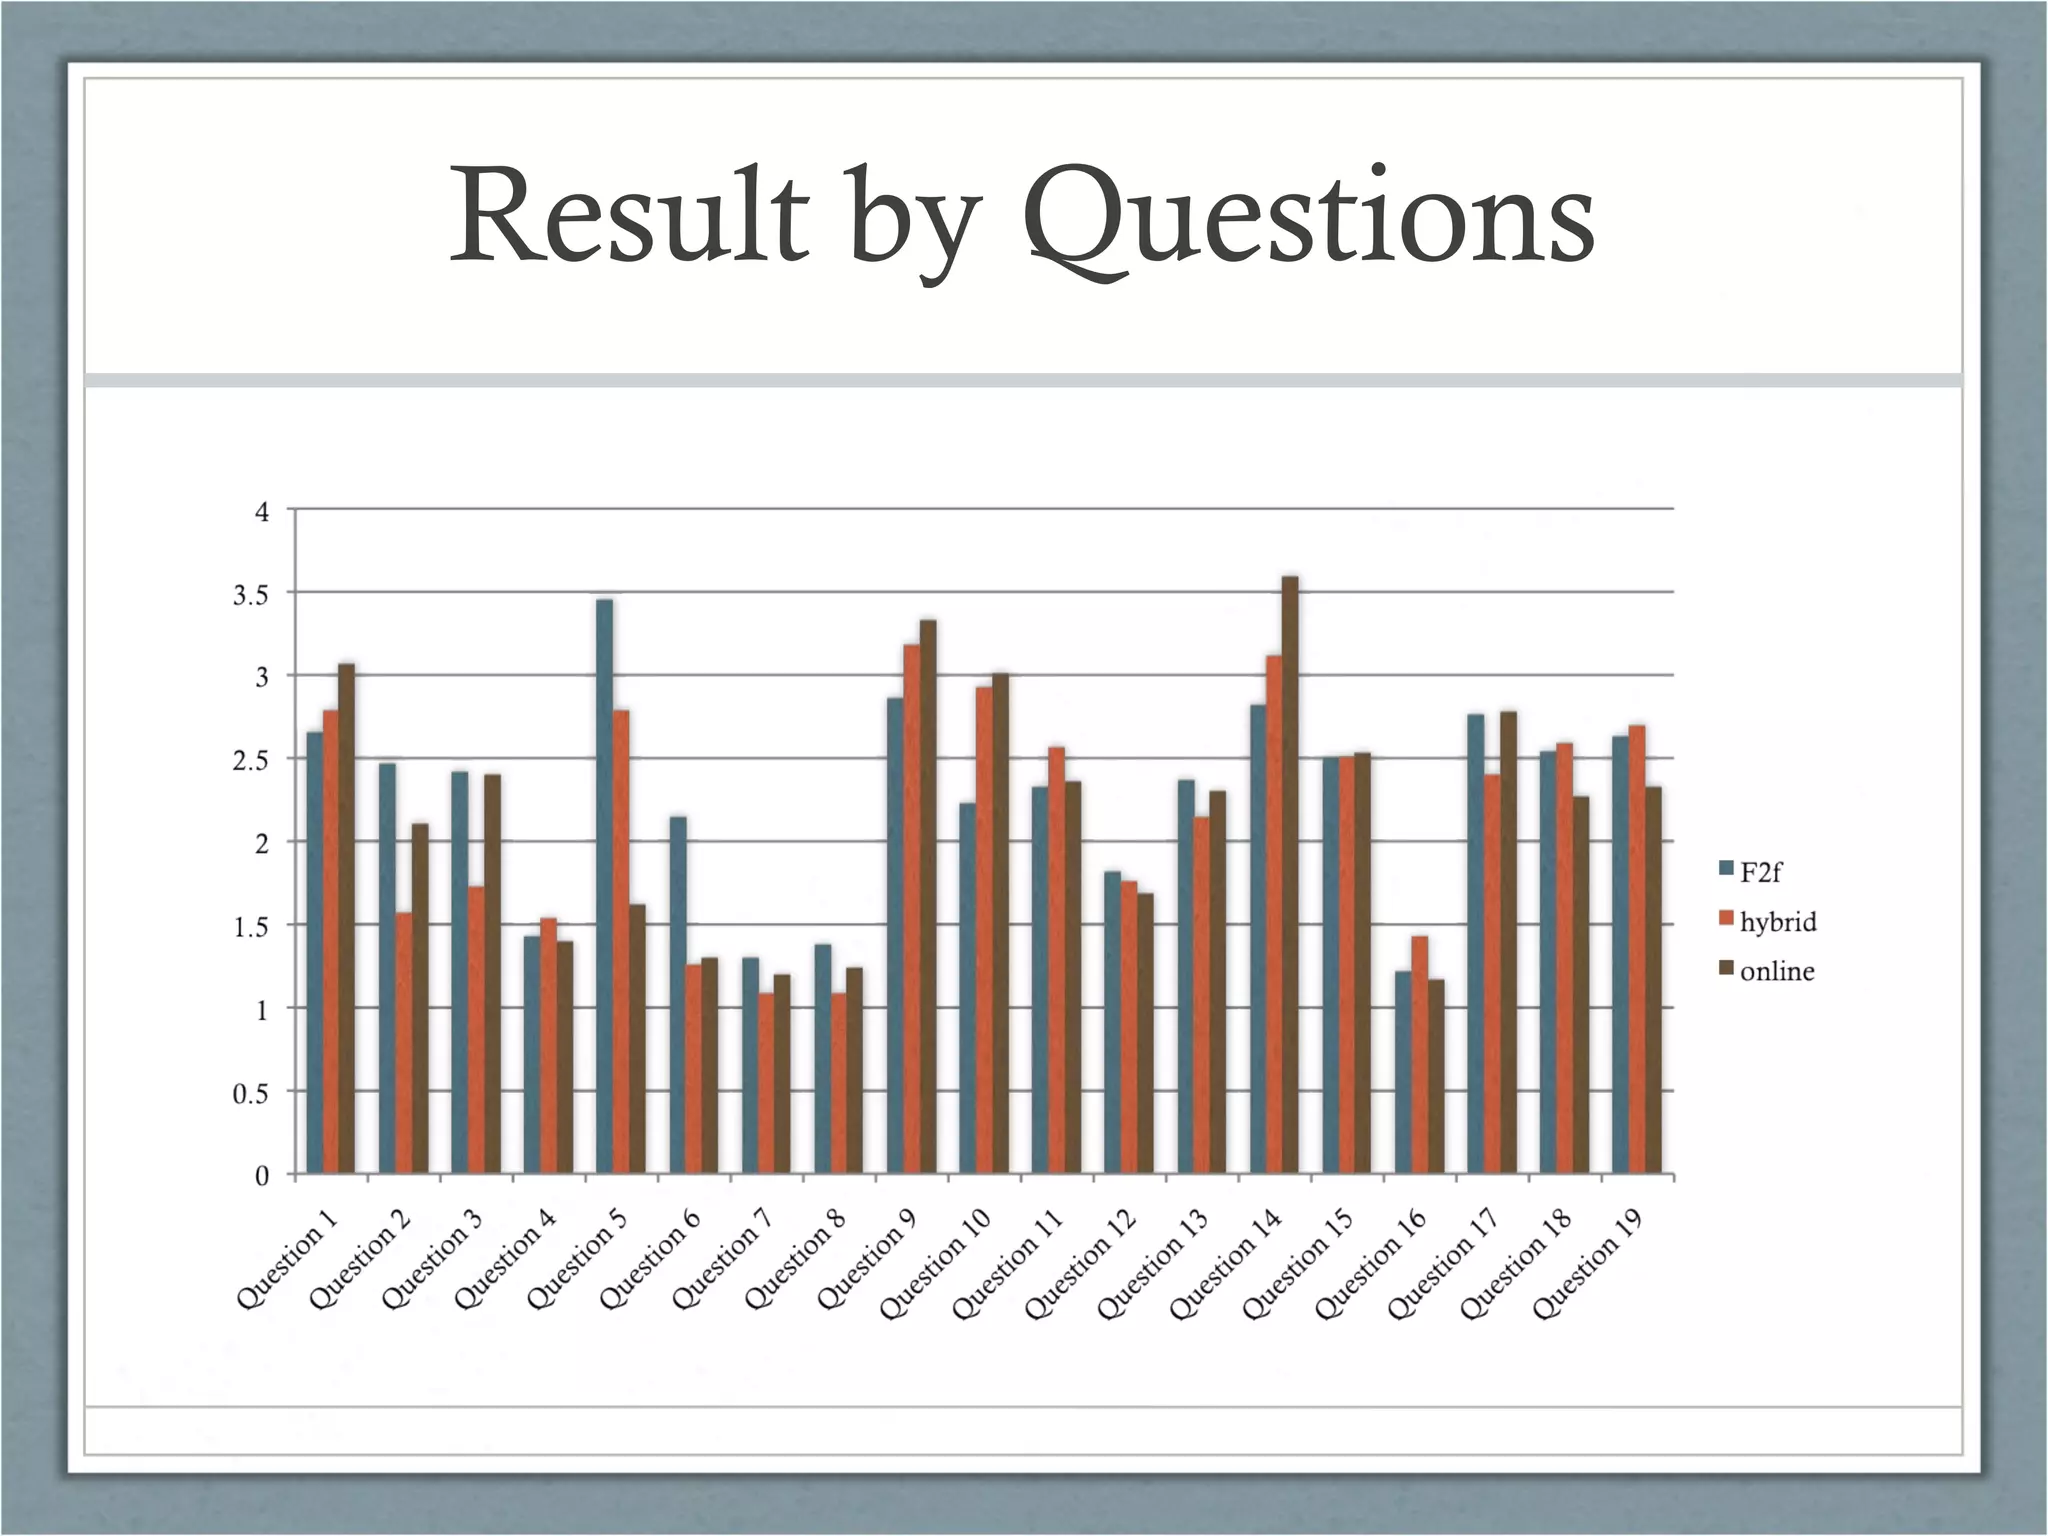
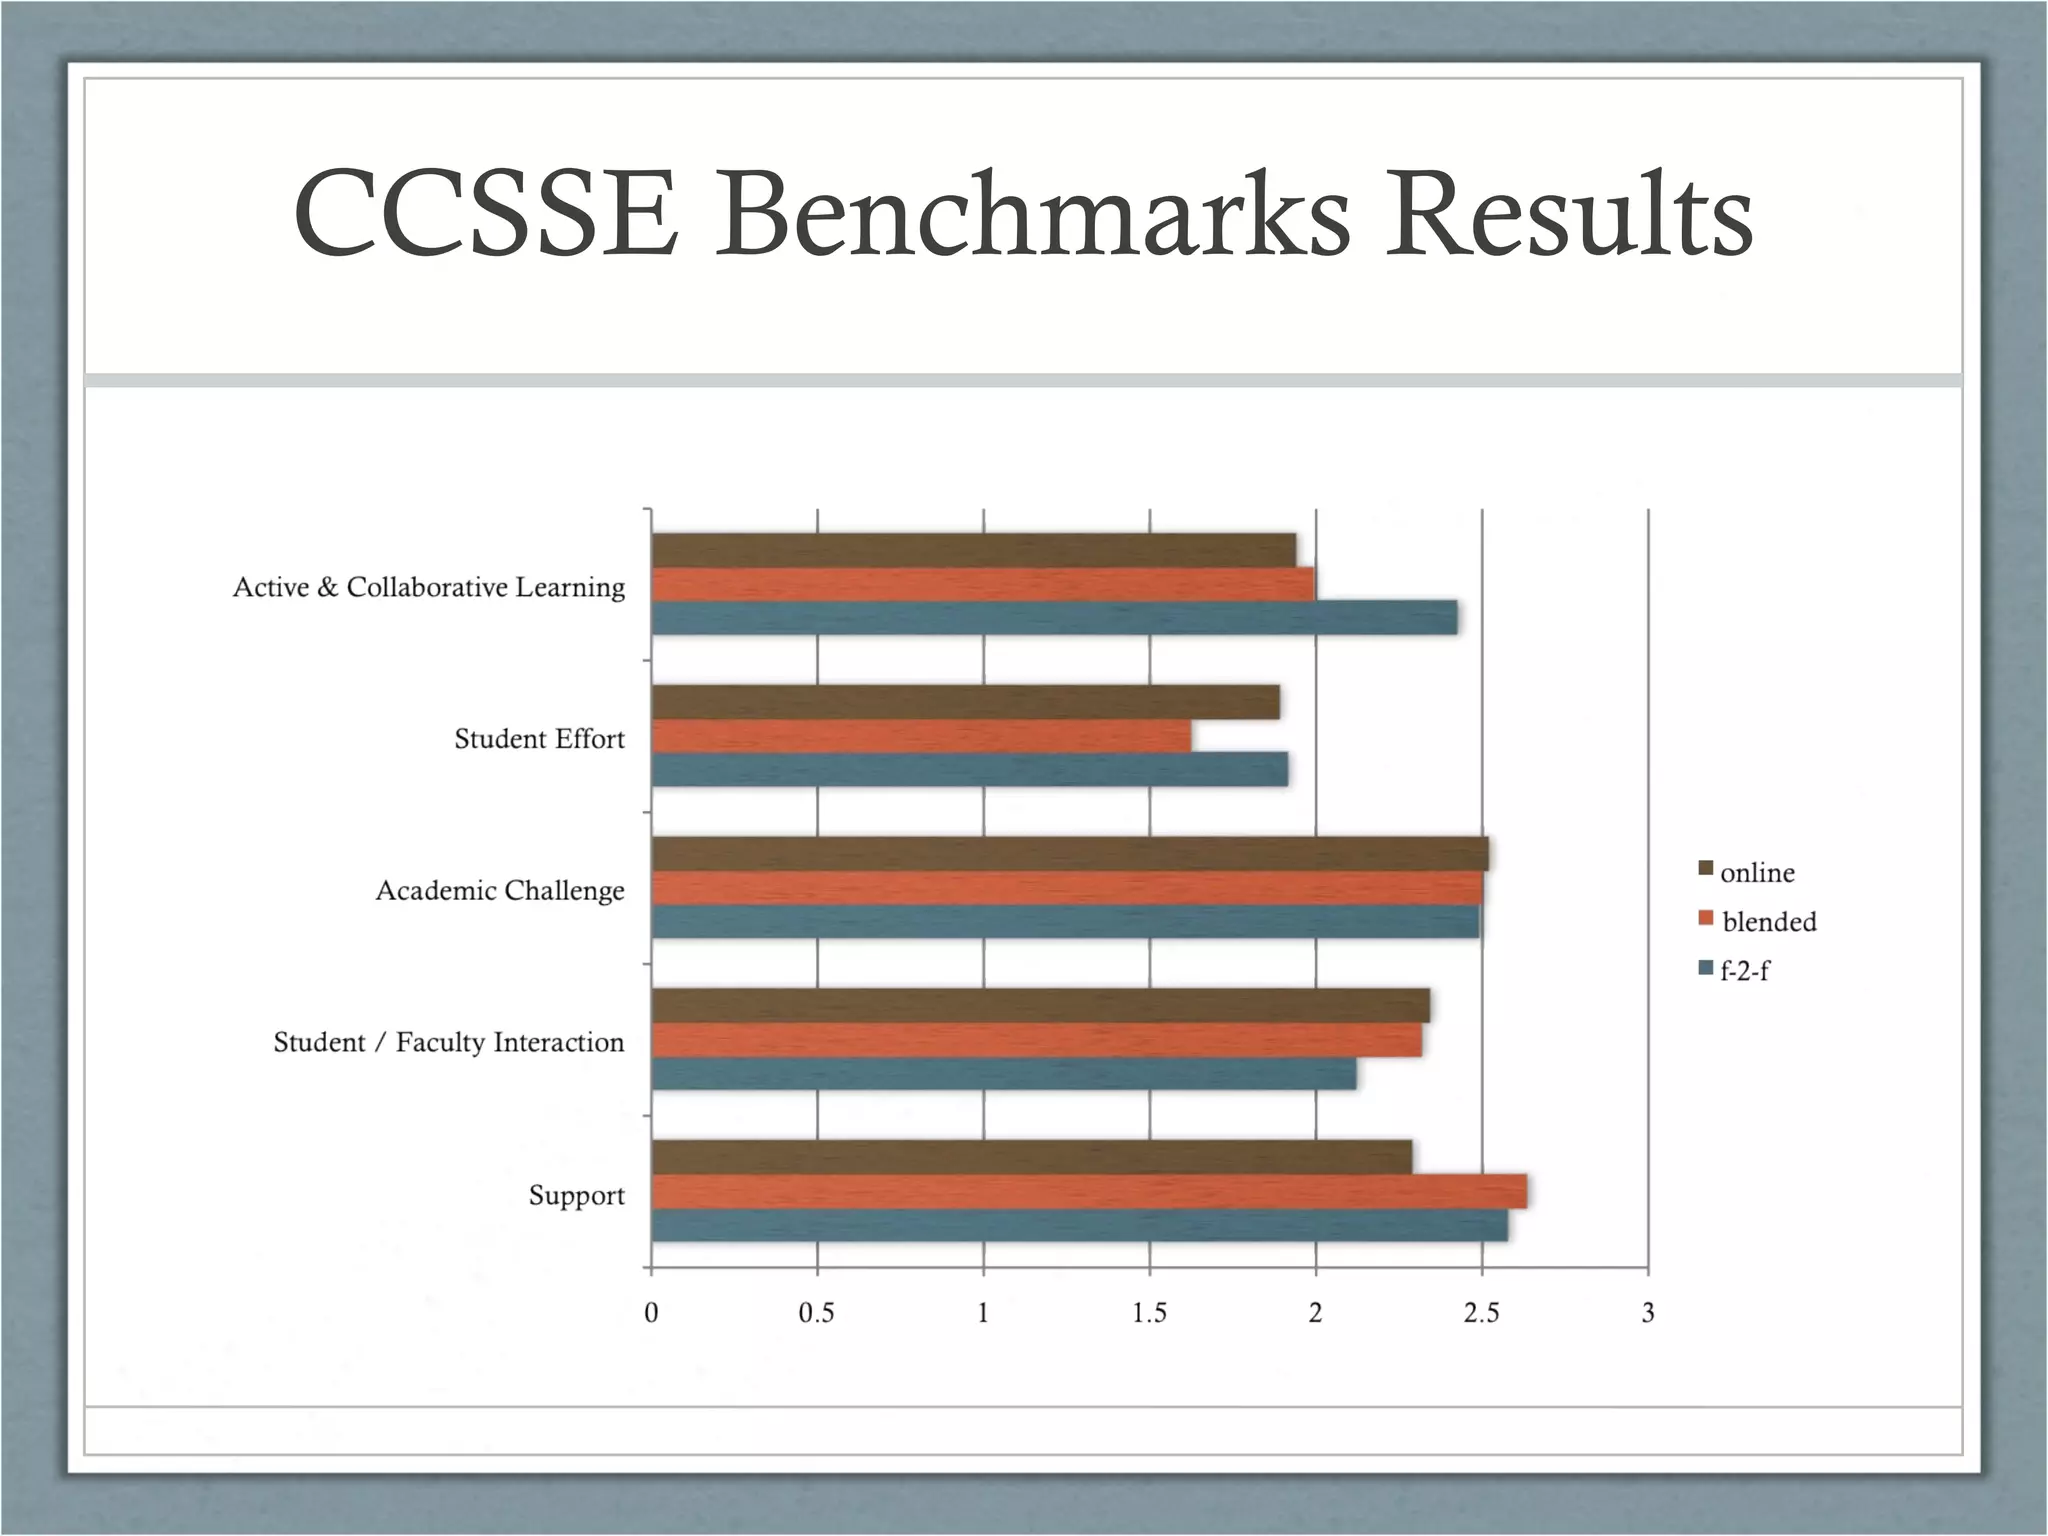
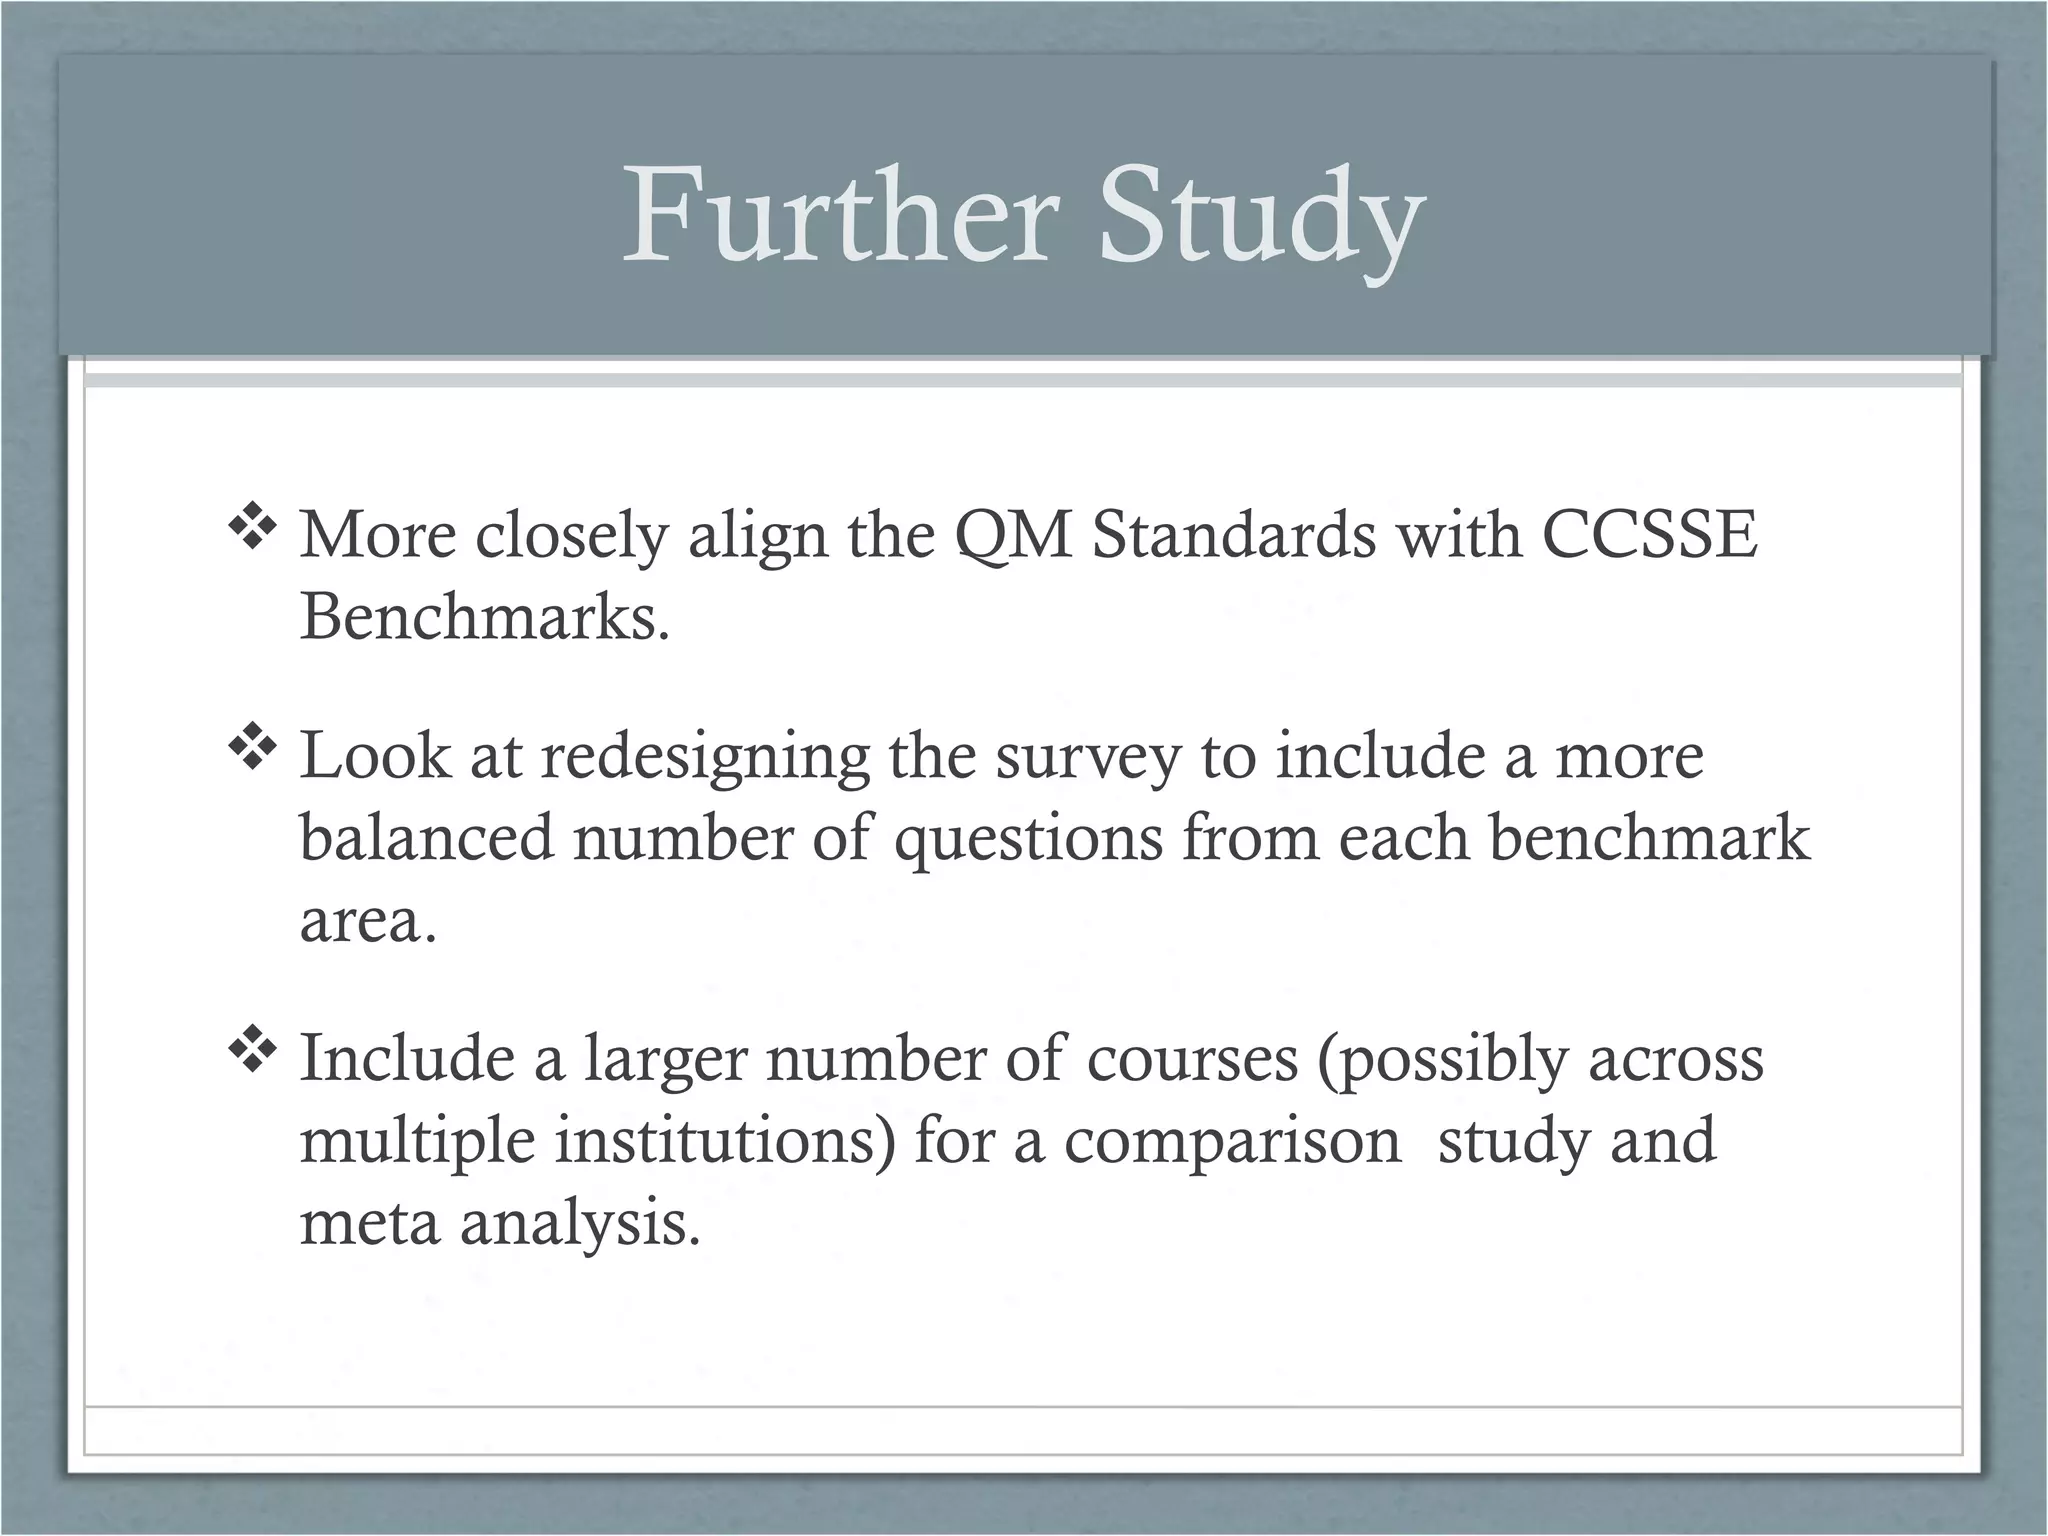

The workshop outlines the implementation of a redesigned blended course at Lakeland Community College, emphasizing the importance of student engagement and the evaluation of pedagogical methods using Quality Matters standards. It presents research findings linking active student involvement with academic success, detailing survey results that measure participation across various course delivery methods. Recommendations for future studies include aligning QM standards with benchmarks and expanding the survey to encompass a wider range of courses.


