This document provides an abridged user guide for MapInfo Professional Version 9.0. It includes information about the software's features, instructions for installation and configuration, and contact details for technical support. New features in Version 9.0 include the ability to work with date/time data, use curved labels, directly access Universal Data formats, and employ templates for layouts. The guide also covers system requirements, licensing, installing related programs and data, and troubleshooting potential issues.


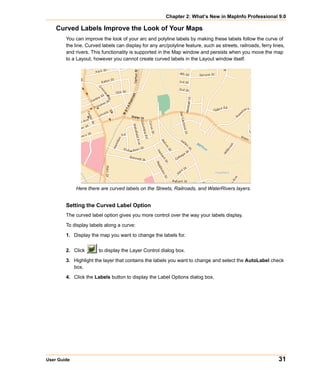


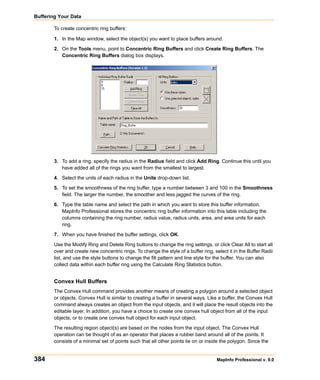
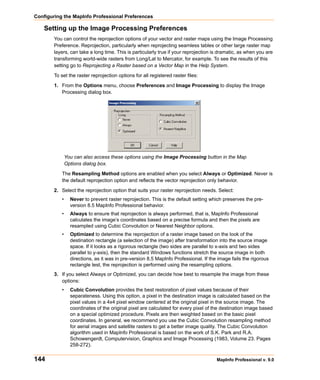
![Data Enhancements
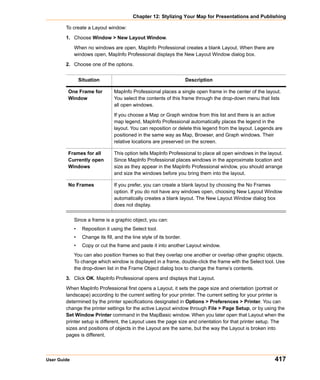
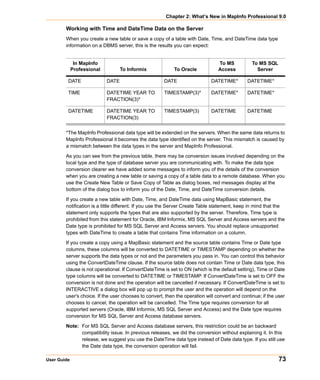
Data Enhancements
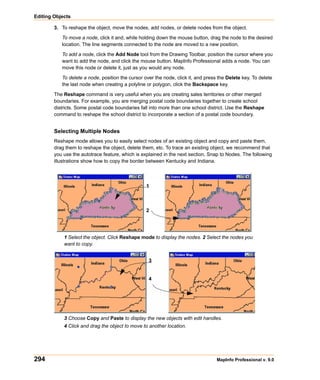
To provide more room for data in the future, we have decided to ship a separate data CD with
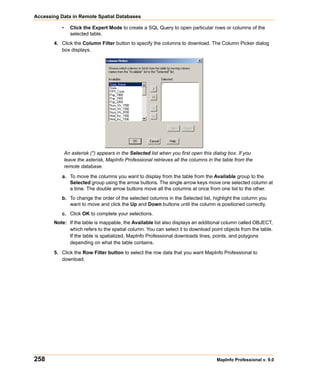
MapInfo Professional.
Here is the directory structure and data presentation for the introductory and sample data that is
shipped with MapInfo Professional. We use the term Introductory Data to describe the data you can
use to geocode locally and to enhance the maps you create in every session. The Sample Data
folder provides examples of other types of data that are available from MapInfo Corporation.
The Introductory_Data directory is structured as follows:
NorthAmerica
USA
Canada
Mexico
World
[files]
Europe
Asia
Africa
Australia
World_WMS
workspcs
The Sample Data is designed to give you a taste of the other kinds of data products you have
available to you. The SampleData directory is structured as follows:
Geographic
AirPhotoUSA
StreetPro Samples
Industry_Data
Business Points
Insurance
TelcoData
Weather
We have added more industry-specific sample workspaces and updated the samples that ship with
the MapInfo Professional application to enhance your maps and geocoding. To make space for this
new data, we have removed the indexes from all of the data except the USZIPBDY.TAB,
US_ZIPS.TAB, and the US_CNTY.TAB files. You need the indexes for these files to maximize your
ability to geocode to ZIP code boundaries and centroids and county centroids.
76 MapInfo Professional v. 9.0](https://image.slidesharecdn.com/mapinfo-130223043435-phpapp01/85/Mapinfo-76-320.jpg)


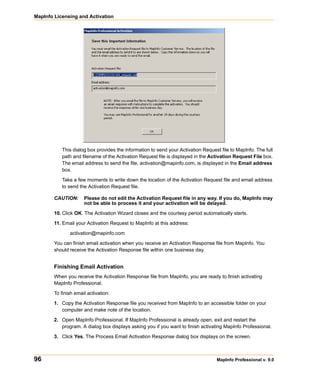
![MapInfo Licensing and Activation
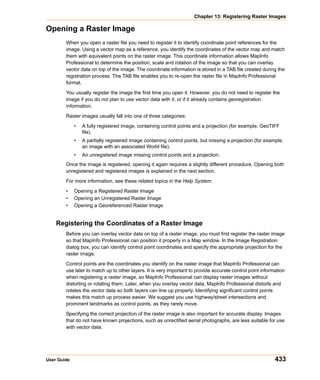
Setting Up Client Workstations
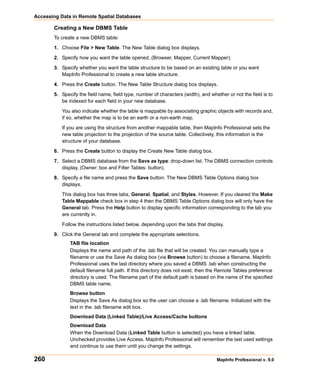
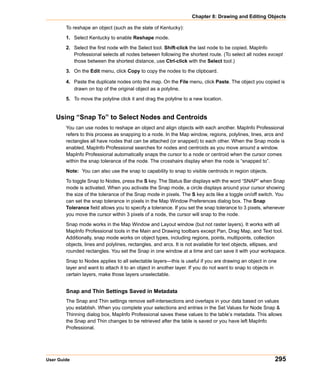
To permit a user to use this network installation of MapInfo Professional, run SETUP.EXE:
1. Map a drive to the MapInfo Professional Install directory.
2. Select Run from the Start menu.
3. Run SETUP.EXE from [MapInfo install directory]AddClient. The MapInfo Professional Client
Welcome screen displays.
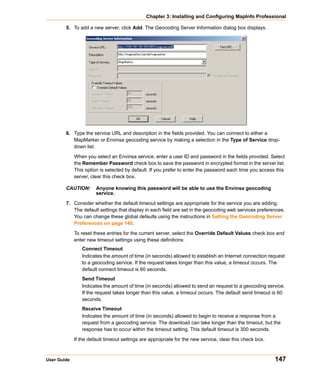
4. Click Next. The License Information screen displays.
5. Click “I accept the terms of the license agreement” and select Next. The Customer
Information screen displays with the network install values as the default.
6. Modify for the current instance and select Next.
7. Click Install to continue the installation.
8. Click Finish to complete the client installation.
9. Open MapInfo Professional and begin the product activation process. See MapInfo Licensing
and Activation on page 92.
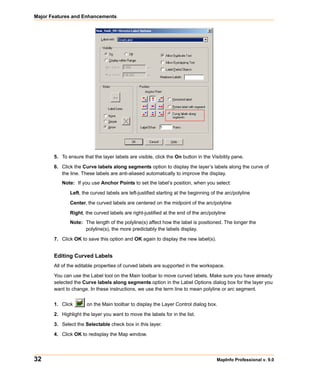
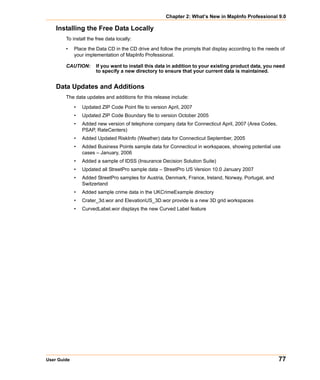
MapInfo Licensing and Activation
This section describes the licenses available for MapInfo Professional and how to get started with
the product according to the type of license your organization purchased.
MapInfo has two licensing schemes:
• Node-locked
• Concurrent
The serial number and access code that you enter during the installation indicates to MapInfo
Professional what type of license you have. Depending on the license type, MapInfo Professional
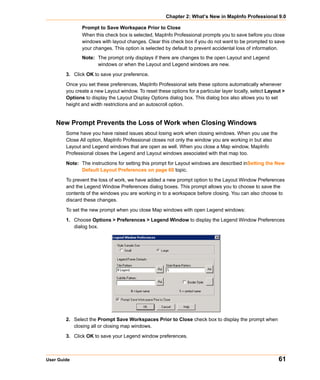
will guide you through activating the product (if your organization purchased node-locked licenses)
or connecting to a license server (if your organization purchased concurrent licenses).
Node-Locked Licenses
Node-locked licenses enable you to run MapInfo Professional on a specific computer. If you
purchased node-locked licenses, your installation of MapInfo Professional must be activated before
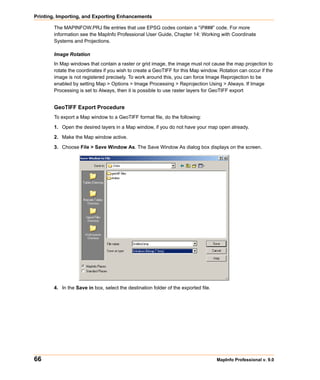
you can use it. Activation is the process of acquiring a license from MapInfo. This section explains
the activation options available for node-locked licenses.
Product Activation
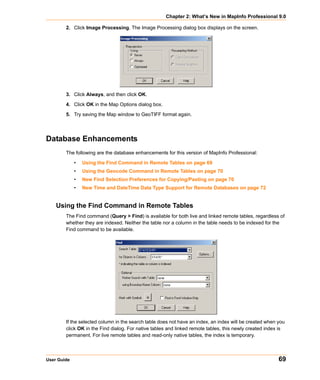
MapInfo uses the serial number and access code you supplied during the installation to activate the
product. If you need to refer to these numbers again, the serial number and access code are located
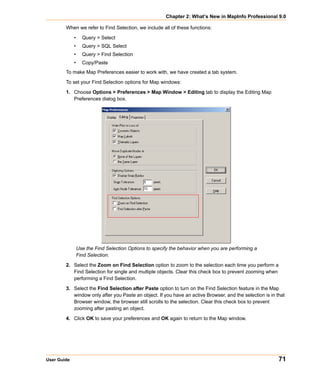
on the product box and on the Product Activation Information Card.
92 MapInfo Professional v. 9.0](https://image.slidesharecdn.com/mapinfo-130223043435-phpapp01/85/Mapinfo-92-320.jpg)

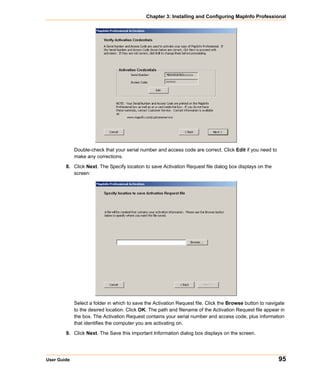


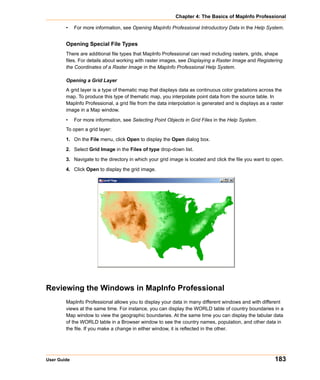
![Chapter 3: Installing and Configuring MapInfo Professional
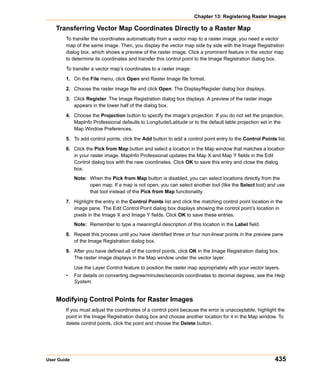
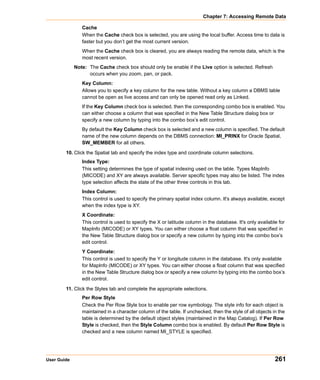
Returning a Borrowed License
To return a borrowed license, you must reconnect the computer that is using the borrowed license to
your network. If it is not connected, the Return borrowed license command will not be available.
To return a borrowed license:
1. Reconnect the computer to your network.
2. Open MapInfo Professional. A dialog box displays to tell you on what date the borrowed license
is going to expire.
3. Click OK.
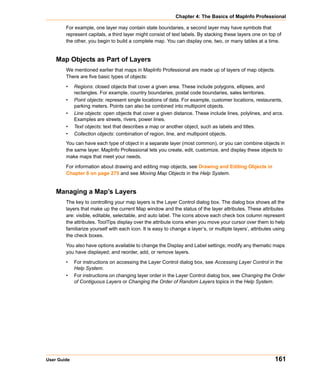
4. Choose Help > Licensing > Return borrowed license. The Return borrowed license to license
server dialog box displays on the screen.
5. This dialog box explains how a license is returned. Click OK.
6. A MapInfo Activation message displays on the screen to tell you that the license has been
returned to the license server.
7. Click OK.
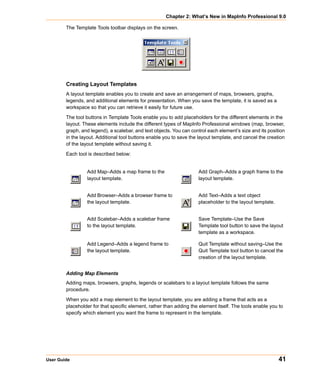
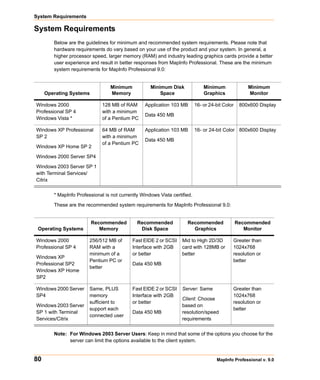
Silent Installation Procedures for System Administrators
Silent installations allow you to repackage MapInfo Professional for deployment within your
company so your users do not have to enter user- or company-specific information, path information,
Oracle or ODBC DLLs, a serial number, or an access code.
The MapInfo Professional installation setup.exe indicated in the steps below can be found on the
installation CD (d:) in this directory:
InstallMI_PRODISK1
In general, the silent installation process goes like this:
1. Place the installation CD in the target computer’s disk drive.
2. From the command line on the target computer, type:
"d:InstallMI_PRODISK1setup.exe /s /v"PARAMETERS"
where PARAMETERS are the parameters you set to populate the msiexec.
For example:
"InstallMI_PRODISK1setup.exe /s /v"/qb
INSTALLDIR="[PathTo]MapInfoOtherThanStandardProfessional 9.0"
USERNAME="MyUser" COMPANYNAME="MyCompanyName"
PIDKEY="MySerialNumber" ACCD="MyAccessCode""
User Guide 105](https://image.slidesharecdn.com/mapinfo-130223043435-phpapp01/85/Mapinfo-105-320.jpg)
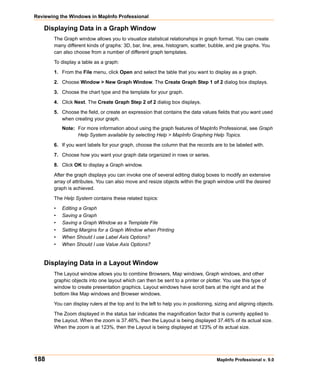
![MapInfo Licensing and Activation
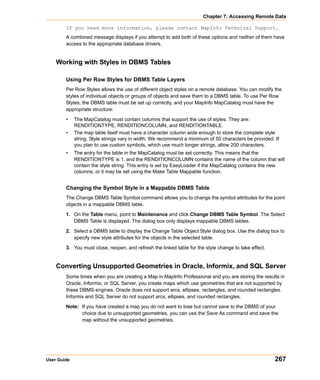
For concurrent licenses the parameters for the license server name and license server port number
must also be included:
1. Place the installation CD in the target computer’s disk drive.
2. From the command line on the target computer, type:
"d:InstallMI_PRODISK1setup.exe /s /v"PARAMETERS"
where PARAMETERS are the parameters you set to populate the msiexec.
For example:
"InstallMI_PRODISK1setup.exe /s /v"/qb
INSTALLDIR="[PathTo]MapInfoOtherThanStandardProfessional 9.0"
USERNAME="MyUser" COMPANYNAME="MyCompanyName"
PIDKEY="MySerialNumber" ACCD="MyAccessCode"
LSNAME="MyLicenseServerName" LSPN="MyLicenseServerPortNumber""
Look for the type of installation you want to perform from the options below and follow the
corresponding instructions. In each of the install scenarios described below, the serial number and
access code parameters are given in the following format:
• PIDKEY=MI##############
• ACCD=######
Substitute the appropriate serial number and access code when you perform the silent install.
Completely Silent Install
To initiate a silent install:
1. Place the installation CD in the target computer’s disk drive.
2. From the command line on the target computer, type:
"d:InstallMI_PRODISK1setup.exe" /s /v"/q PIDKEY=MI##############
ACCD=######"
For concurrent licenses, the license server name and port number parameters must be included:
• LNAME="LicenseServerName"
• LSPN="LicenseServerPortNumber"
Substitute the appropriate license server name and port number when you perform the silent install.
Silent Install with an Initial Dialog Box Only
To initiate a silent install where a single dialog box displays to initiate the installation:
1. Place the installation CD in the target computer’s disk drive.
2. From the command line on the target computer, type:
"d:InstallMI_PRODISK1setup.exe" /s /v "/qb PIDKEY=MI##############
ACCD=######"
106 MapInfo Professional v. 9.0](https://image.slidesharecdn.com/mapinfo-130223043435-phpapp01/85/Mapinfo-106-320.jpg)


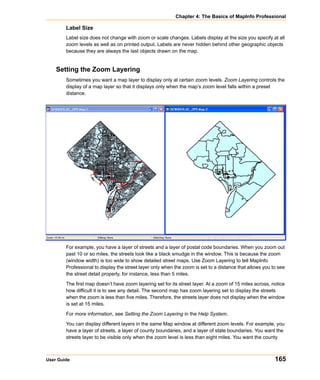


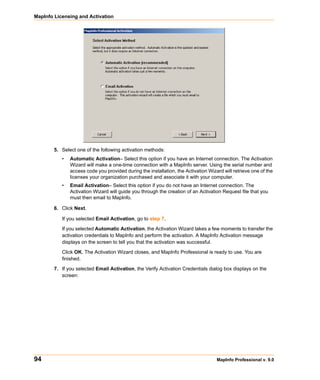
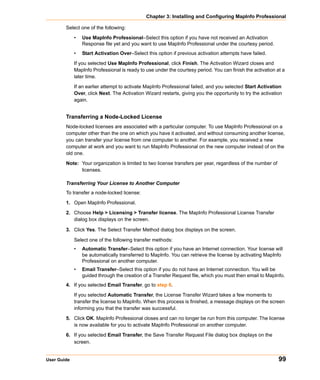
![Chapter 4: The Basics of MapInfo Professional
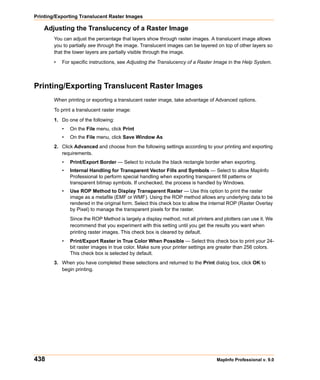
How a Browser Displays in a Layout
A Browser window displays with the column headings at the very top of the frame. Immediately
below, it displays the contents of the table, starting with the row and column at the upper-left corner
of the table. It displays as many columns and rows as it can fit in the frame, regardless of how many
are displayed in the table. When you resize the frame, the number of rows and columns displayed
are adjusted accordingly. However, fields removed from the table with the Pick Fields command are
not displayed in a table frame.
The number of rows and columns that can be displayed in a frame depends on font size and column
width. The frame displays Table text using the font style and size for that Browser window. When you
want a different type style in the frame, you have to make the change in the Browser window using
Options > Text Style dialog box. When you use smaller type, you can get more rows and columns
in a frame.
You can also manually adjust column width in a Browser window without affecting the underlying
field size for the base table. You do this by clicking and dragging the short vertical bars separating
the column names in the Browser window.
The Help System contains the following related topics:
• Adding a New Row to a Browser
• Adding and Editing Text in a Browser
• Adding Fields to a Browser
• Choosing a Font for your Browser
• Creating a Default Browser View
• Preserving Column and Expression Settings in a Browser Window
• Removing Fields from a Browser
• Resizing a Browser’s Columns
• Setting Margins for a Browser Window when Printing
• Showing or Hiding a Browser’s Grid
• Using the HotLink Tool in a Browser Window
Changing a Record's Data, Font, and Style
The Info tool allows you to choose an object or row and see a window displaying information from
the table about that object. Click another object with the Info tool and its information appears in the
same window. Click the Ctrl-menu box [Close box] of the Info window to make it disappear.
Mouse Wheel Support for Browser Window
When you are working in the Browser window, you can use the mouse wheel to scroll through the
records. Roll the mouse button down to scroll down the list, and roll the mouse button up to scroll up
the list. You can use the Tab key to scroll right and the <Shift Tab> keys to scroll left in the Browser
window.
User Guide 187](https://image.slidesharecdn.com/mapinfo-130223043435-phpapp01/85/Mapinfo-187-320.jpg)


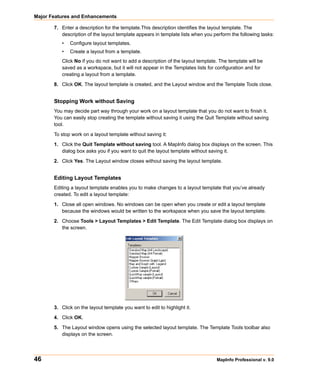
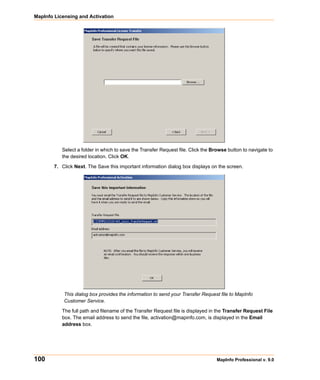
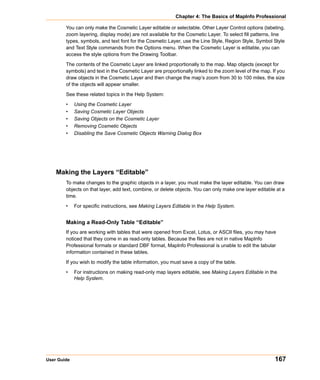
![Querying Your Data in MapInfo Professional
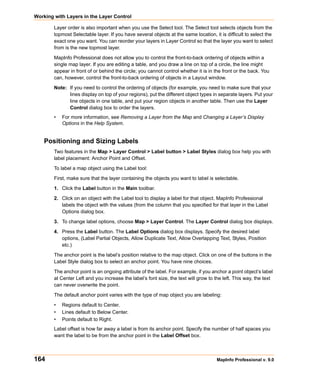
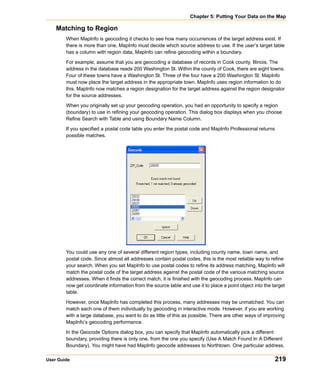
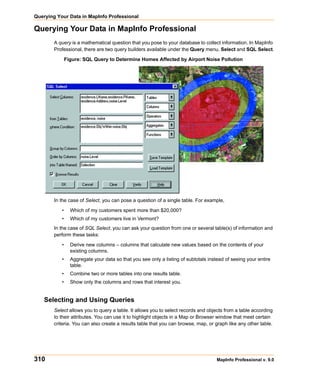
5. Click OK. The Find dialog box displays. This dialog box allows you to specify what data to look
for.
The name of the column that you specified in the first Find dialog box is listed to the left of the list
box (for example, Street). When locating a street address, type in "# Name", such as "30 Elm St"
or "1045 Templar Blvd." What you type in depends on geocoding preferences specified in
Options > Preferences > Address Matching.
Note: MapInfo Professional comes with a text file called MAPINFOW.ABB [MapInfo
Professional Abbreviations], that contains a list of common street abbreviations, such as
"St" for "Street" and "Blvd." for "Boulevard," and so forth. These help MapInfo
Professional to obtain exact matches. To familiarize yourself with the MAPINFOW.ABB
file, you can take a look at its contents in the Notepad Text Editor.
6. Type the name of the object or address you are searching for in this box. If you have used the
Refine option in the first dialog box, a second column name is listed (for example, ZIP).
7. Type the name of the refining boundary in this box. If MapInfo Professional cannot find an exact
match for the object you specified, it lists possible matches.
8. Click Up or Down to move to other pages and choose a specific entry from the list.
9. Click OK and the find is initiated.
You can also use the Find command to locate street intersections. When you type in the name of
the object to be found in the second Find dialog box (enter object name to find), separate the two
items by a double ampersand (&&). For example, to find the intersection of Congress Street and
Christie Street, type "Congress Street && Christie Street."
Finding and Displaying a Selected Object
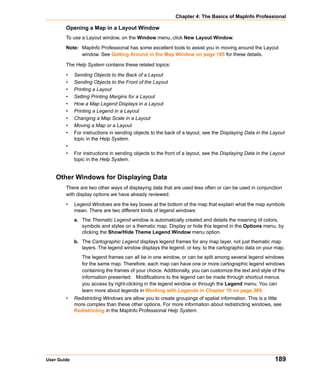
When you create a query or a SQL query, you may want to see the results of that query visually on
the map.
To find and display a selected object:
1. Do one of the following:
• From the Query menu, select Select to display the Select dialog box
• From the Query menu, select SQL Select to display the SQL Select dialog box
The Find Results in Current Map Window check box displays in both dialog boxes.
2. Create your query and verify that it is correct, selecting the open table that you want to query.
312 MapInfo Professional v. 9.0](https://image.slidesharecdn.com/mapinfo-130223043435-phpapp01/85/Mapinfo-312-320.jpg)