Download as PDF, PPTX


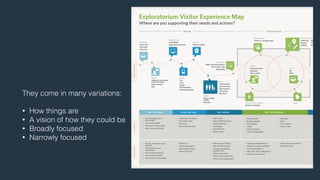


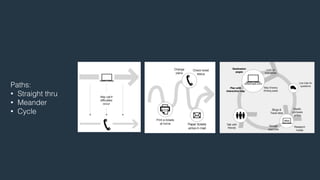
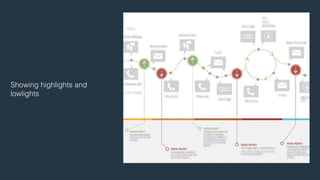
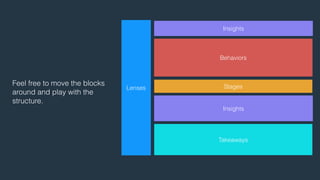
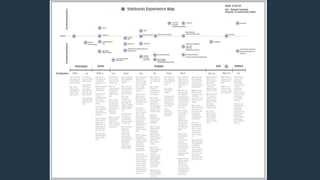
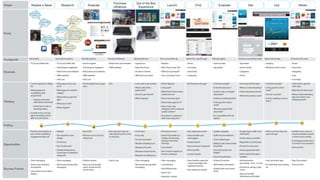
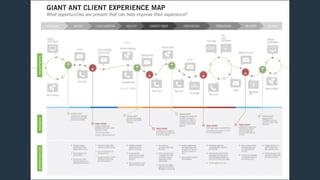
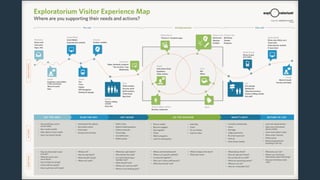
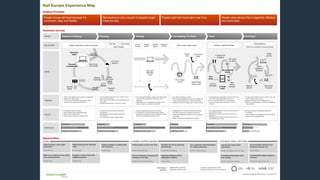
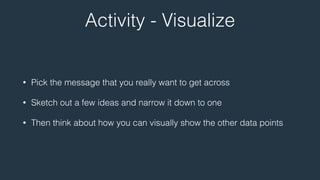


The document outlines an experience mapping workshop technique for understanding user journeys. It discusses defining experience maps, prepping for the workshop, gathering data from users, building the map by identifying lenses, stages, behaviors and insights, and visualizing the map. The workshop is broken into sections, includes activities, and discusses using the finalized map to identify opportunities and drive consensus around users and products. The goal is to tell a rich story of users' experiences through this collaborative design process.