This document details the Atterberg limit test, a laboratory experiment focused on determining the liquid limit, plastic limit, and plasticity index of fine-grained soils, critical for understanding soil behavior and engineering properties. It includes acknowledgments, procedures, a breakdown of apparatus and materials used, results, and discussions on findings related to soil consistency. The methods aim to classify soil types based on water content and their mechanical behavior in engineering contexts.


![Atterberg Limit Test February 21, 2020
Page 19 of 32
Wt. of Con
(g)
18.85 19.12 18.88 7.03 8.34
Wt. of Water
(g)
4.1 2.69 3.02 0.42 0.29
Wt. of dry
Soil (g)
19.79 12.23 14.02 4.25 0.46
Moisture
Content (%)
20.72 21.99 21.54 9.88 63.04
Wt. of Water (g) = [Wt. of Wet Soil + Con (g)] – [Wt. of dry Soil + Con (g)]
Wt. of dry Soil (g) = [Wt. of dry Soil + Con (g)] – Wt. of Con (g)
Moisture Content (%) =
𝐖𝐭.𝐨𝐟 𝐖𝐚𝐭𝐞𝐫 (𝐠)
𝐖𝐭.𝐨𝐟 𝐝𝐫𝐲 𝐒𝐨𝐢𝐥 (𝐠)
4.1.Calculation
4.1.1. Liquid Limit
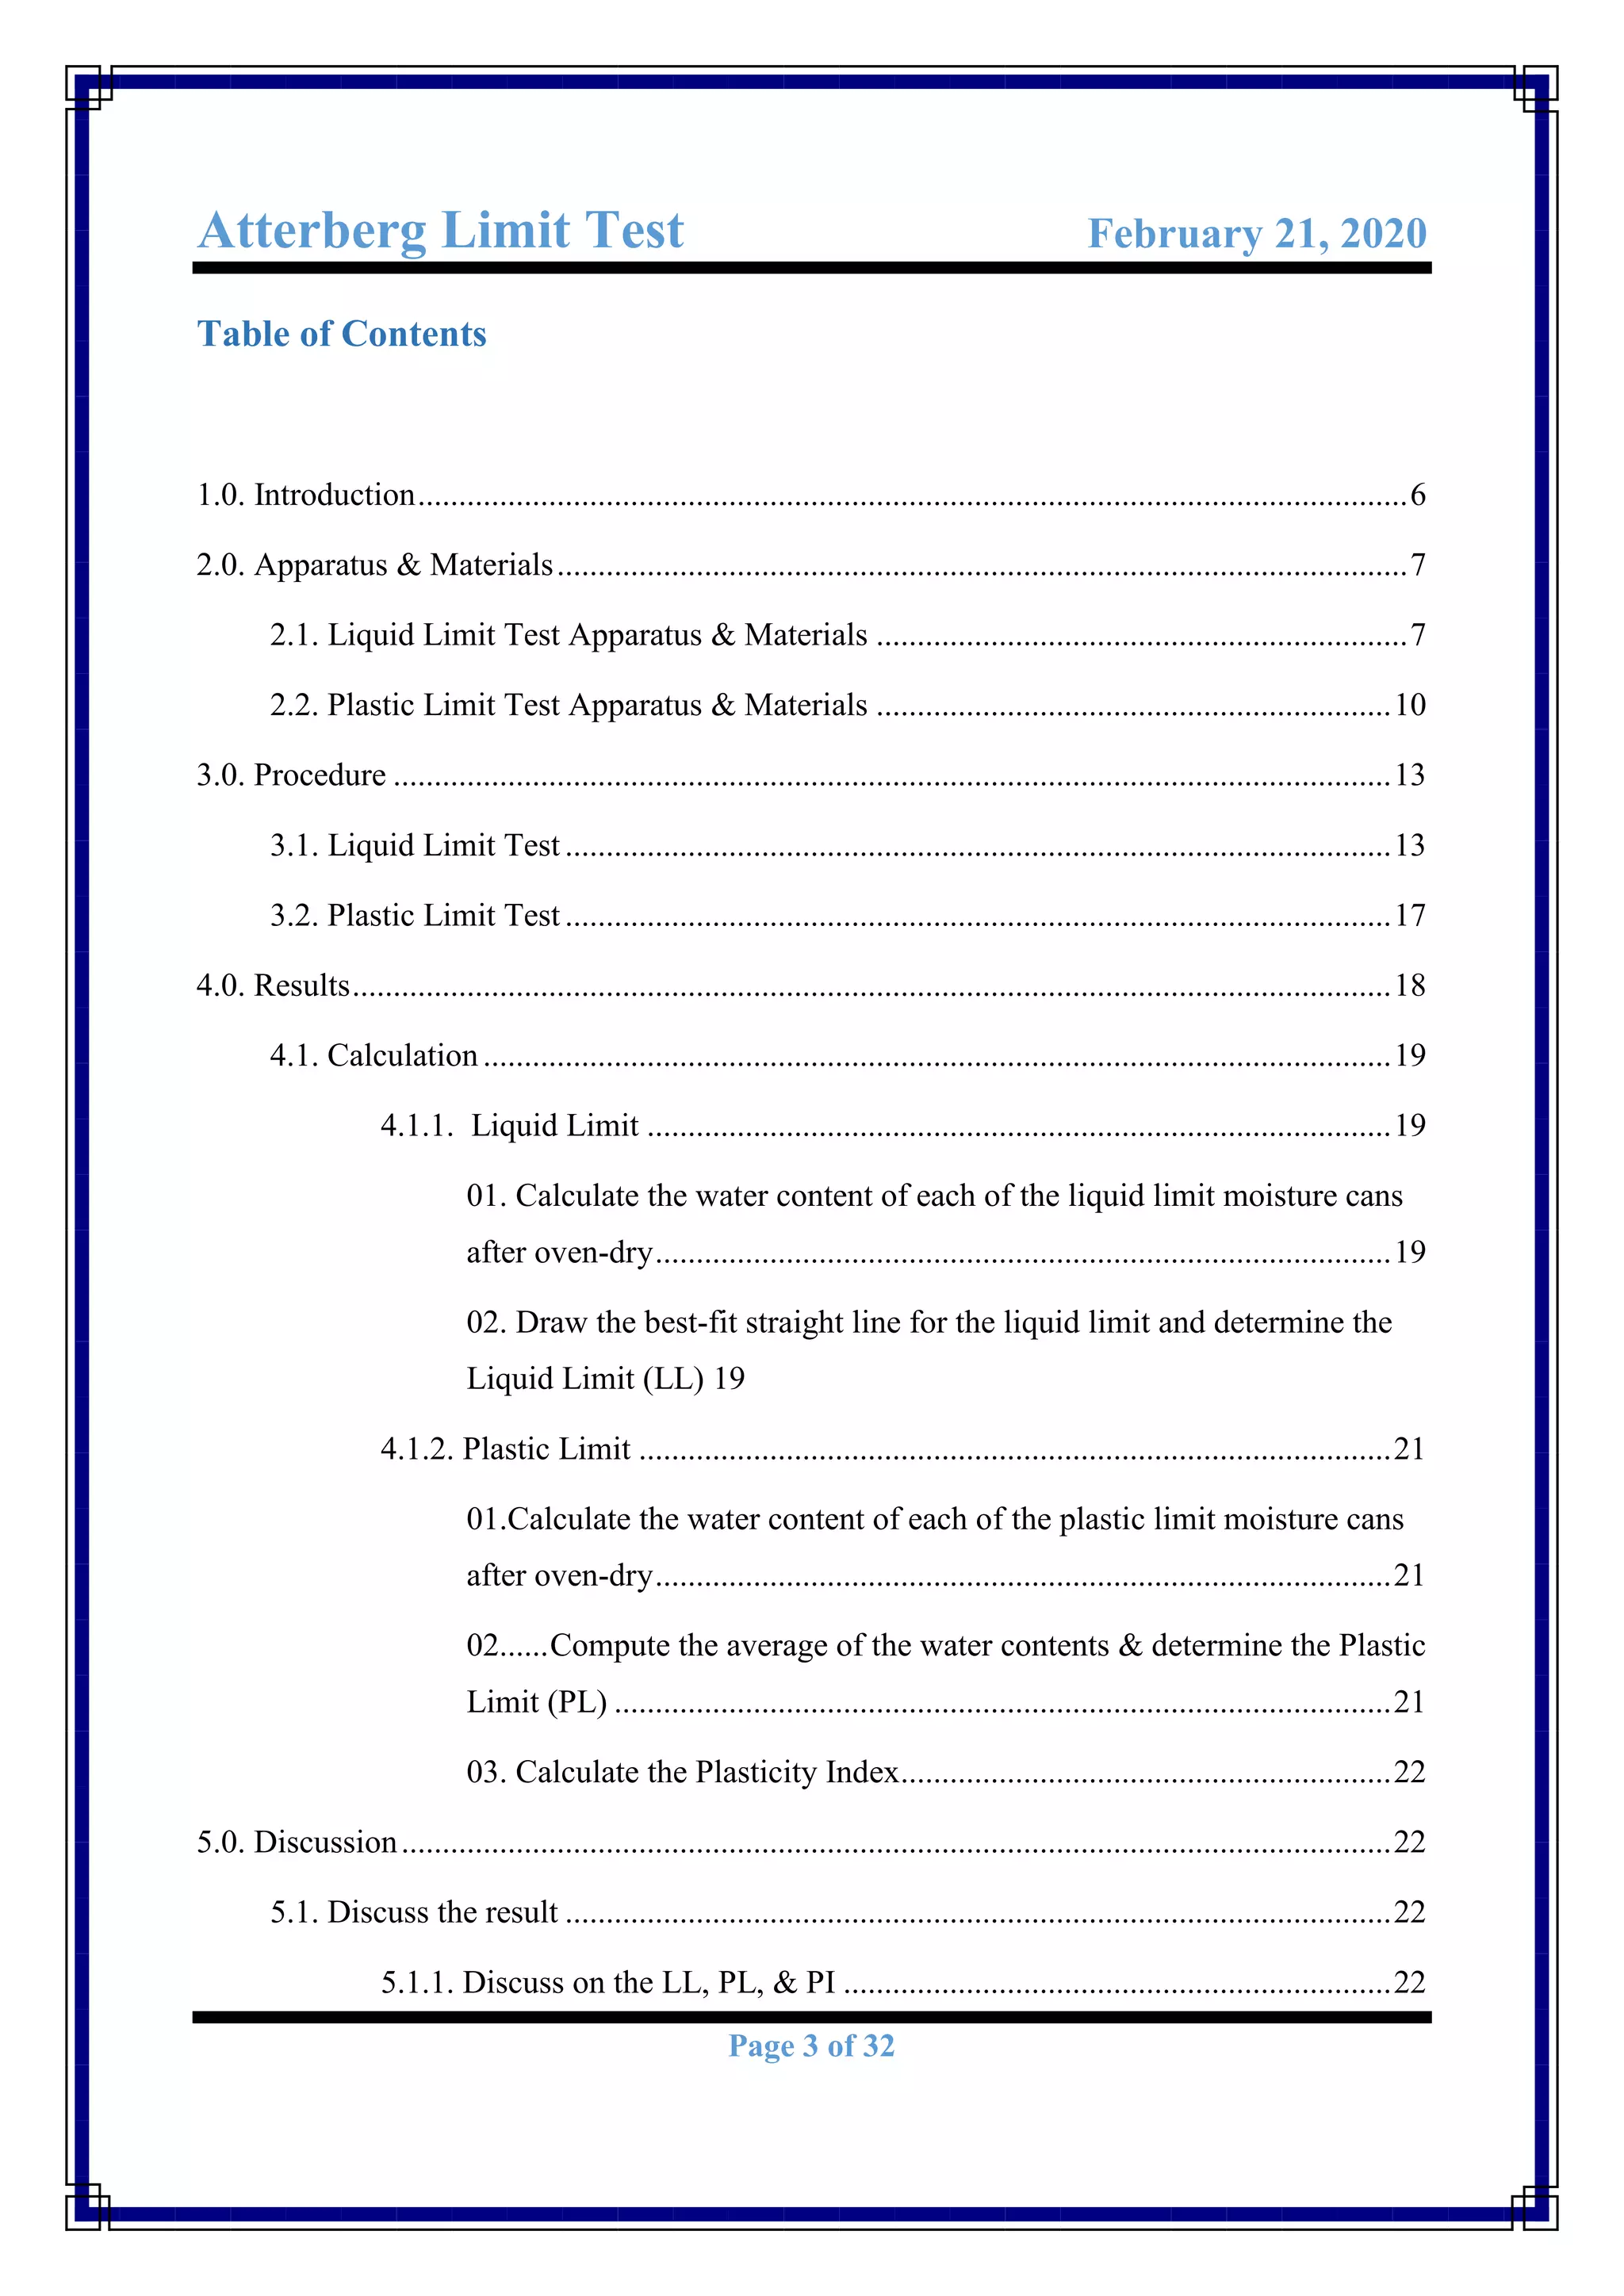
01. Calculate the water content of each of the liquid limit moisture cans after oven-dry
Moisture Content of LL1 =
4.1 g
19.79 g
= 20.72%
Moisture Content of LL2 =
2.69 g
12.23 g
= 21.99%
Moisture Content of LL3 =
3.02 g
14.02 g
= 21.54%
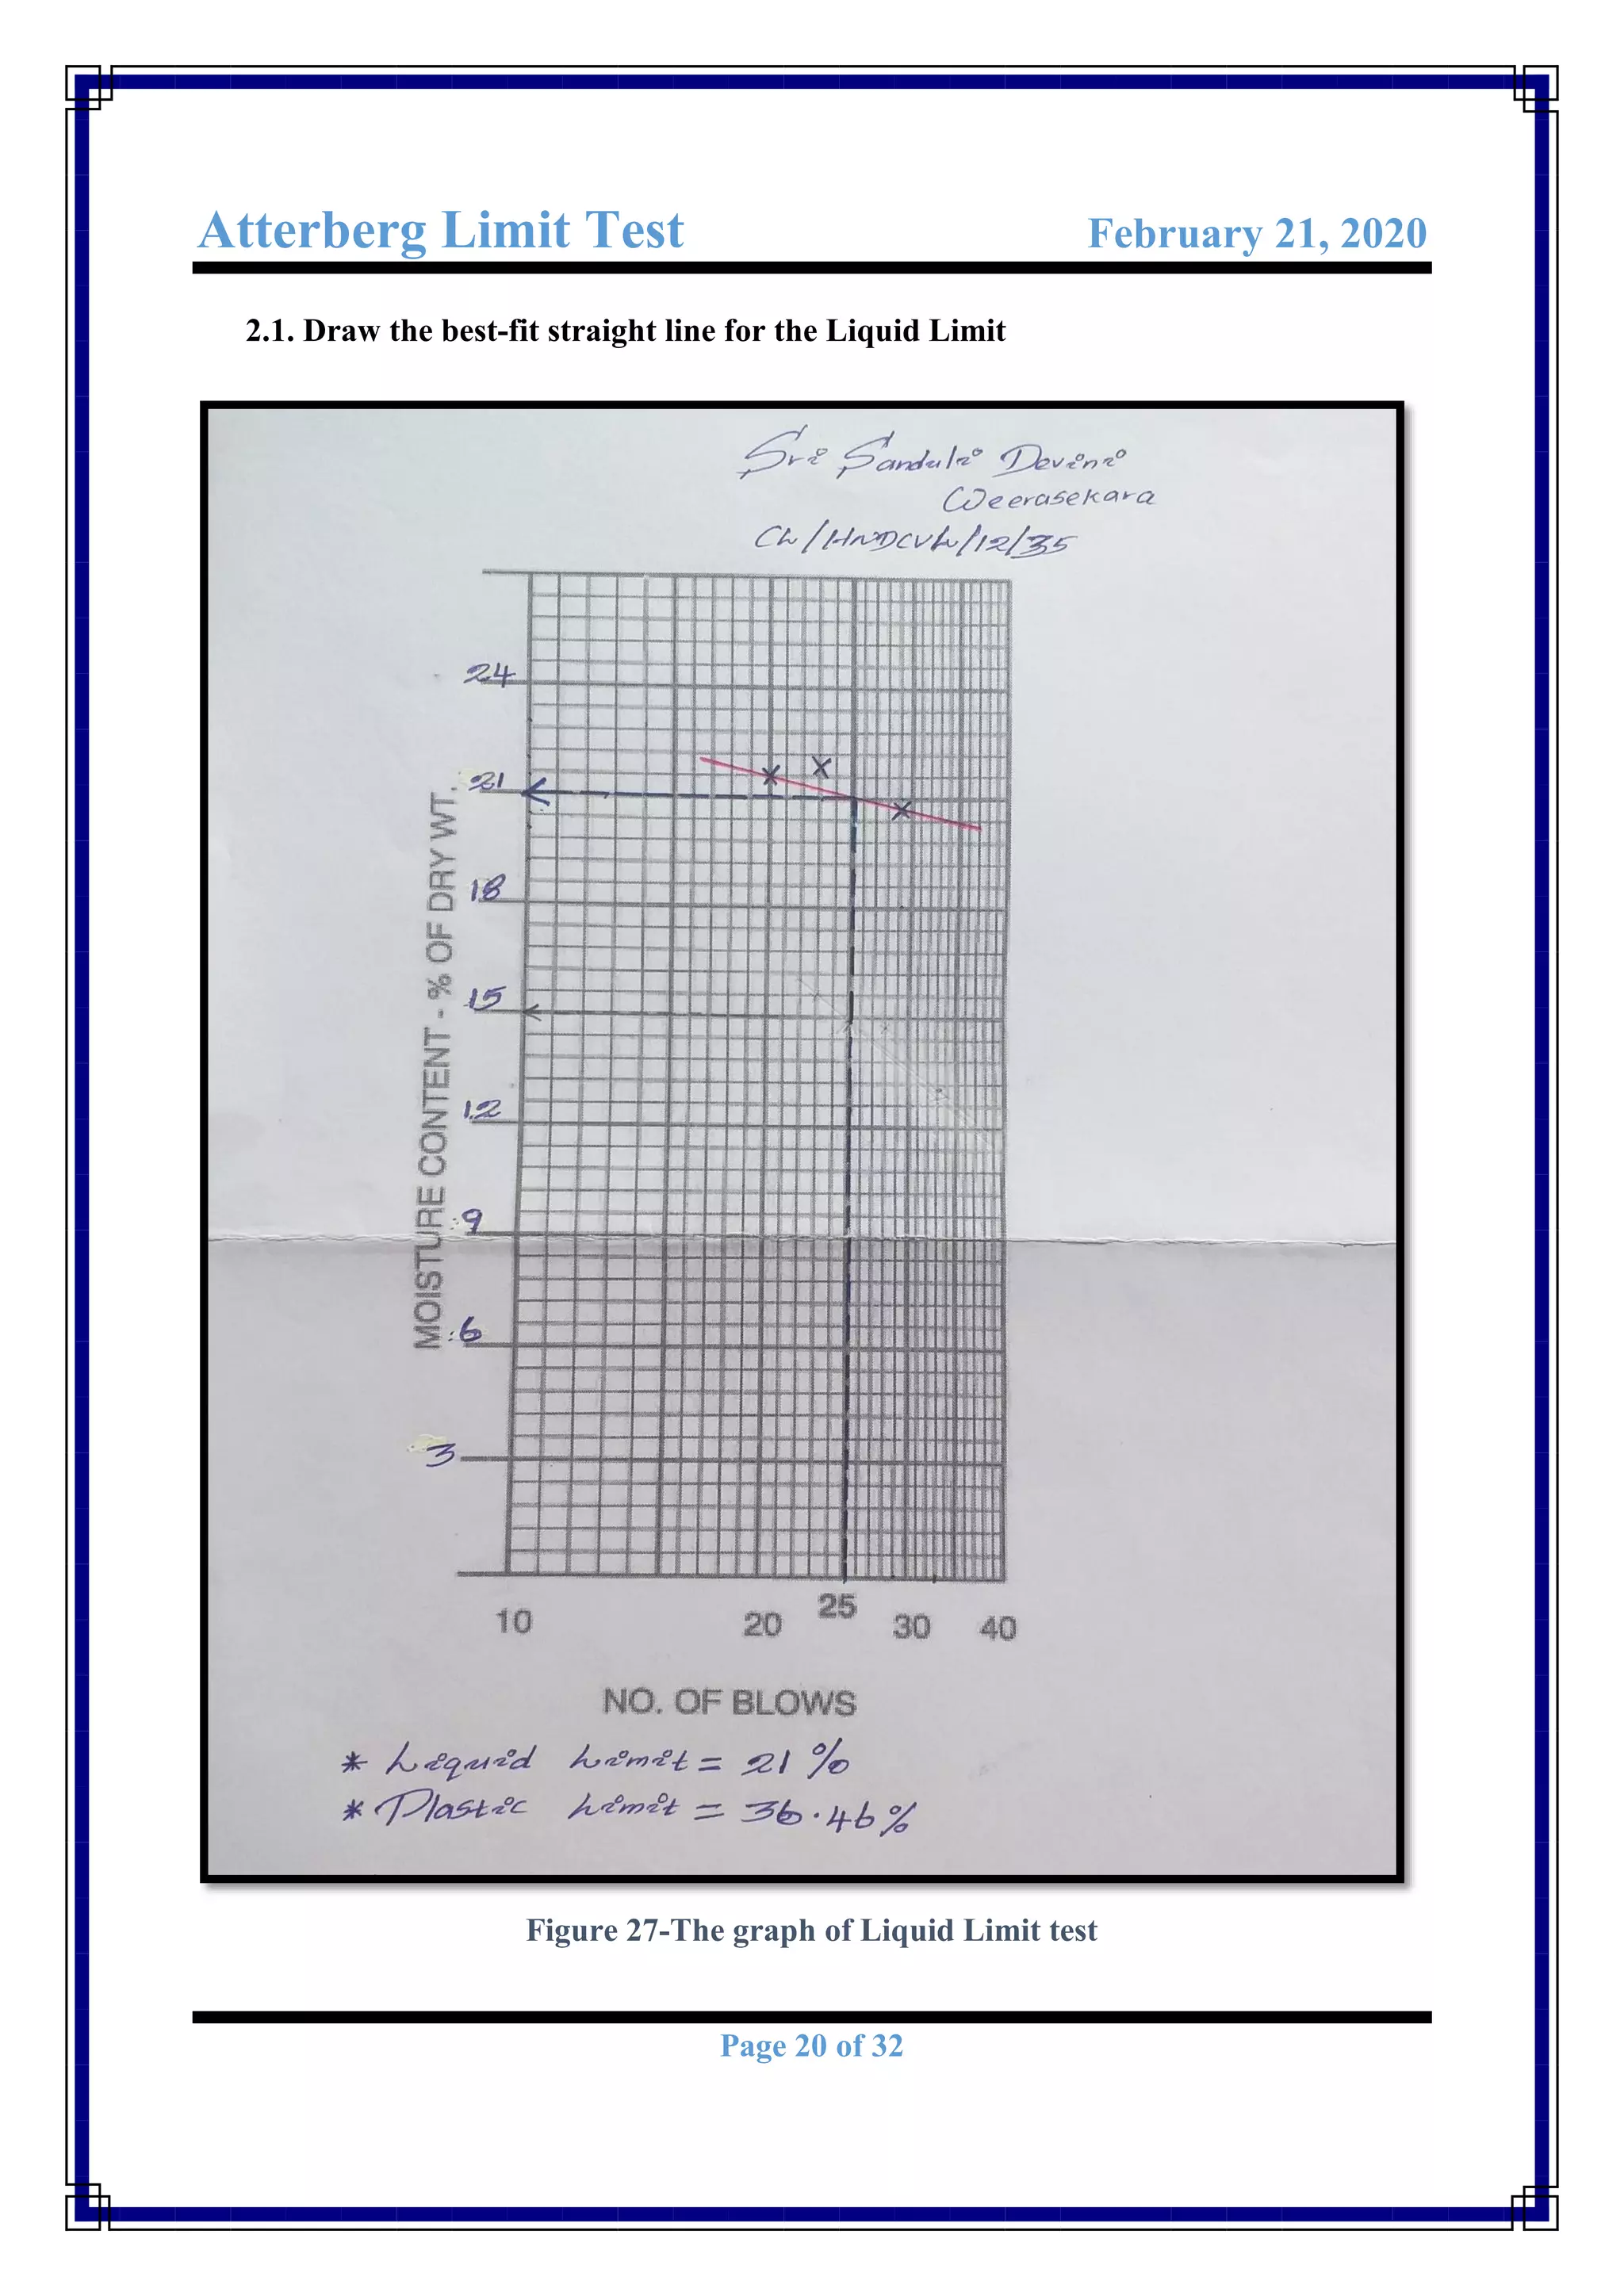
02. Draw the best-fit straight line for the liquid limit and determine the Liquid Limit
(LL)](https://image.slidesharecdn.com/atterberglimittest-copy-200702053343/75/Atterberg-Limit-Test-19-2048.jpg)


![Atterberg Limit Test February 21, 2020
Page 31 of 32
7.0. References
Anon., 2001. Determination of Atterberg Limits. [Online]
Available at:
http://www.rhd.gov.bd/Documents/ContractDocuments/StandardTestProcedures/Determi
nation%20of%20Atterberg%20Limits.pdf
[Accessed 05 2001].
Anon., n.d. Apparatus & Materials of Atterberg Test. [Online]
Available at:
https://www.google.com/search?q=Apparatus+%26+Materials+of+Atterberg+Test&clien
t=opera&hs=0So&source=lnms&tbm=isch&sa=X&ved=2ahUKEwiMz6Pck-
DnAhVCXHwKHUviBHgQ_AUoAXoECA0QAw&biw=710&bih=736
Anon., n.d. Atterberg Limits. [Online]
Available at: https://www.geoengineer.org/education/laboratory-testing/atterberg-limits
Anon., n.d. Atterberg Limits: A Quick Reference Guide. [Online]
Available at: https://www.globalgilson.com/blog/atterberg-limits-a-quick-reference-guide
Anon., n.d. Atterberg Limits: Determination of Plastic, Liquid, & Shrinkage Limits.
[Online]
Available at: https://civilseek.com/atterberg-limits/
Anon., n.d. Plasticity Chart. [Online]
Available at: https://image.slidesharecdn.com/lecture3consistncyofsoil-
161028162027/95/lecture-3-consistncy-of-soil-58-638.jpg?cb=1477671639
Buddhika, M., 2013. Atterberg limits test. [Online]
Available at: https://www.slideshare.net/malithwijaya1/atterberg-limits-test
[Accessed 11 09 2013].
Jajurie, N.-R., 2016. Lab Report #2: Liquid Limit, Plastic Limit, and Plasticity Index of
Soils. [Online]](https://image.slidesharecdn.com/atterberglimittest-copy-200702053343/75/Atterberg-Limit-Test-31-2048.jpg)
![Atterberg Limit Test February 21, 2020
Page 32 of 32
Available at:
https://www.academia.edu/28124222/Lab_Report_2_Liquid_Limit_Plastic_Limit_and_Pl
asticity_Index_of_Soils
[Accessed 8 March 2016].
Jamal, H., 2017. Atterberg Limits of Soil Classification. [Online]
Available at: https://www.aboutcivil.org/atterberg-limits.html
[Accessed 23 03 2017].
State Of New York, D. O. T., 2015. TEST METHOD FOR LIQUID LIMIT, PLASTIC
LIMIT, AND PLASTICITY INDEX. [Online]
Available at: https://www.dot.ny.gov/divisions/engineering/technical-services/technical-
services-repository/GTM-7b.pdf
[Accessed AUGUST 2015].](https://image.slidesharecdn.com/atterberglimittest-copy-200702053343/75/Atterberg-Limit-Test-32-2048.jpg)


