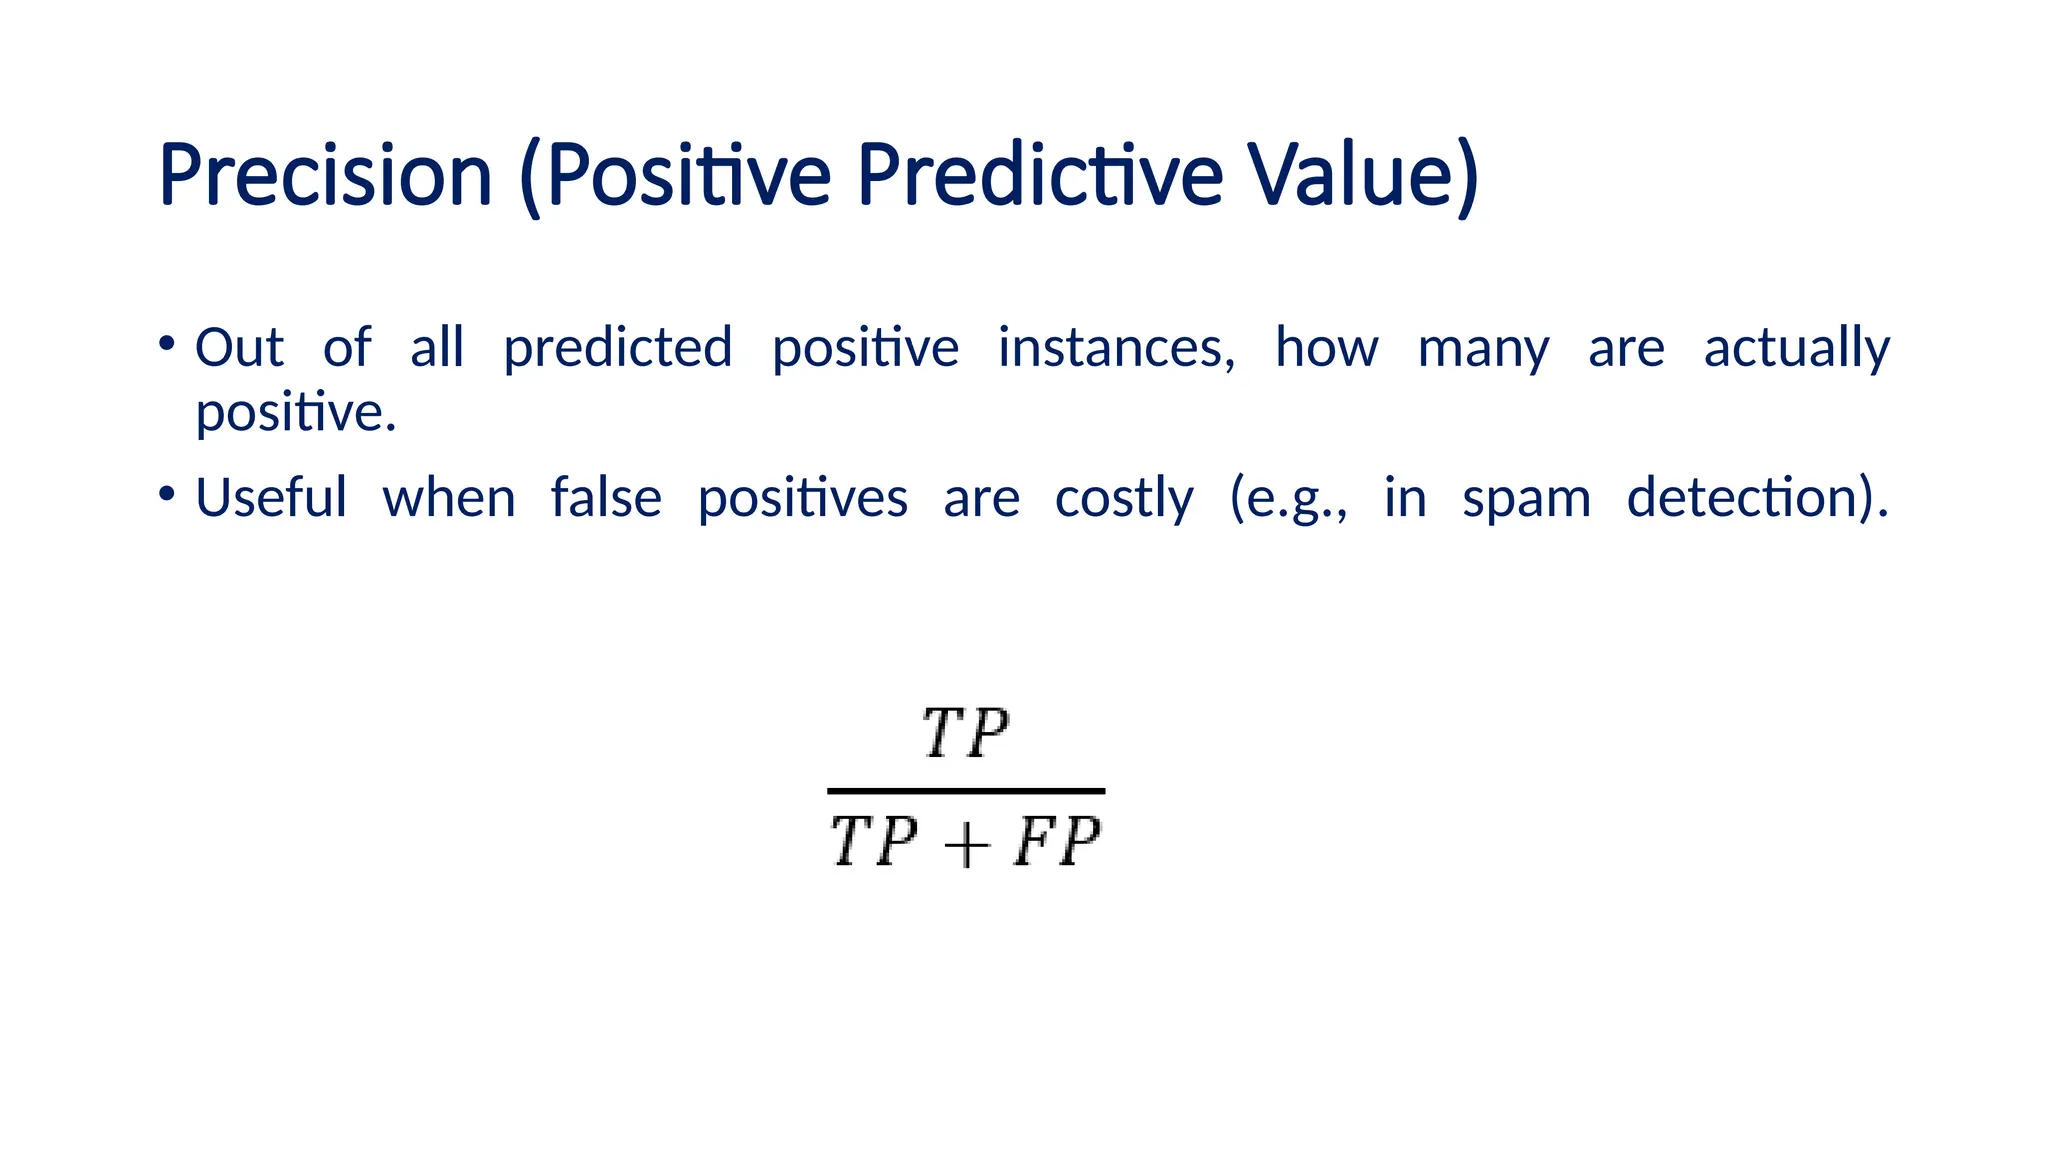
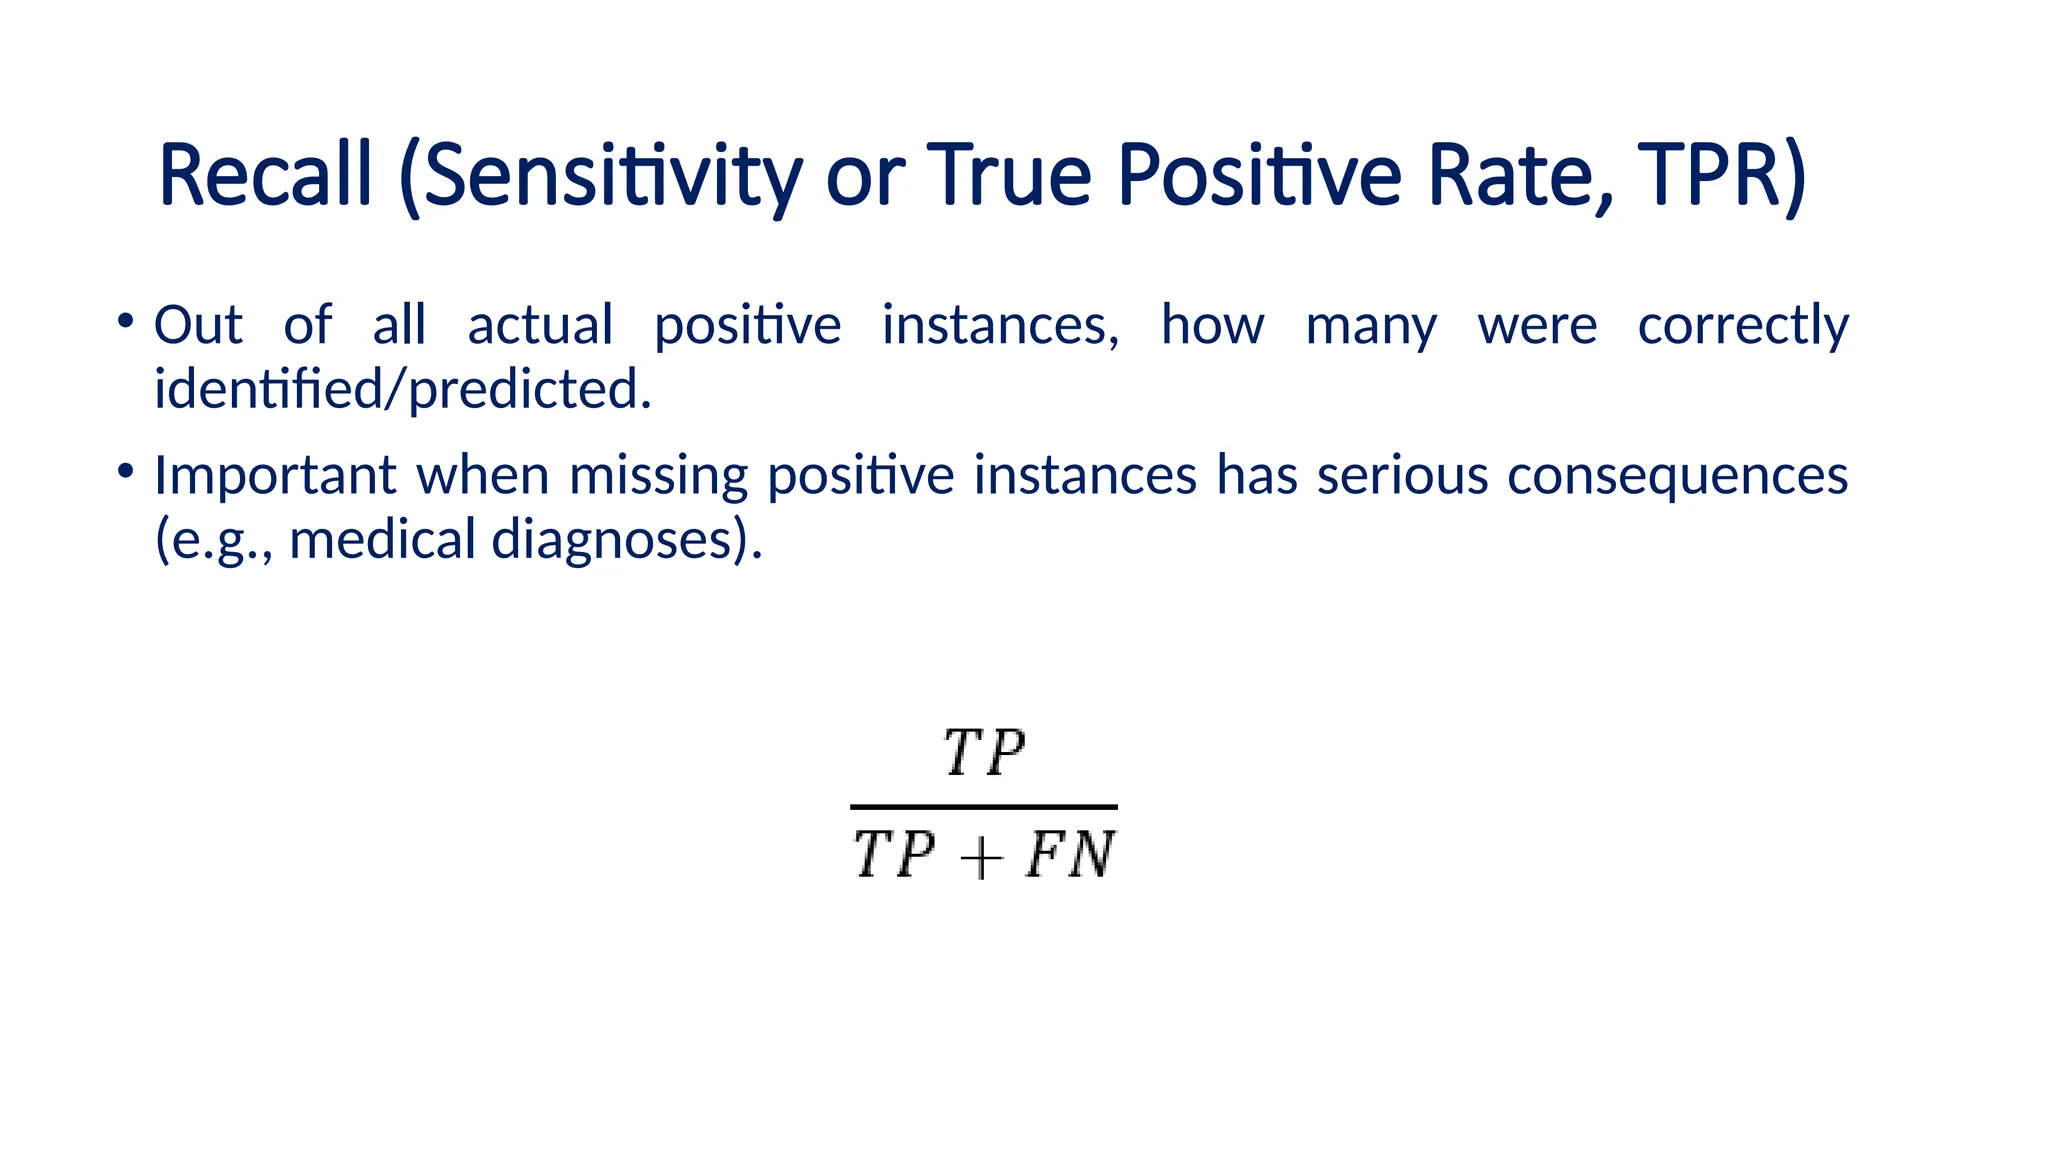
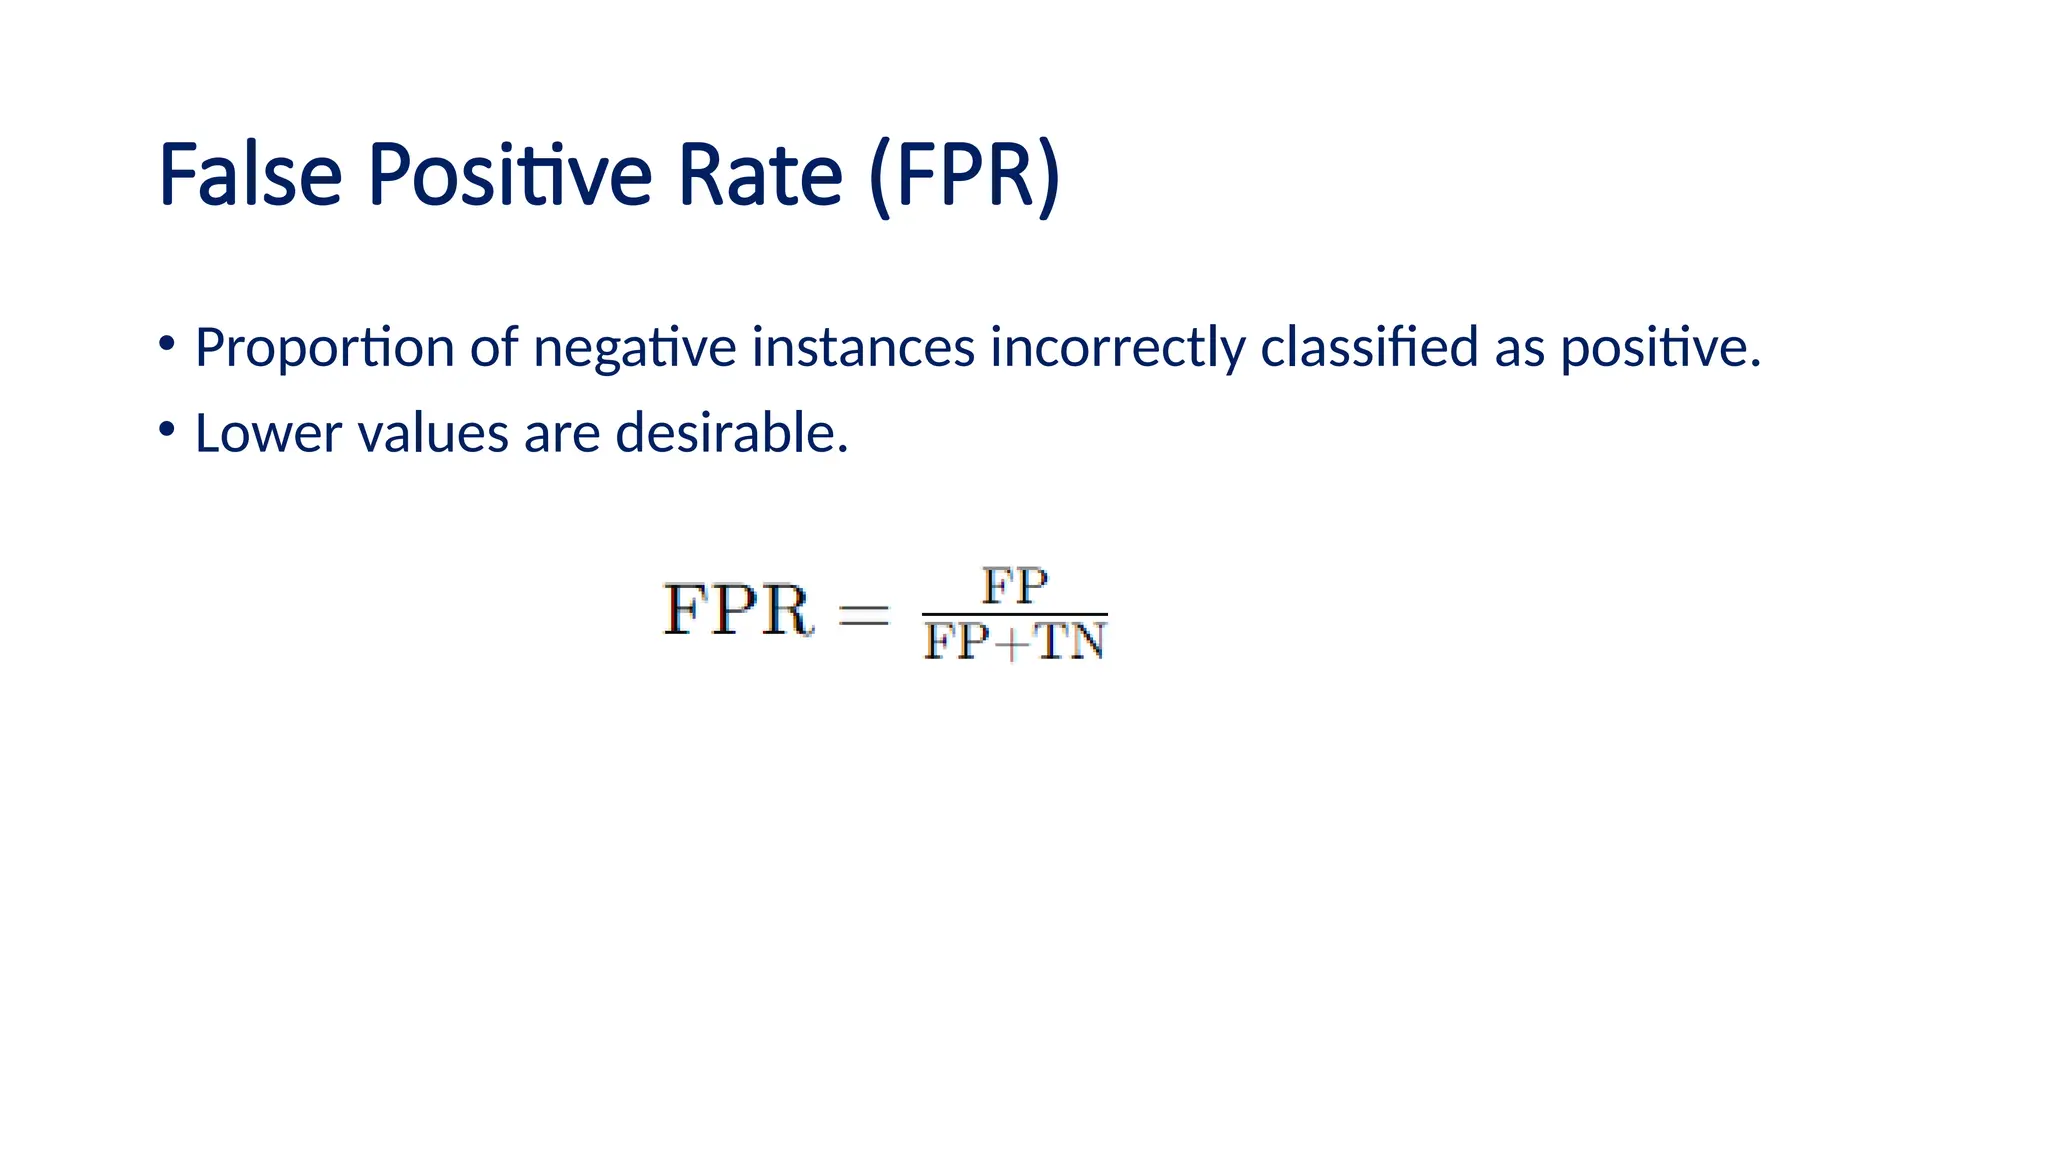
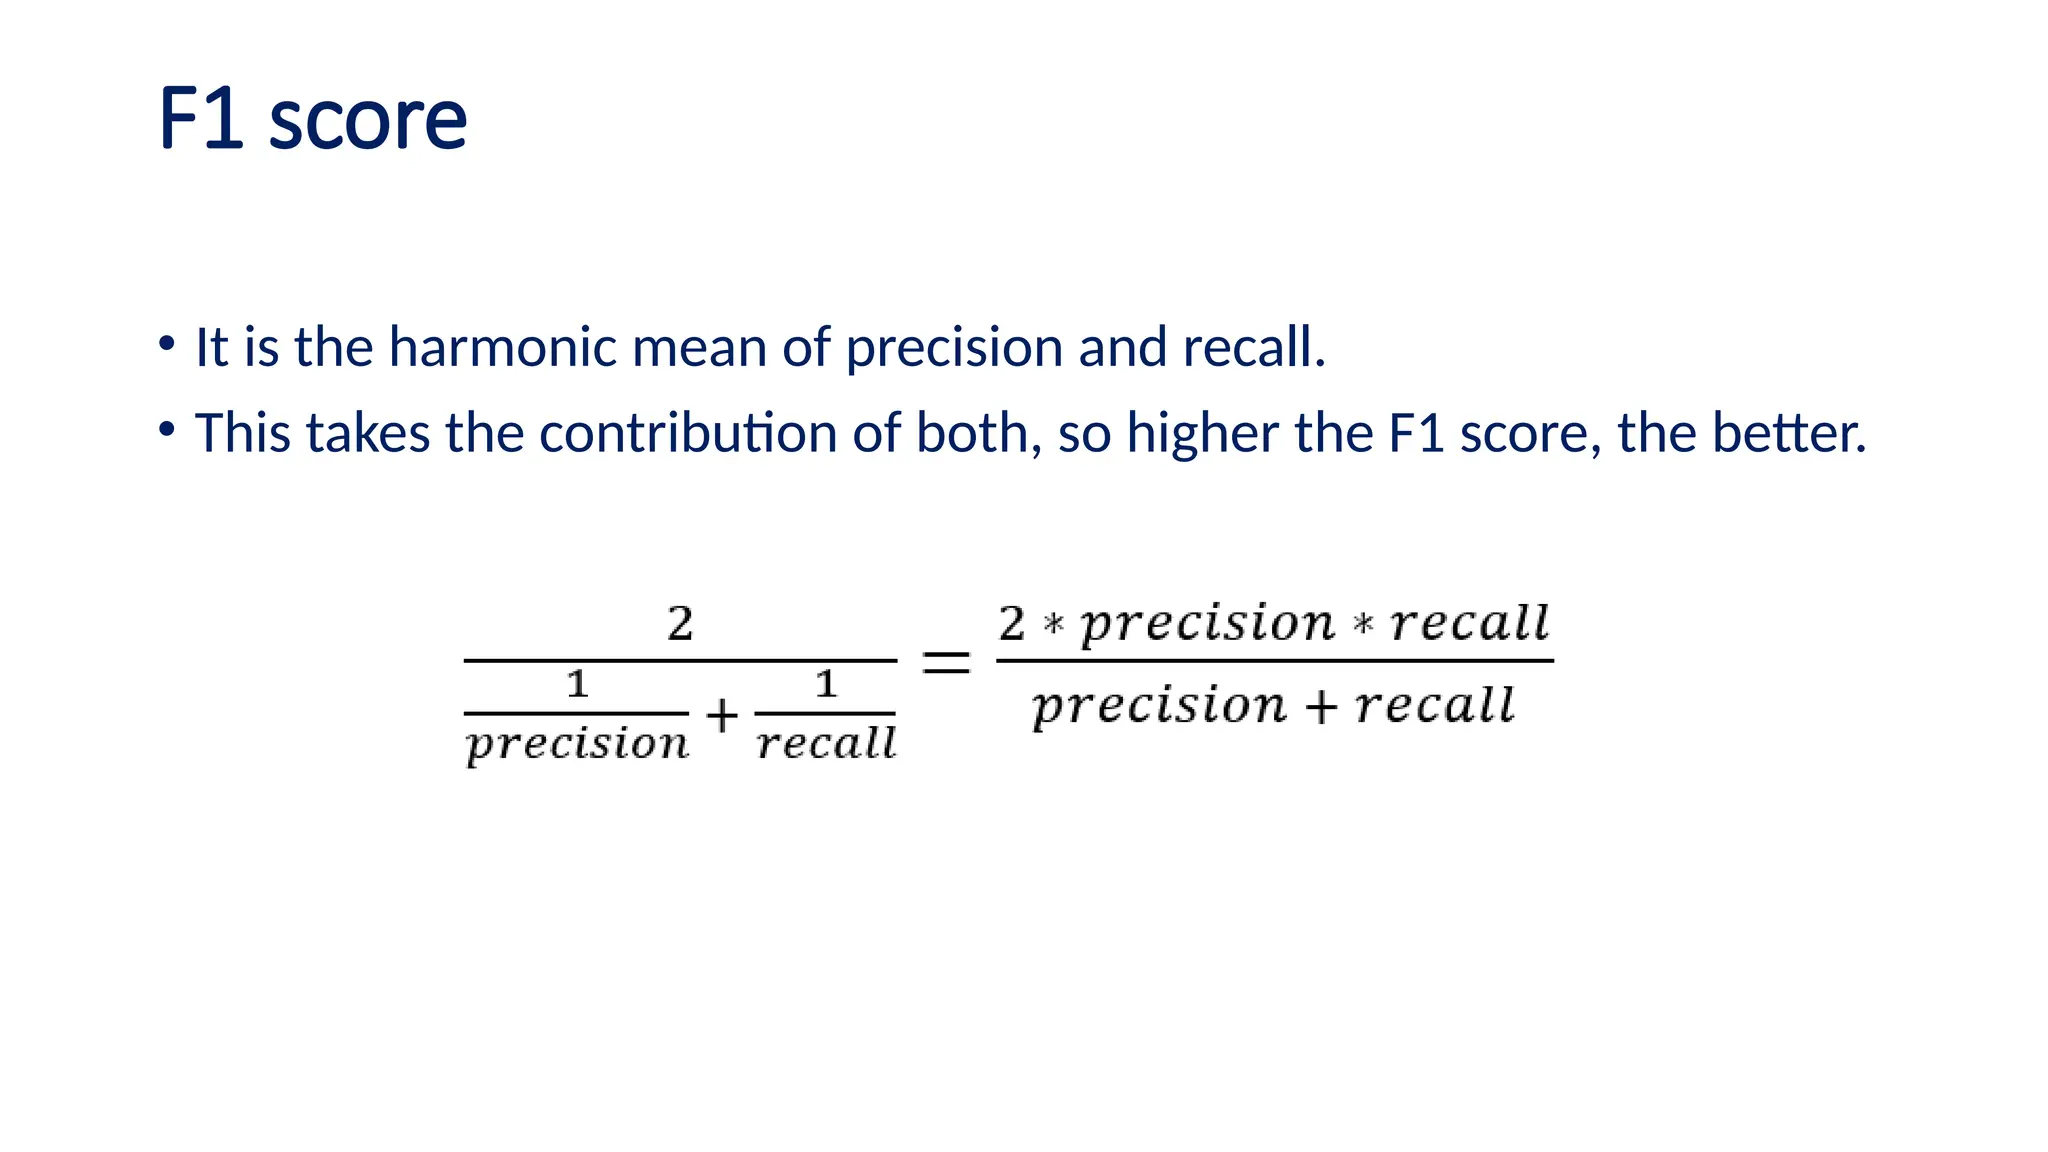
Module 4
Evaluation measures
Evaluating a ML model
• How well is my model doing? Is it a useful model?
• Will training my model on more data improve its performance?
• Do I need to include more features?
Metrics
• Classification metrics
• When performing classification predictions, there's four types of
outcomes that could occur.
• True positives are when you predict an observation belongs to a class
and it actually does belong to that class.
• True negatives are when you predict an observation does not belong
to a class and it actually does not belong to that class.
• False positives occur when you predict an observation belongs to a
class when in reality it does not.
• False negatives occur when you predict an observation does not
belong to a class when in fact it does.
Classification metrics
Accuracy
• Measures the percentage of correctly predicted instances.
• However, it may not be reliable for imbalanced datasets.
Precision (Positive Predictive Value)
• Out of all predicted positive instances, how many are actually
positive.
• Useful when false positives are costly (e.g., in spam detection).
Recall (Sensitivity or True Positive Rate, TPR)
• Out of all actual positive instances, how many were correctly
identified/predicted.
• Important when missing positive instances has serious consequences
(e.g., medical diagnoses).
False Positive Rate (FPR)
• Proportion of negative instances incorrectly classified as positive.
• Lower values are desirable.
F1 score
• It is the harmonic mean of precision and recall.
• This takes the contribution of both, so higher the F1 score, the better.
Example
ROC curve
• ROC stands for receiver operating characteristic and the graph is
plotted against TPR and FPR for various threshold values.
• As TPR increases FPR also increases.
ROC curve
ROC curve
• As you can see in the first figure, we have four categories and we
want the threshold value that leads us closer to the top left corner.
• Comparing different predictors (here 3) on a given dataset also
becomes easy as you can see in figure 2, one can choose the
threshold according to the application at hand. ROC AUC is just the
area under the curve, the higher its numerical value the better.
Bias vs Variance
• In general, a machine learning model analyses the data, find patterns
in it and make predictions.
• While training, the model learns these patterns in the dataset and
applies them to test data for prediction.
• While making predictions, a difference occurs between prediction
values made by the model and actual values/expected values, and
this difference is known as bias errors or Errors due to bias.
• It can be defined as an inability of machine learning algorithms such
as Linear Regression to capture the true relationship between the
data points.
Bias vs Variance
• Low Bias: A low bias model will make fewer assumptions about the
form of the target function.
• High Bias: A model with a high bias makes more assumptions, and the
model becomes unable to capture the important features of our
dataset. A high bias model also cannot perform well on new data.
Bias vs Variance
• The variance would specify the amount of variation in the prediction
if the different training data was used.
• Variance refers to the model’s sensitivity to small fluctuations in the
training data.
• It measures how much the model’s predictions change when trained
on different subsets of the training data.
• Variance errors are either of low variance or high variance.
Bias vs Variance
• Low variance means there is a small variation in the prediction of the
target function with changes in the training data set.
• At the same time, High variance shows a large variation in the
prediction of the target function with changes in the training dataset.
• A model that shows high variance learns a lot and perform well with
the training dataset, and does not generalize well with the unseen
dataset.
• As a result, such a model gives good results with the training dataset
but shows high error rates on the test dataset.
Different Combinations of Bias-Variance
• Low-Bias, Low-Variance:
The combination of low bias and low variance shows an ideal machine learning
model. However, it is not possible practically.
• Low-Bias, High-Variance: With low bias and high variance, model predictions are
inconsistent and accurate on average. This case occurs when the model learns
with a large number of parameters and hence leads to an overfitting
• High-Bias, Low-Variance: With High bias and low variance, predictions are
consistent but inaccurate on average. This case occurs when a model does not
learn well with the training dataset or uses few numbers of the parameter. It
leads to underfitting problems in the model.
• High-Bias, High-Variance:
With high bias and high variance, predictions are inconsistent and also
inaccurate on average.
• In summary, a model with high bias is limited from learning the true
trend and underfits the data.
• A model with high variance learns too much from the training data
and overfits the data.
• The best model sits somewhere in the middle of the two extremes.

Evaluation measures Data Science Course.pptx

  • 1.
  • 2.
    Evaluating a MLmodel • How well is my model doing? Is it a useful model? • Will training my model on more data improve its performance? • Do I need to include more features?
  • 3.
    Metrics • Classification metrics •When performing classification predictions, there's four types of outcomes that could occur. • True positives are when you predict an observation belongs to a class and it actually does belong to that class. • True negatives are when you predict an observation does not belong to a class and it actually does not belong to that class. • False positives occur when you predict an observation belongs to a class when in reality it does not. • False negatives occur when you predict an observation does not belong to a class when in fact it does.
  • 4.
  • 5.
    Accuracy • Measures thepercentage of correctly predicted instances. • However, it may not be reliable for imbalanced datasets.
  • 6.
    Precision (Positive PredictiveValue) • Out of all predicted positive instances, how many are actually positive. • Useful when false positives are costly (e.g., in spam detection).
  • 7.
    Recall (Sensitivity orTrue Positive Rate, TPR) • Out of all actual positive instances, how many were correctly identified/predicted. • Important when missing positive instances has serious consequences (e.g., medical diagnoses).
  • 8.
    False Positive Rate(FPR) • Proportion of negative instances incorrectly classified as positive. • Lower values are desirable.
  • 9.
    F1 score • Itis the harmonic mean of precision and recall. • This takes the contribution of both, so higher the F1 score, the better.
  • 10.
  • 11.
    ROC curve • ROCstands for receiver operating characteristic and the graph is plotted against TPR and FPR for various threshold values. • As TPR increases FPR also increases.
  • 12.
  • 13.
    ROC curve • Asyou can see in the first figure, we have four categories and we want the threshold value that leads us closer to the top left corner. • Comparing different predictors (here 3) on a given dataset also becomes easy as you can see in figure 2, one can choose the threshold according to the application at hand. ROC AUC is just the area under the curve, the higher its numerical value the better.
  • 14.
    Bias vs Variance •In general, a machine learning model analyses the data, find patterns in it and make predictions. • While training, the model learns these patterns in the dataset and applies them to test data for prediction. • While making predictions, a difference occurs between prediction values made by the model and actual values/expected values, and this difference is known as bias errors or Errors due to bias. • It can be defined as an inability of machine learning algorithms such as Linear Regression to capture the true relationship between the data points.
  • 15.
    Bias vs Variance •Low Bias: A low bias model will make fewer assumptions about the form of the target function. • High Bias: A model with a high bias makes more assumptions, and the model becomes unable to capture the important features of our dataset. A high bias model also cannot perform well on new data.
  • 16.
    Bias vs Variance •The variance would specify the amount of variation in the prediction if the different training data was used. • Variance refers to the model’s sensitivity to small fluctuations in the training data. • It measures how much the model’s predictions change when trained on different subsets of the training data. • Variance errors are either of low variance or high variance.
  • 17.
    Bias vs Variance •Low variance means there is a small variation in the prediction of the target function with changes in the training data set. • At the same time, High variance shows a large variation in the prediction of the target function with changes in the training dataset. • A model that shows high variance learns a lot and perform well with the training dataset, and does not generalize well with the unseen dataset. • As a result, such a model gives good results with the training dataset but shows high error rates on the test dataset.
  • 18.
    Different Combinations ofBias-Variance • Low-Bias, Low-Variance: The combination of low bias and low variance shows an ideal machine learning model. However, it is not possible practically. • Low-Bias, High-Variance: With low bias and high variance, model predictions are inconsistent and accurate on average. This case occurs when the model learns with a large number of parameters and hence leads to an overfitting • High-Bias, Low-Variance: With High bias and low variance, predictions are consistent but inaccurate on average. This case occurs when a model does not learn well with the training dataset or uses few numbers of the parameter. It leads to underfitting problems in the model. • High-Bias, High-Variance: With high bias and high variance, predictions are inconsistent and also inaccurate on average.
  • 21.
    • In summary,a model with high bias is limited from learning the true trend and underfits the data. • A model with high variance learns too much from the training data and overfits the data. • The best model sits somewhere in the middle of the two extremes.