Download as PDF, PPTX
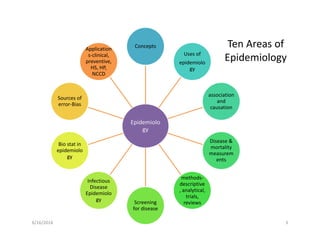
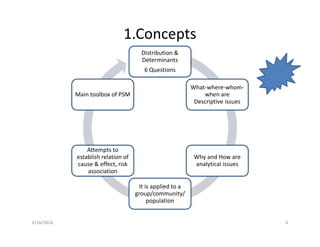
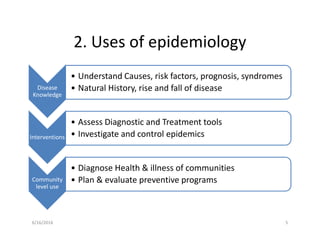
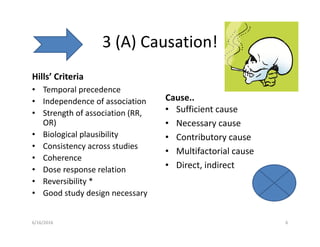
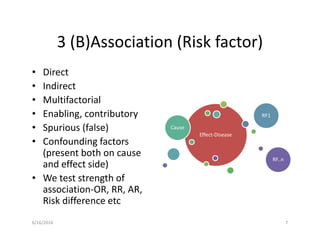
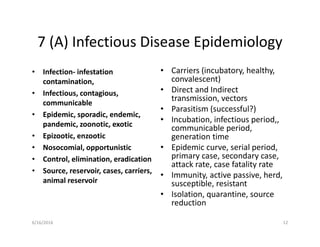
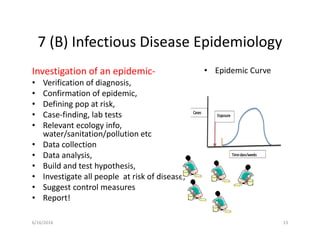
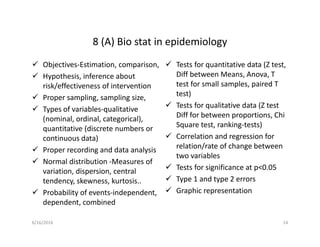
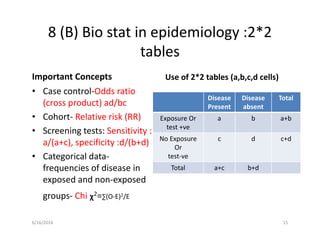


The document outlines key concepts and applications of epidemiology, emphasizing its role in understanding disease distribution and determinants, causation, and measurement of disease and mortality. It also details various types of epidemiological studies, screening methods, and biostatistical approaches essential for analyzing health data and making clinical decisions. Furthermore, it discusses common sources of error in studies and the importance of proper sampling and bias minimization in research.


![PERI-PROSTHETIC FRACTURE NAIL-PLATE CONSTRUCT [NPC].pptx](https://cdn.slidesharecdn.com/ss_thumbnails/drarunkumardrmohamedashrafperiprostheticfrasturenail-plateconstructnpc-260209164459-7e9d15a1-thumbnail.jpg?width=640&height=640&fit=bounds)


