Download to read offline


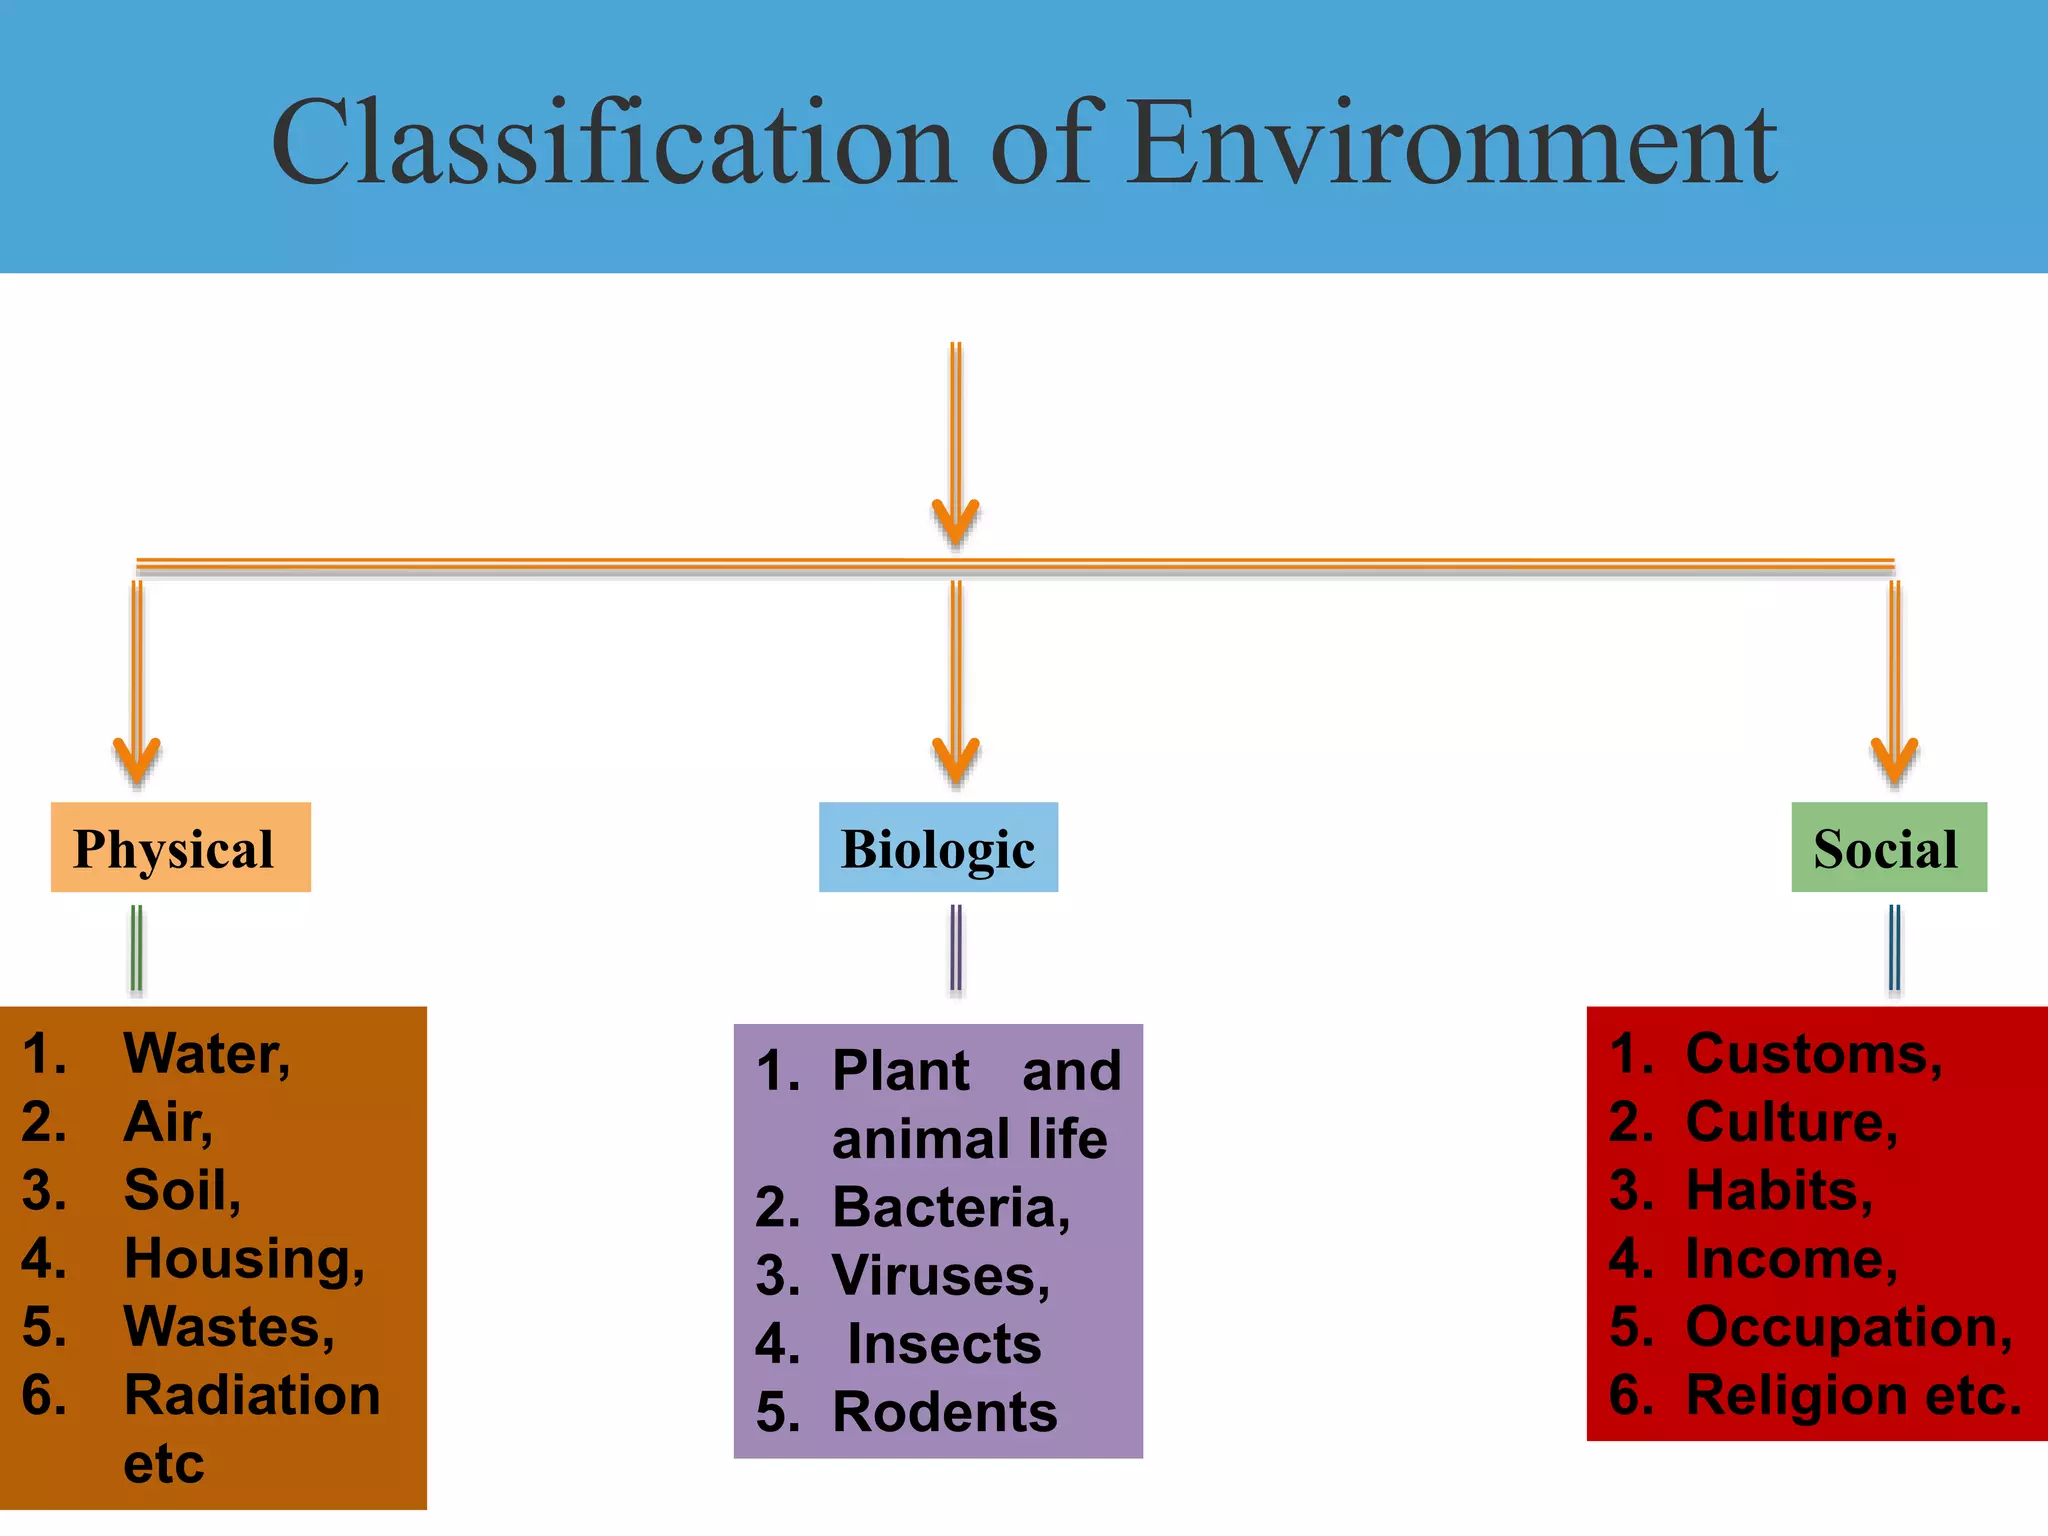


This document provides an overview of various environmental factors that impact health, with a focus on water. It defines key terms like environment and health. It describes different classifications of the environment and various water sources. It discusses water pollution, purification methods like chlorination and ozonation, and standards for drinking water quality. It also addresses issues like waterborne diseases, water hardness, air quality, and factors like noise, ventilation and housing that relate to environmental health.


