
![Thank you for attending! See us at the Trade Show Booth # 924 Contact Information Linnea Blair Tel 619.291.3700 Email [email_address] www.AdvisorsOnTarget.com](https://image.slidesharecdn.com/PACE2009EffectiveFinancialManagement-090222180043-phpapp02/75/Pace-2009-Effective-Financial-Management-41-2048.jpg)

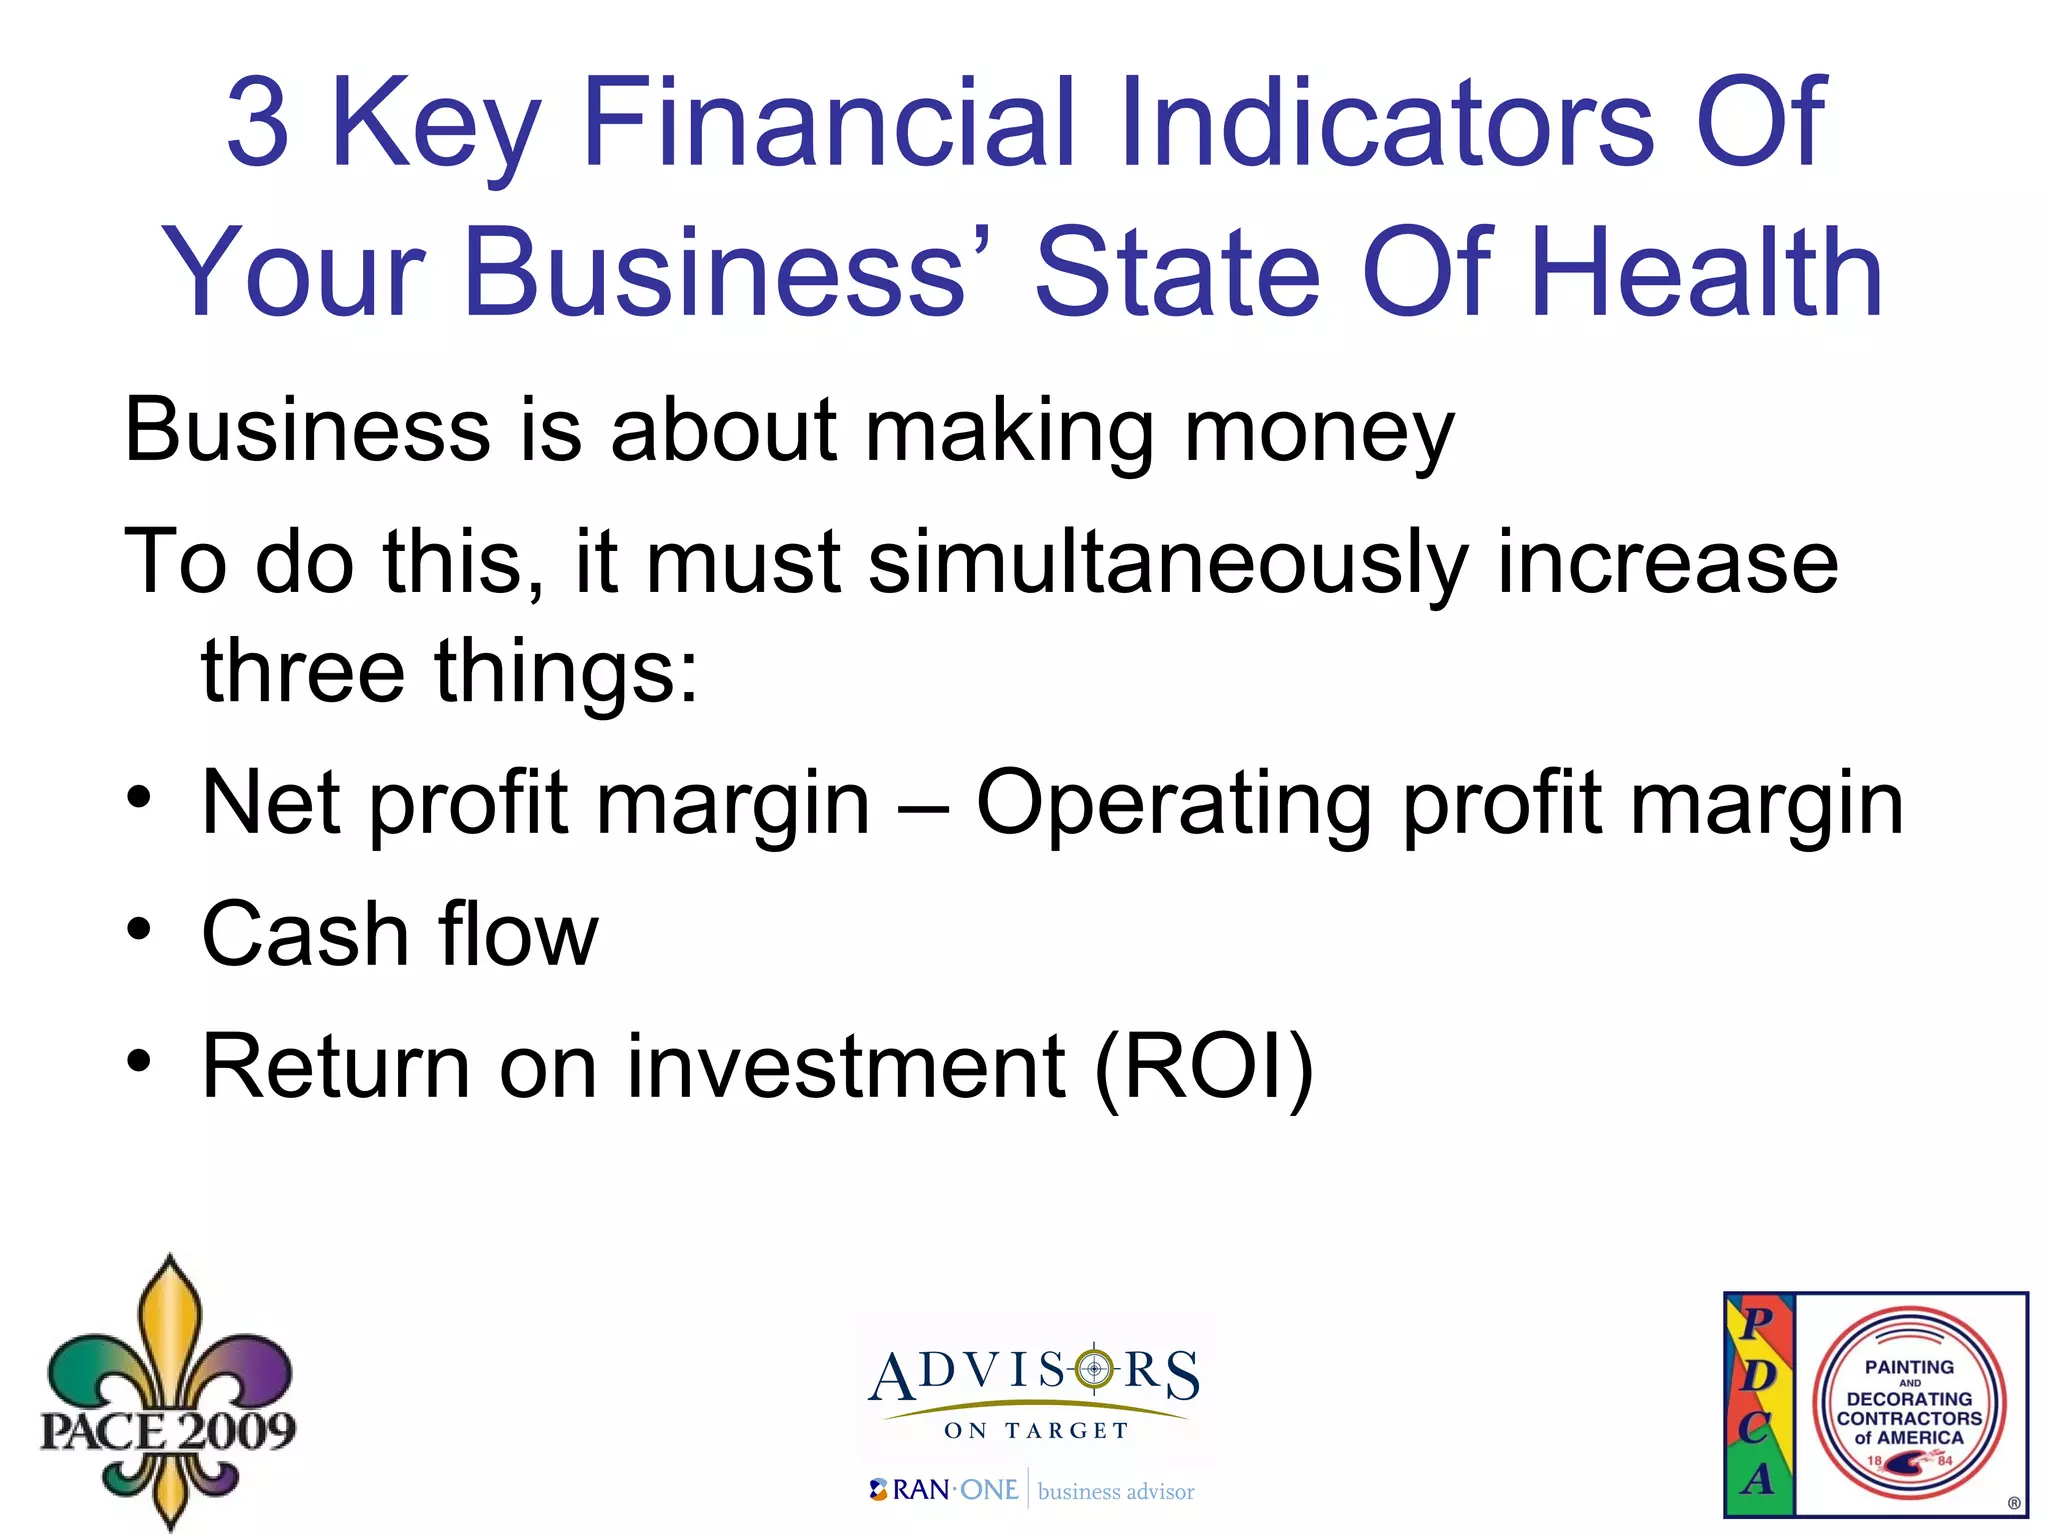
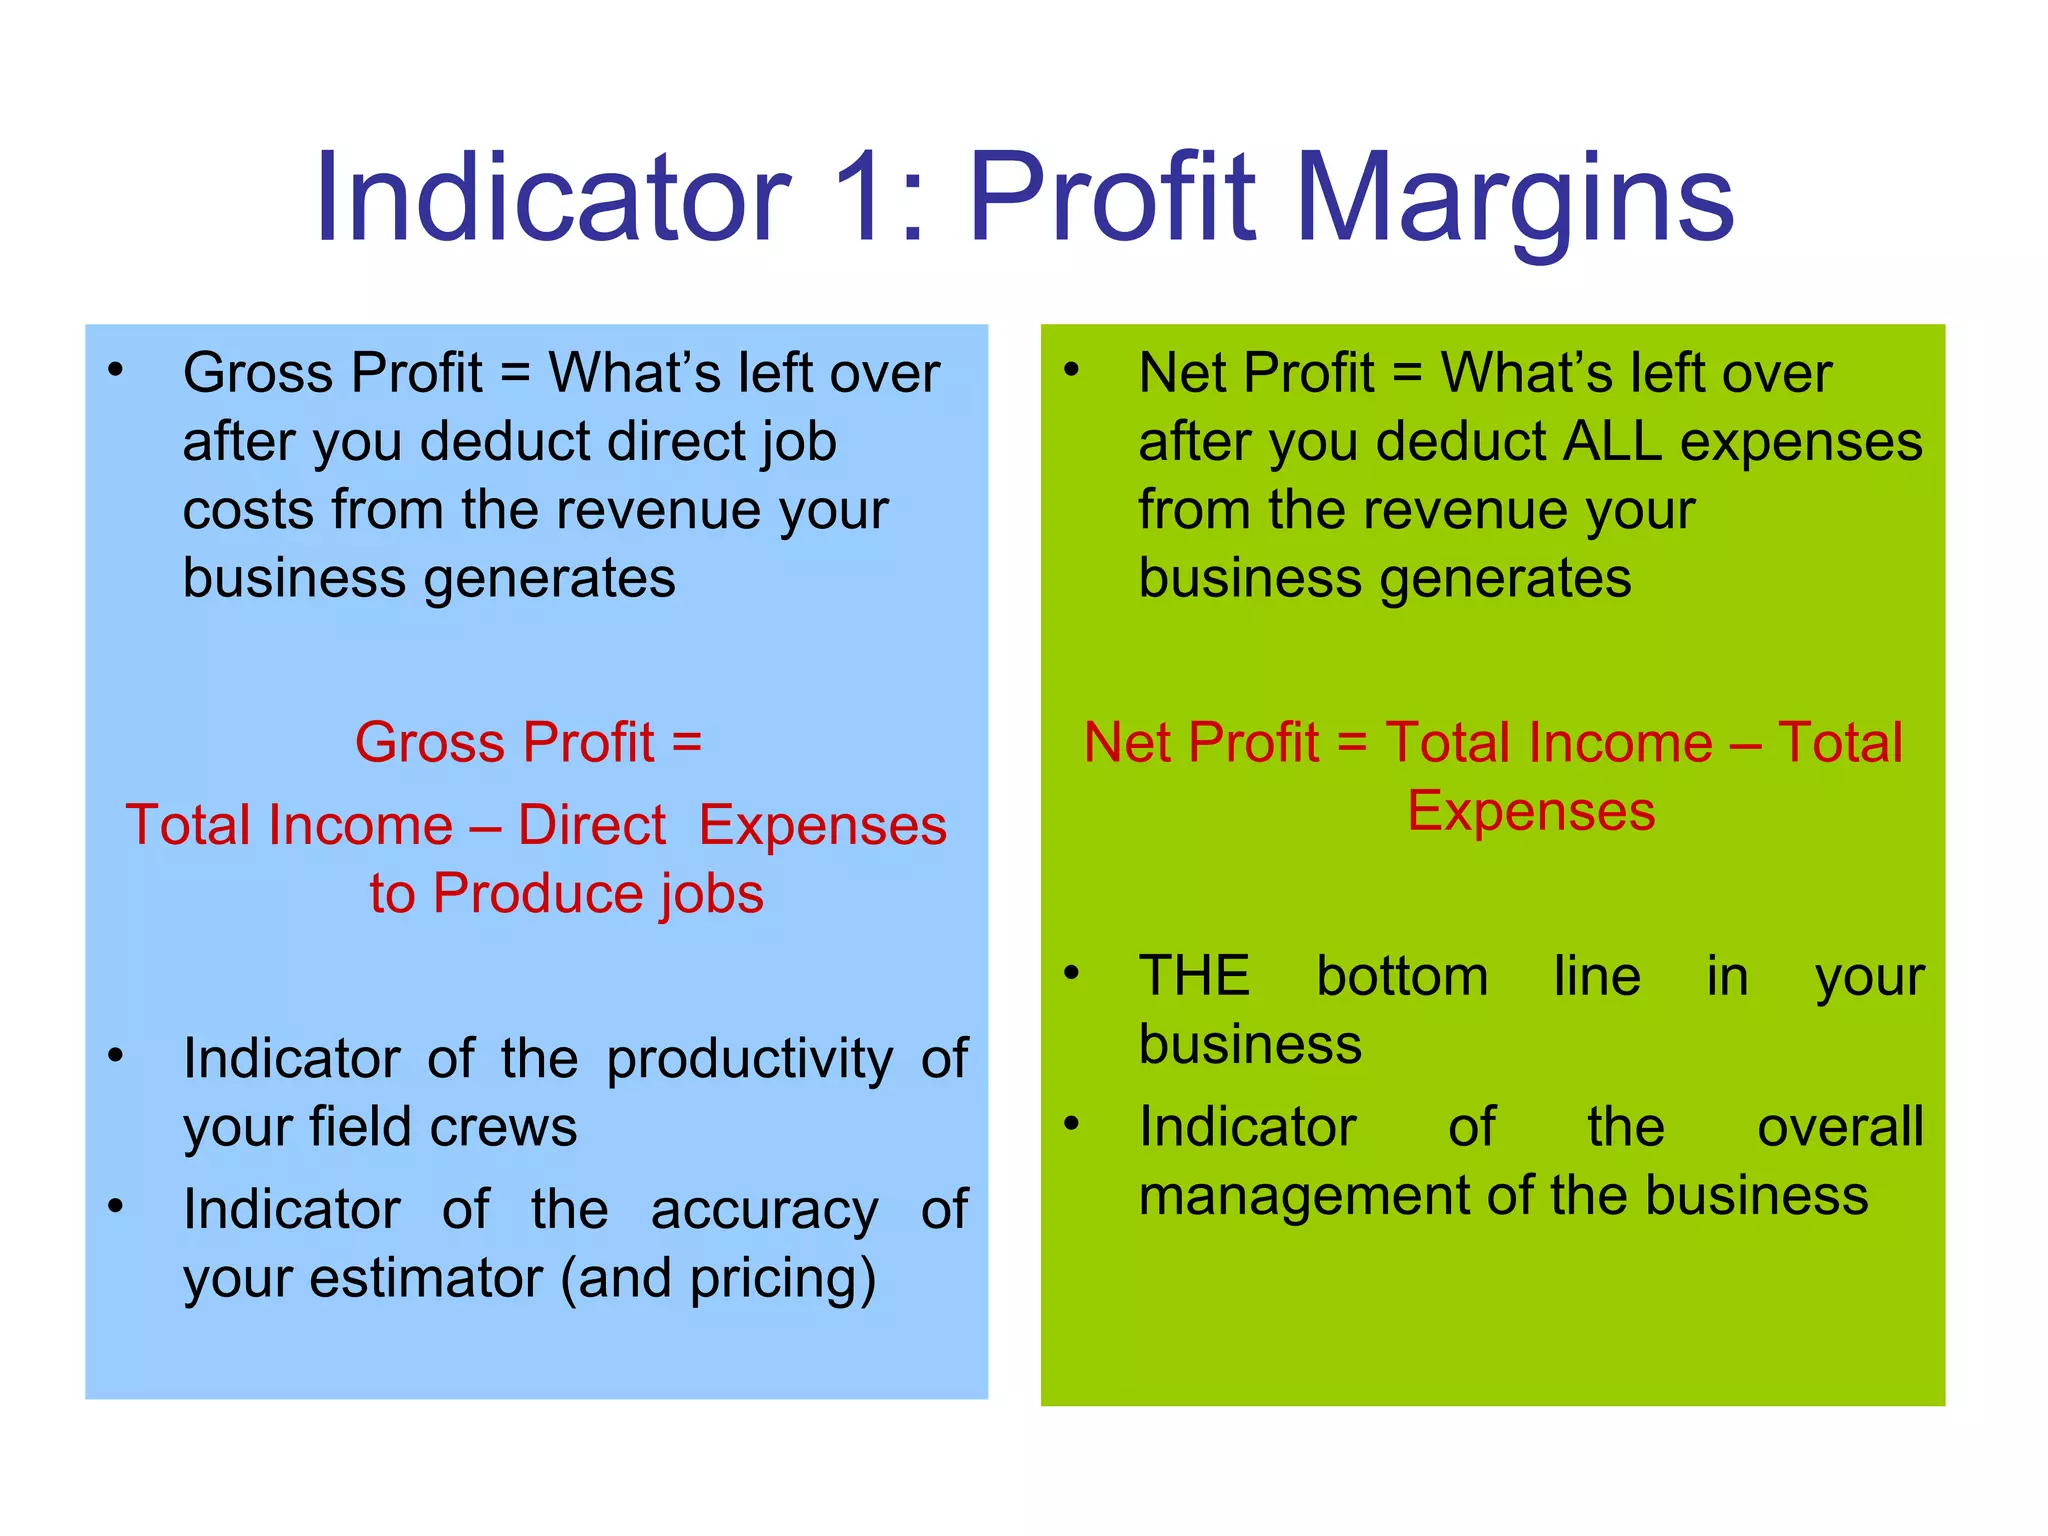
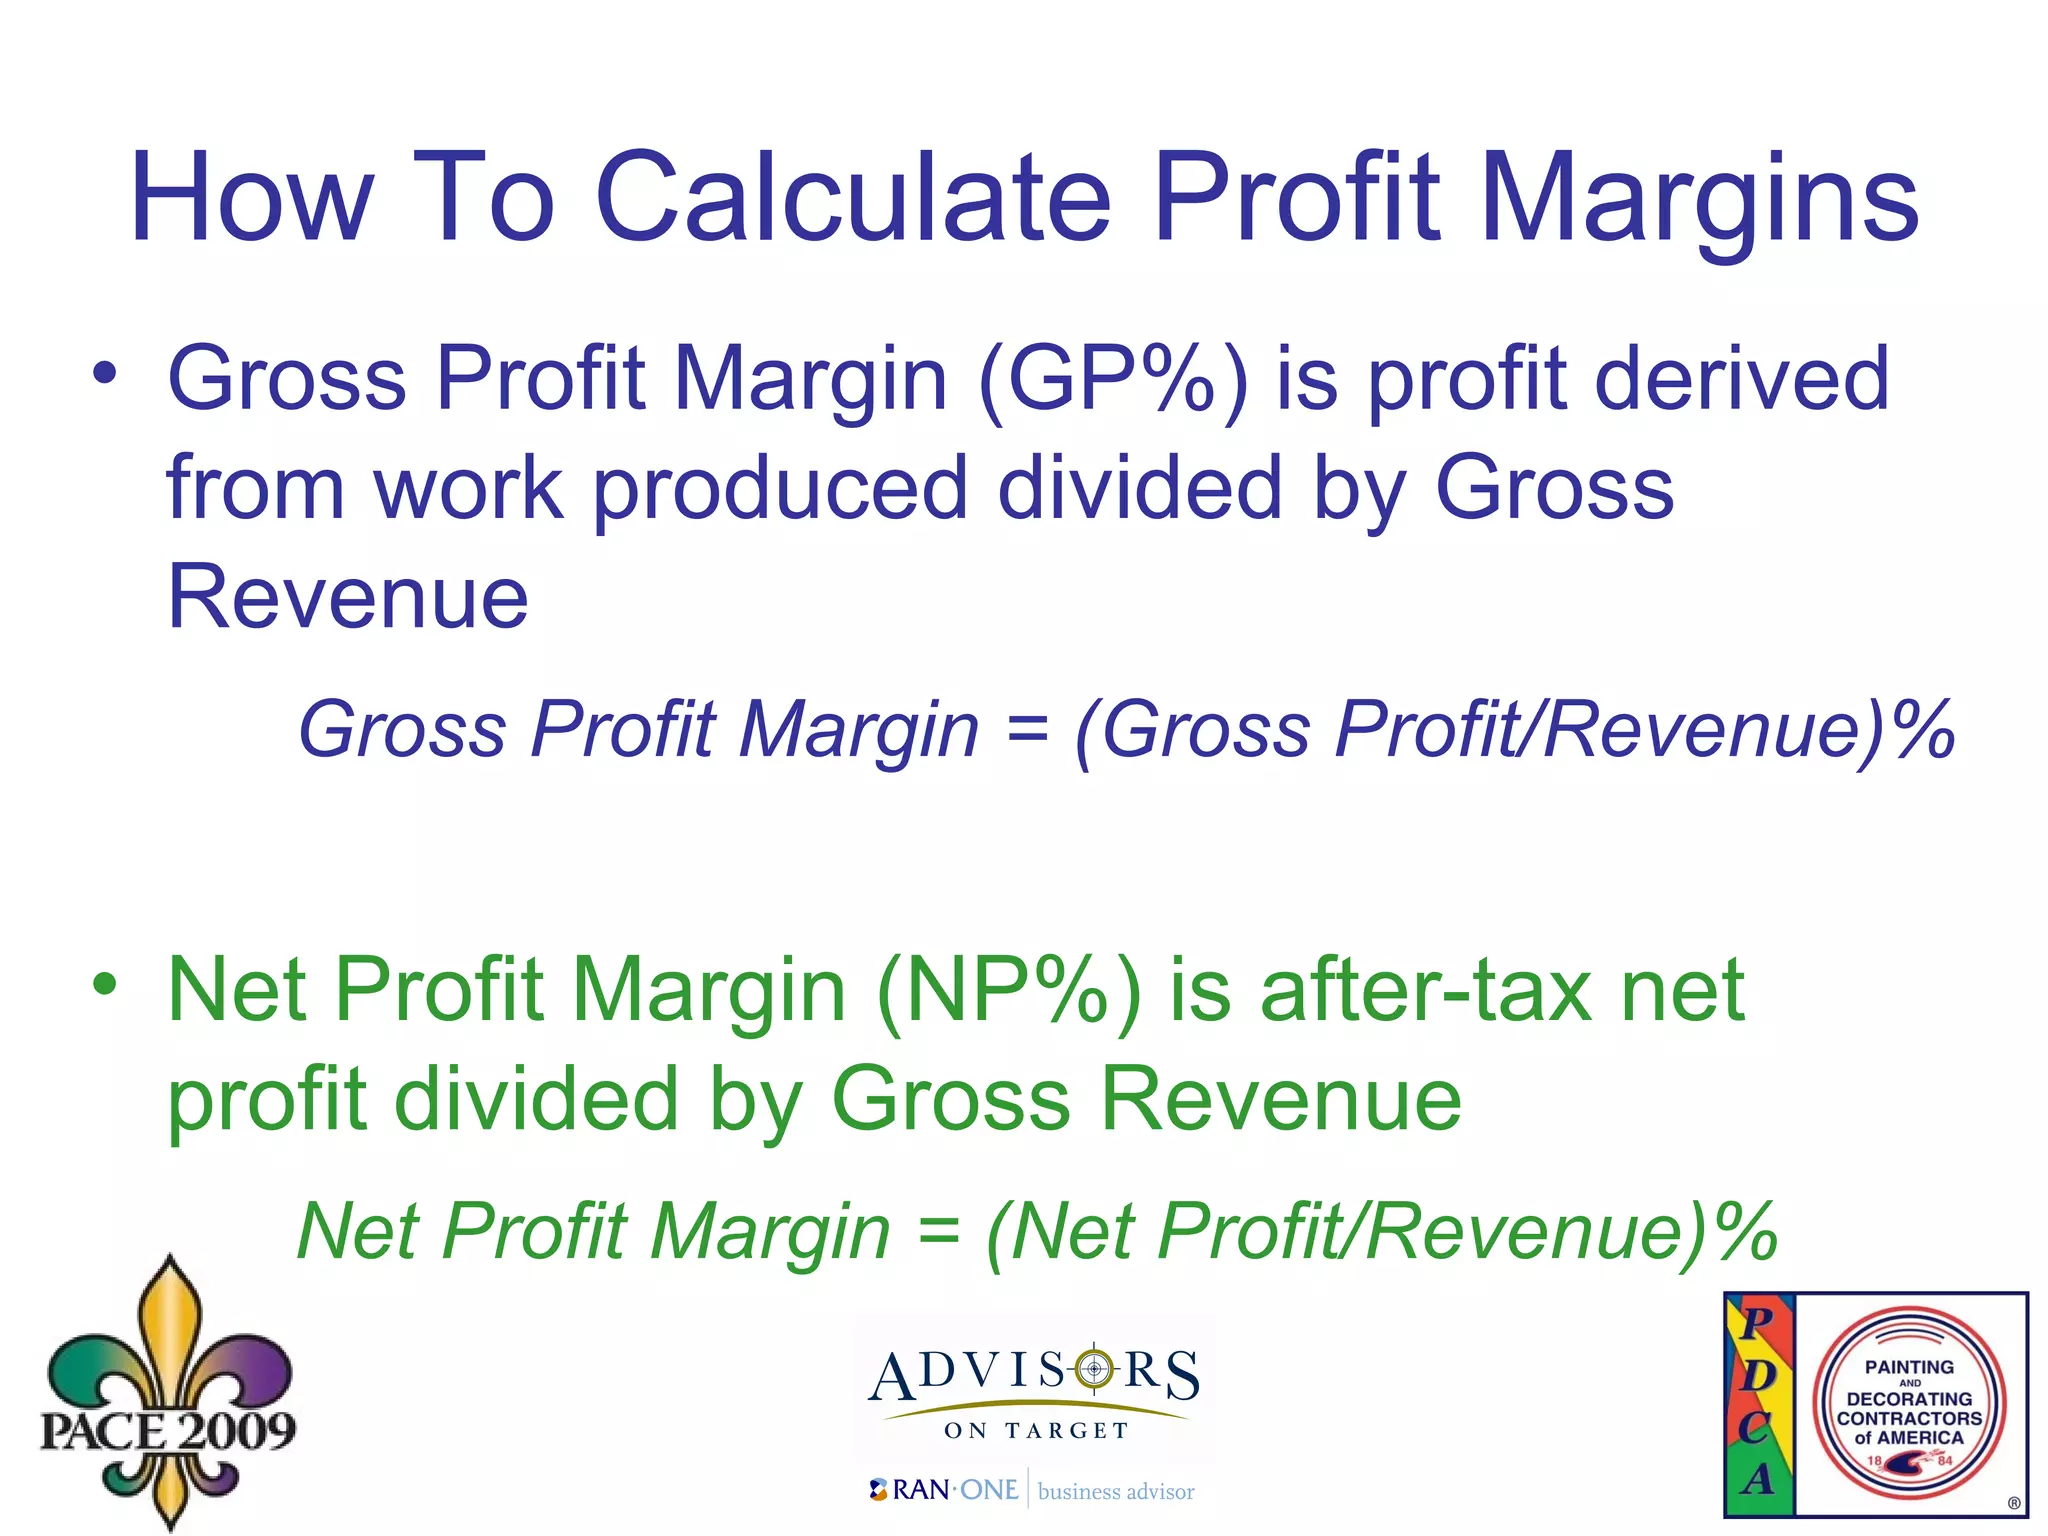
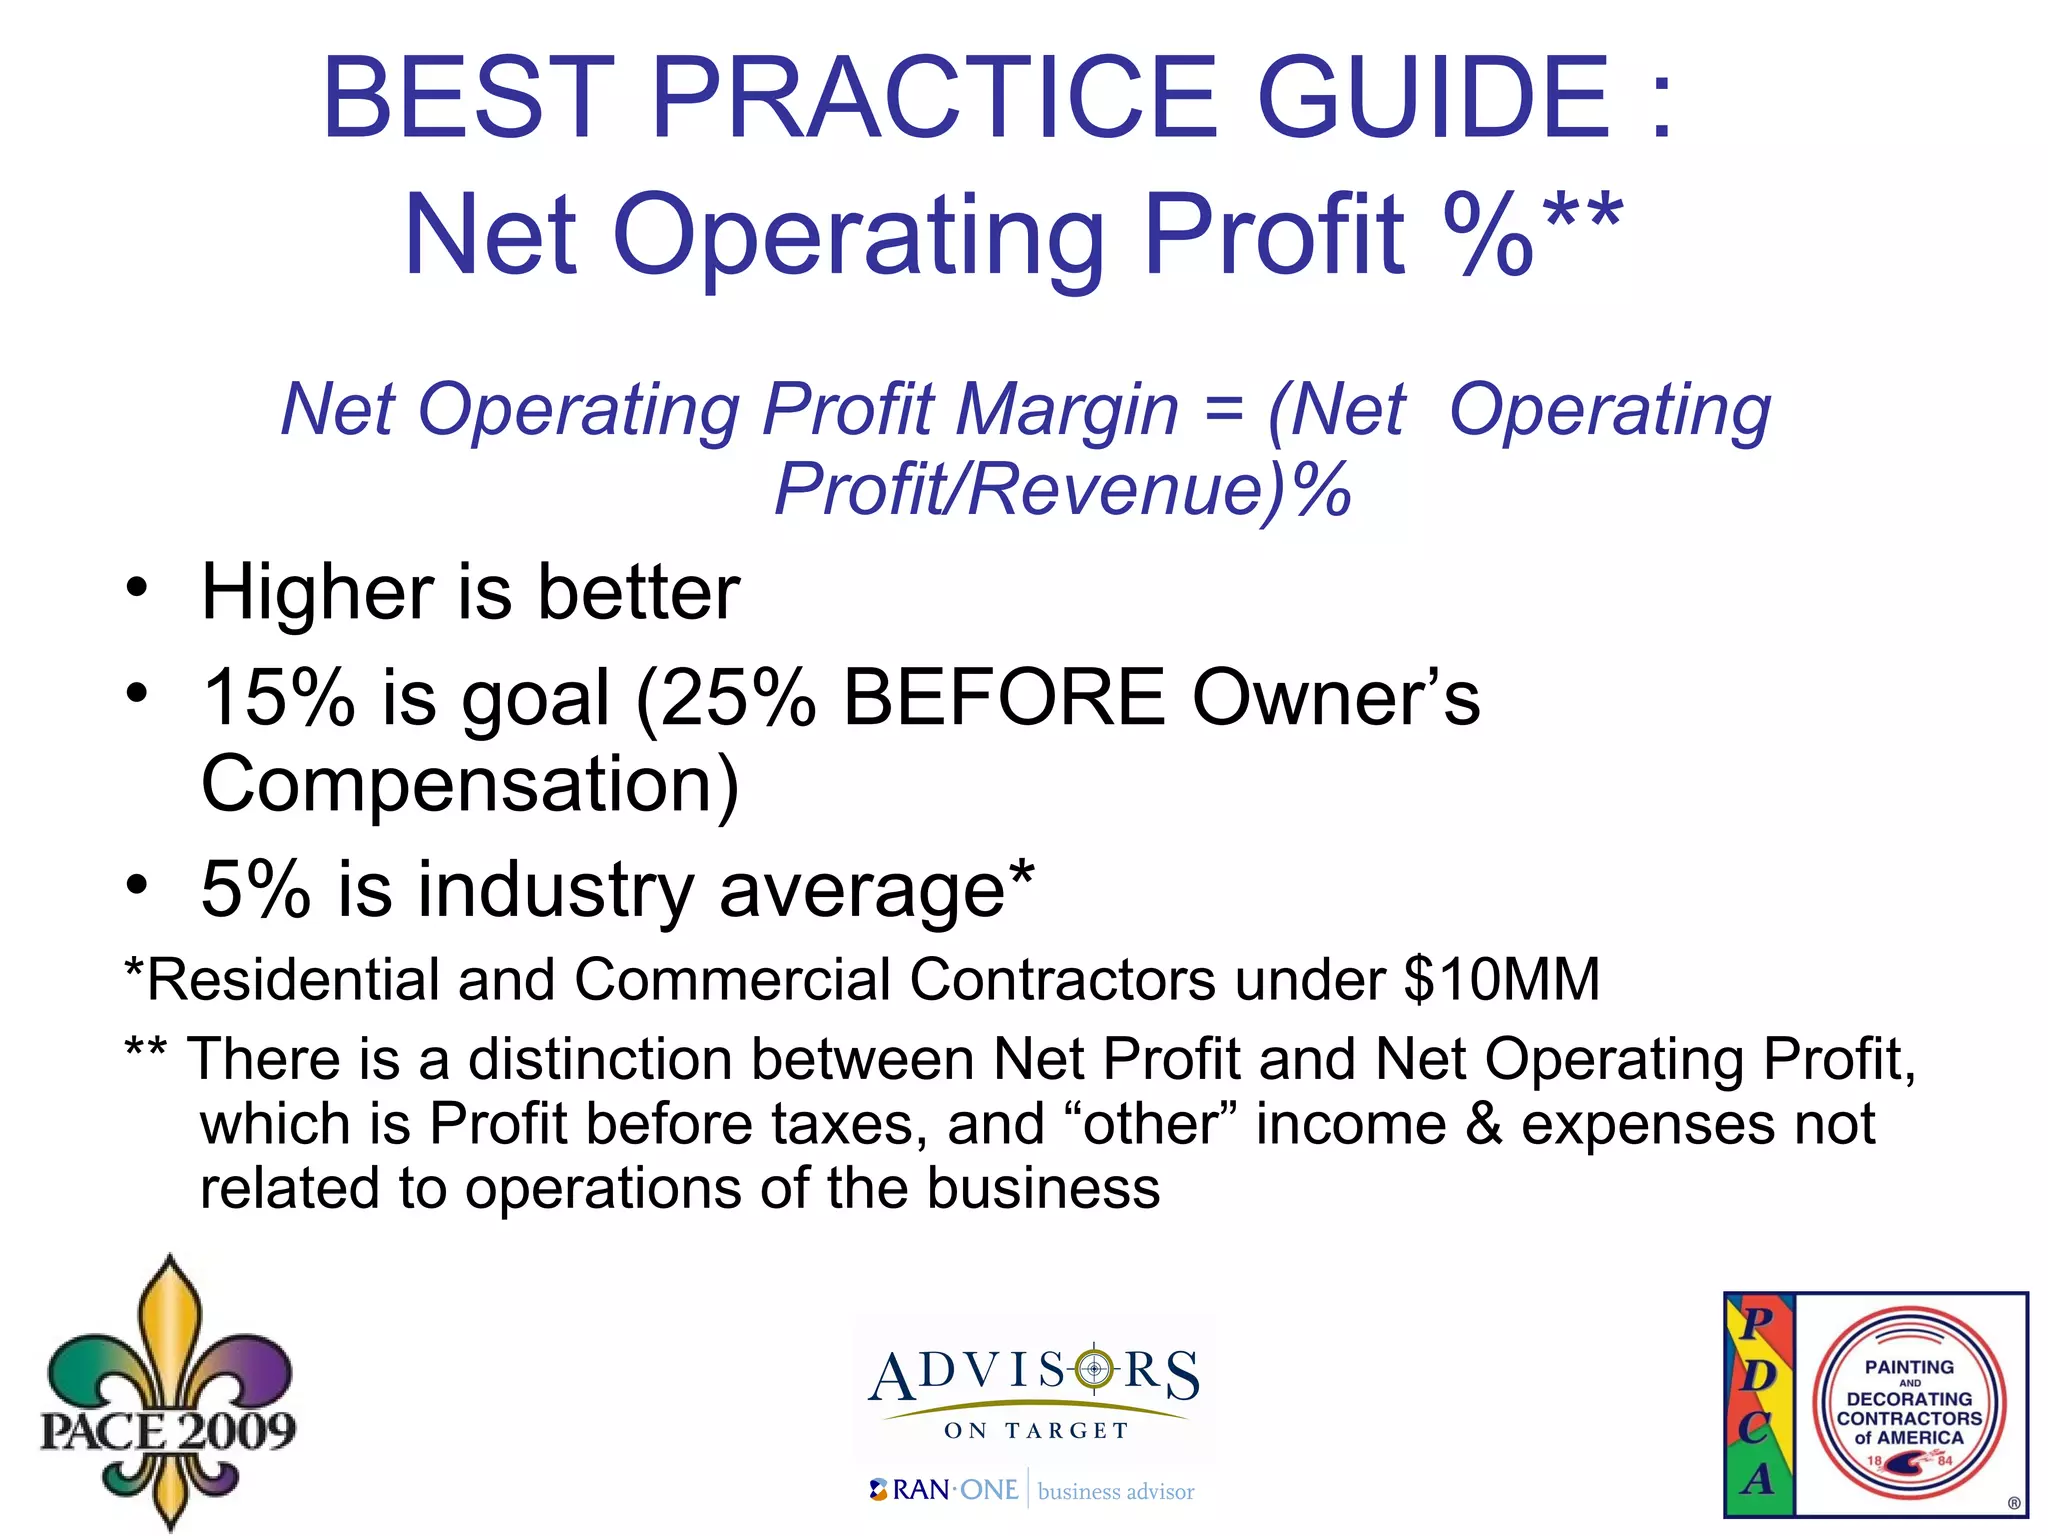
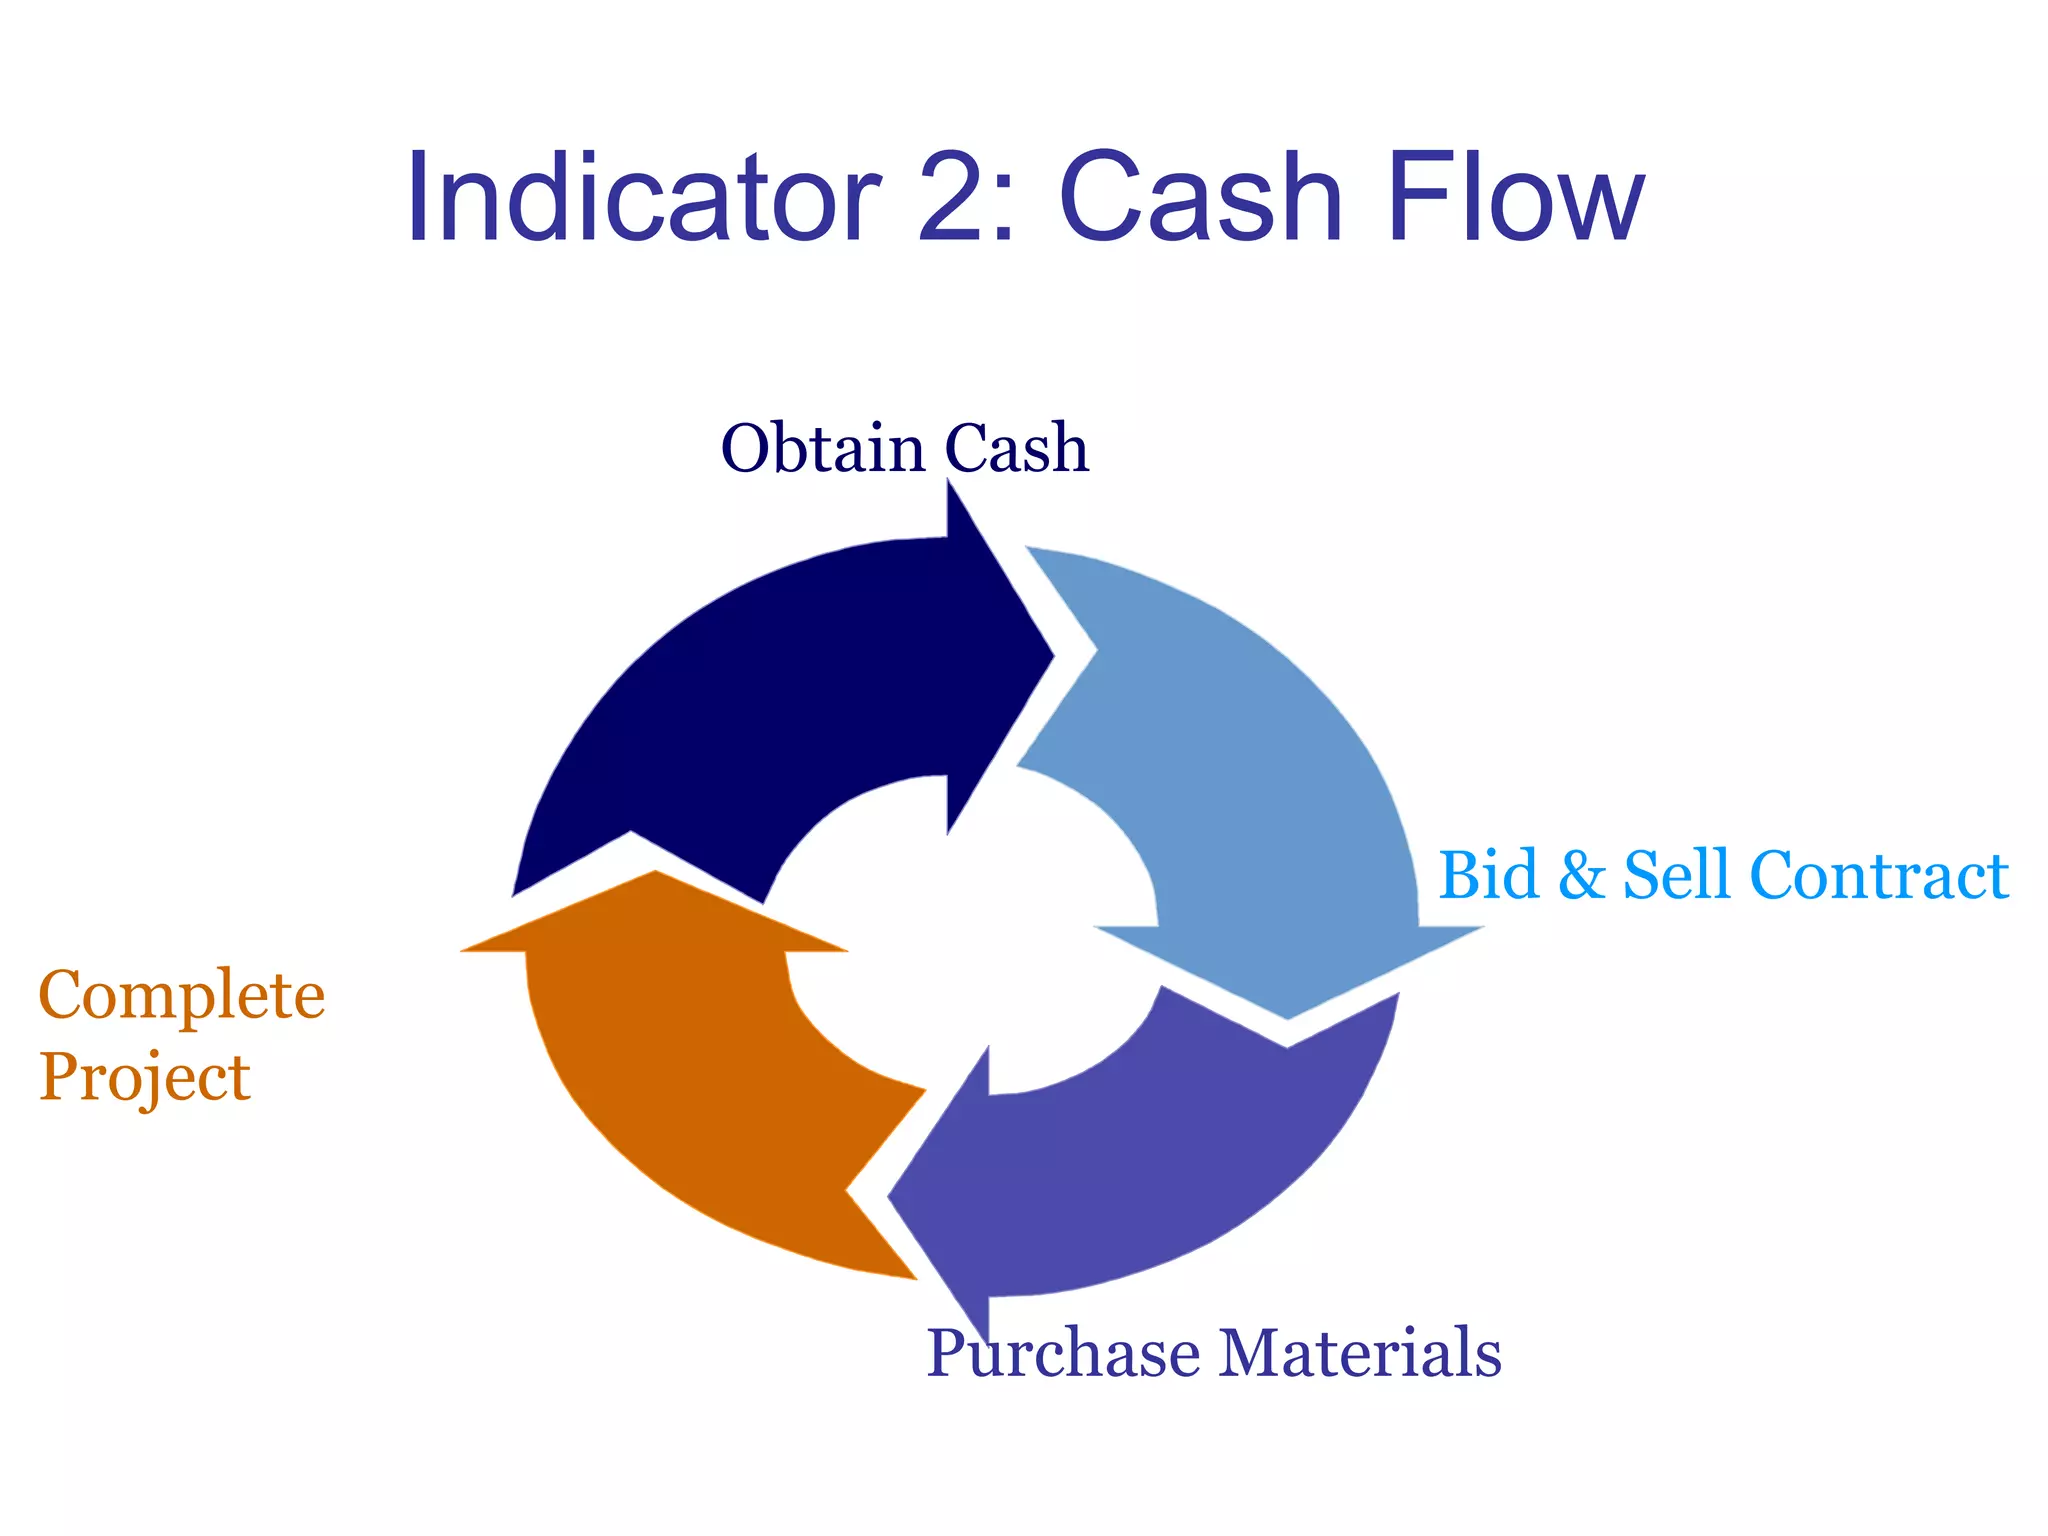
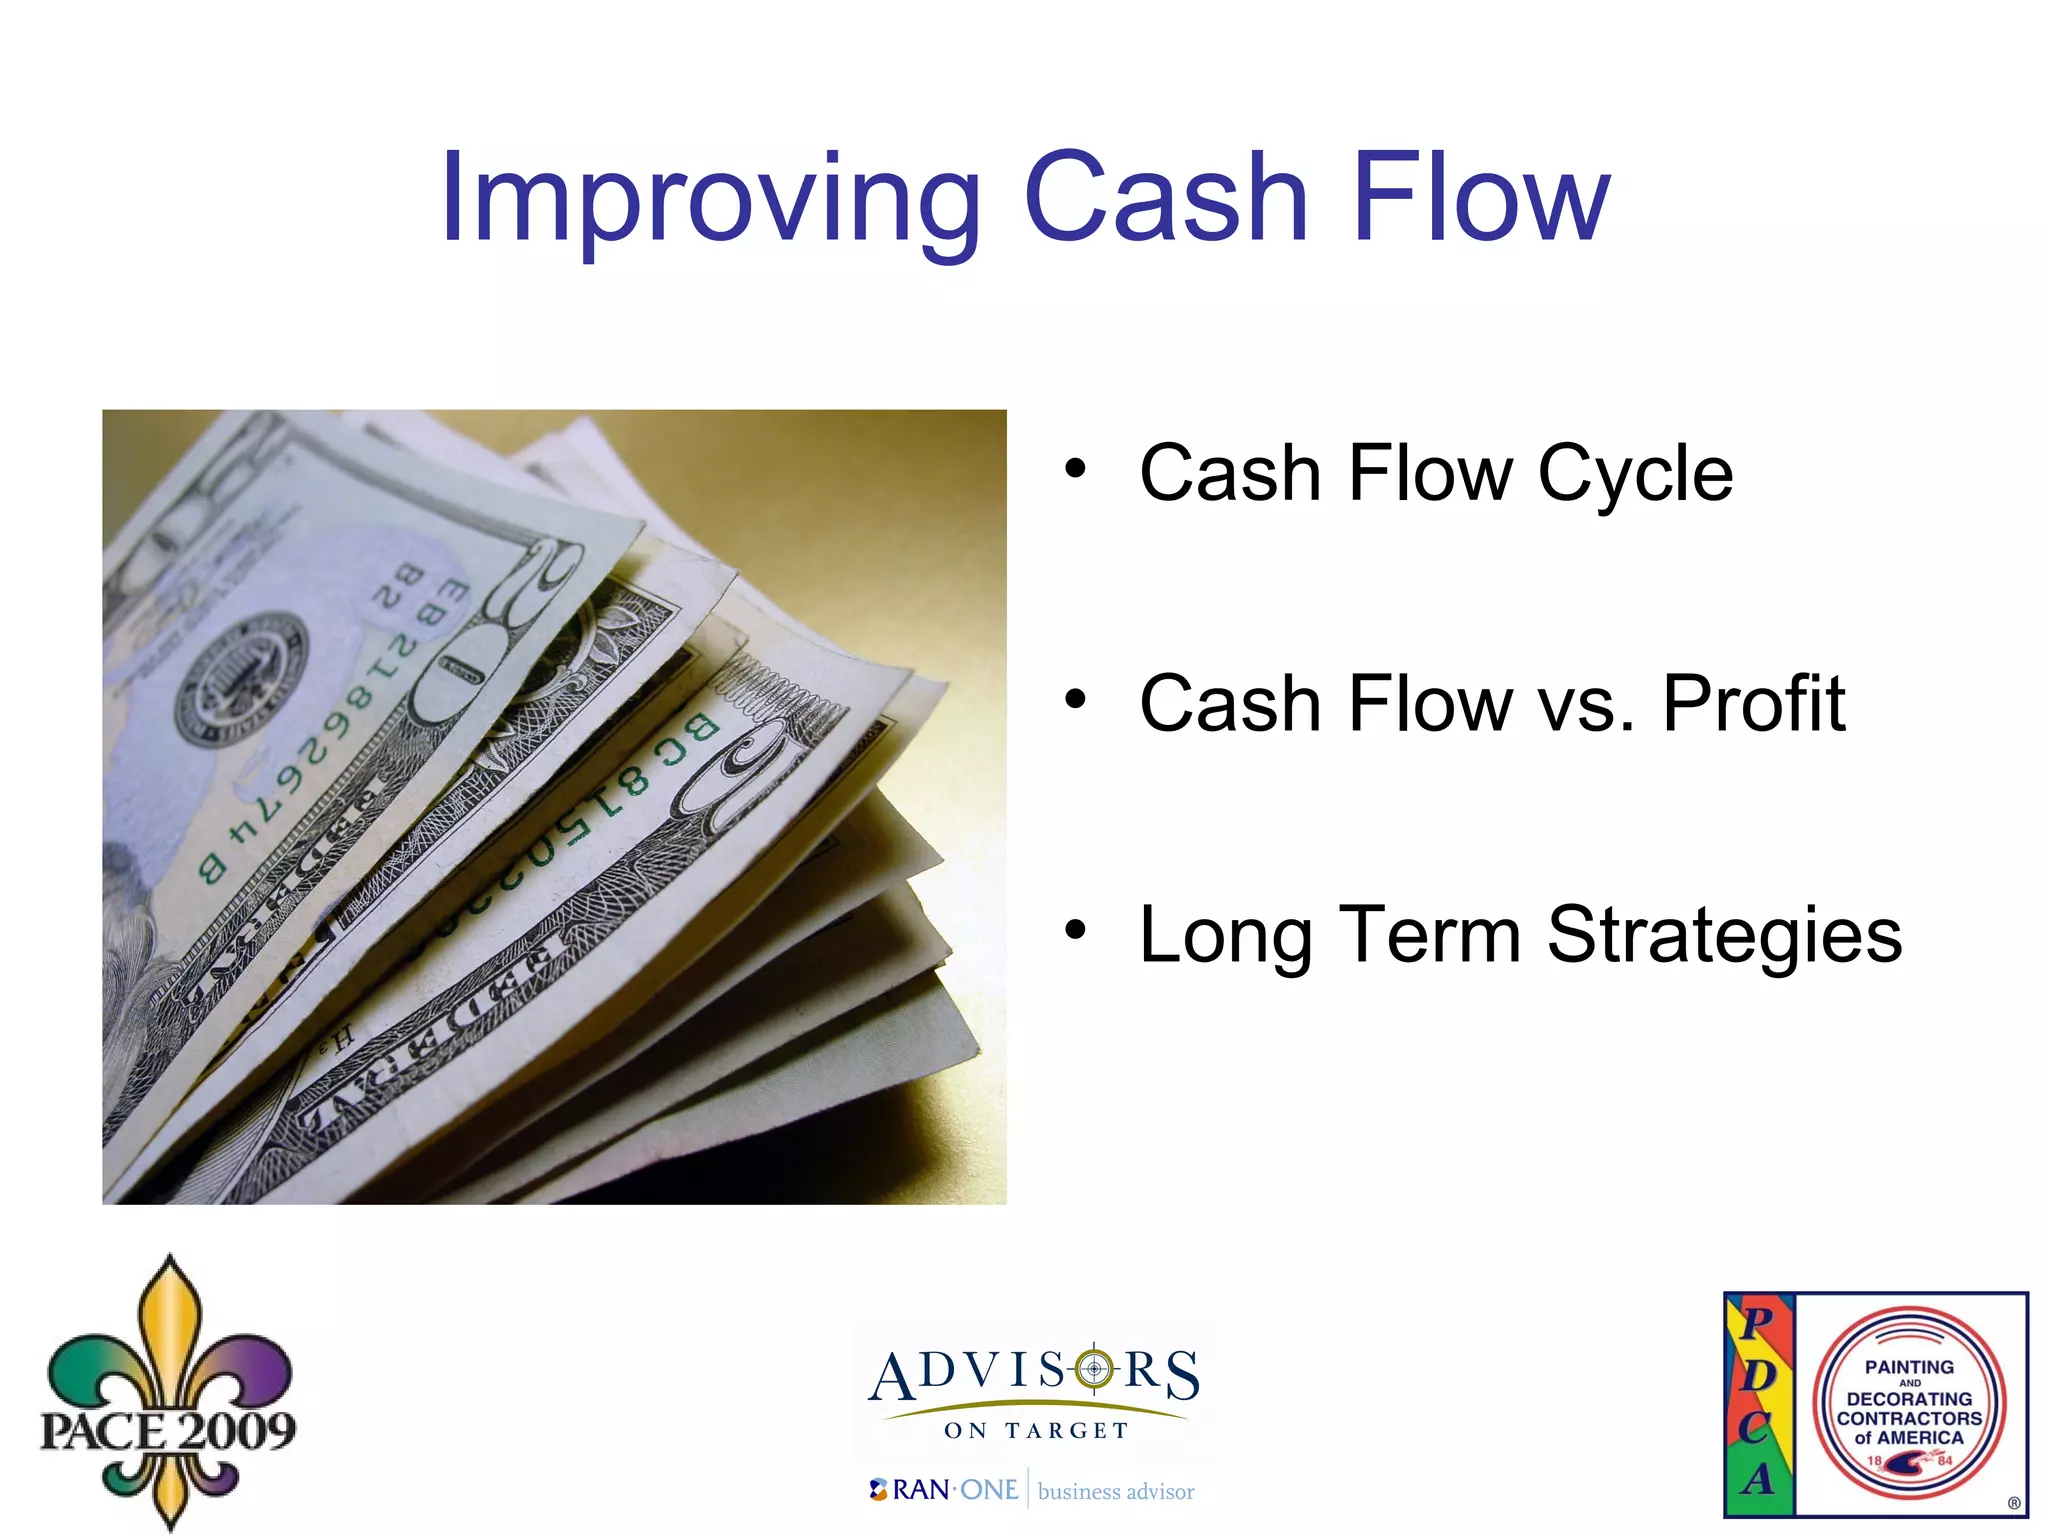
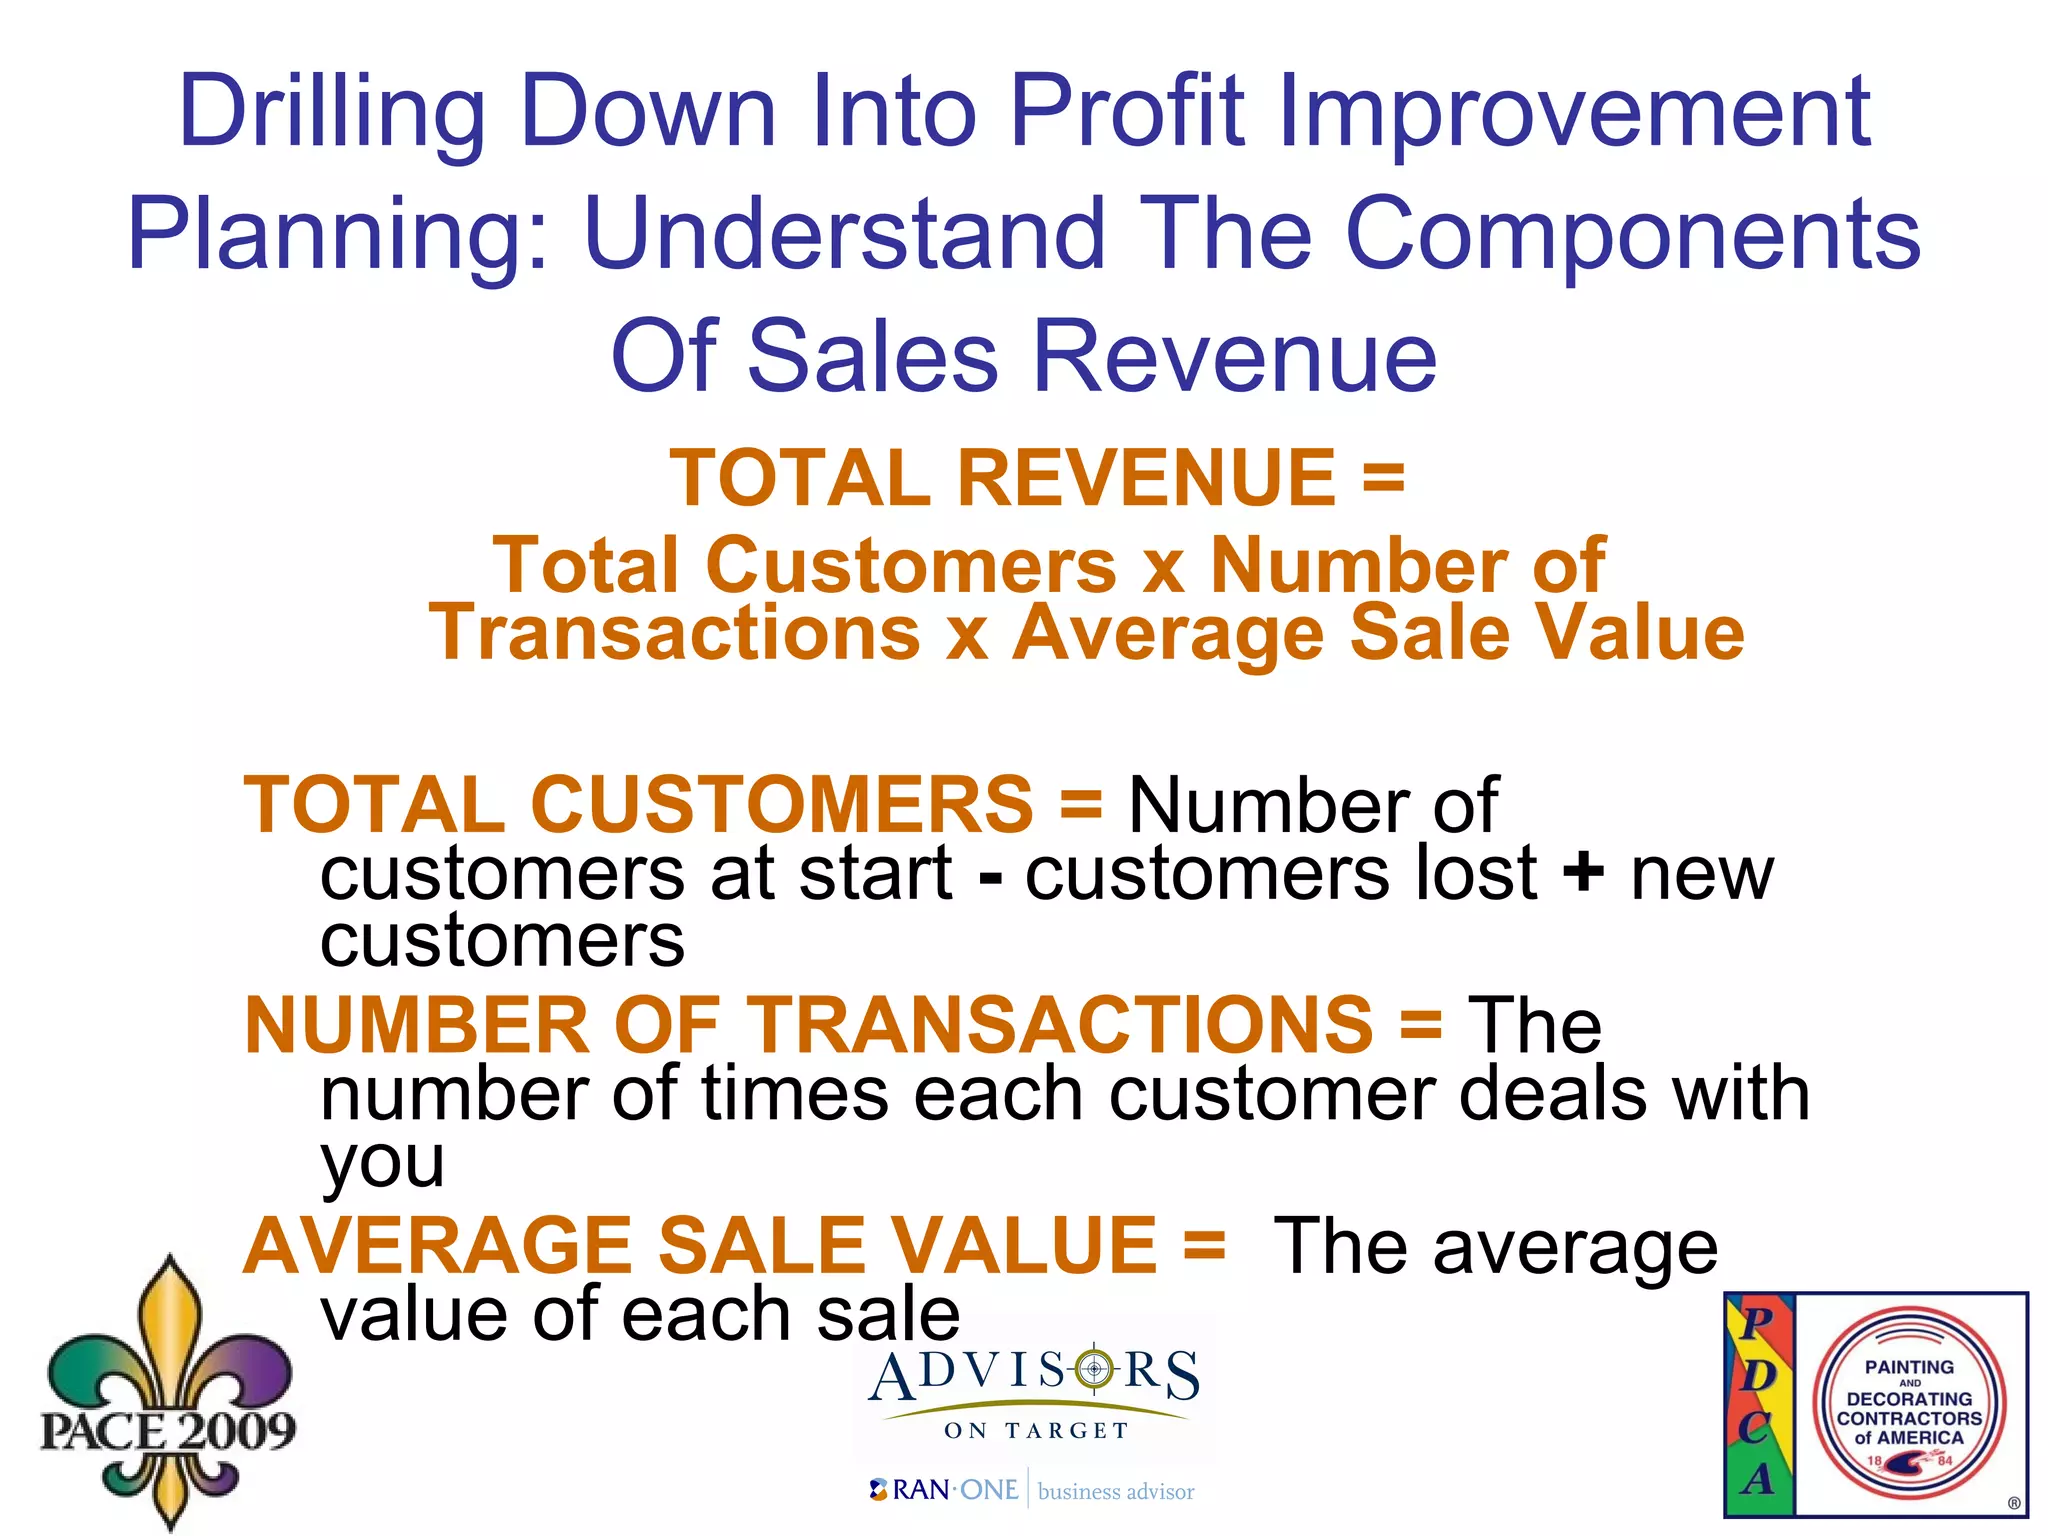
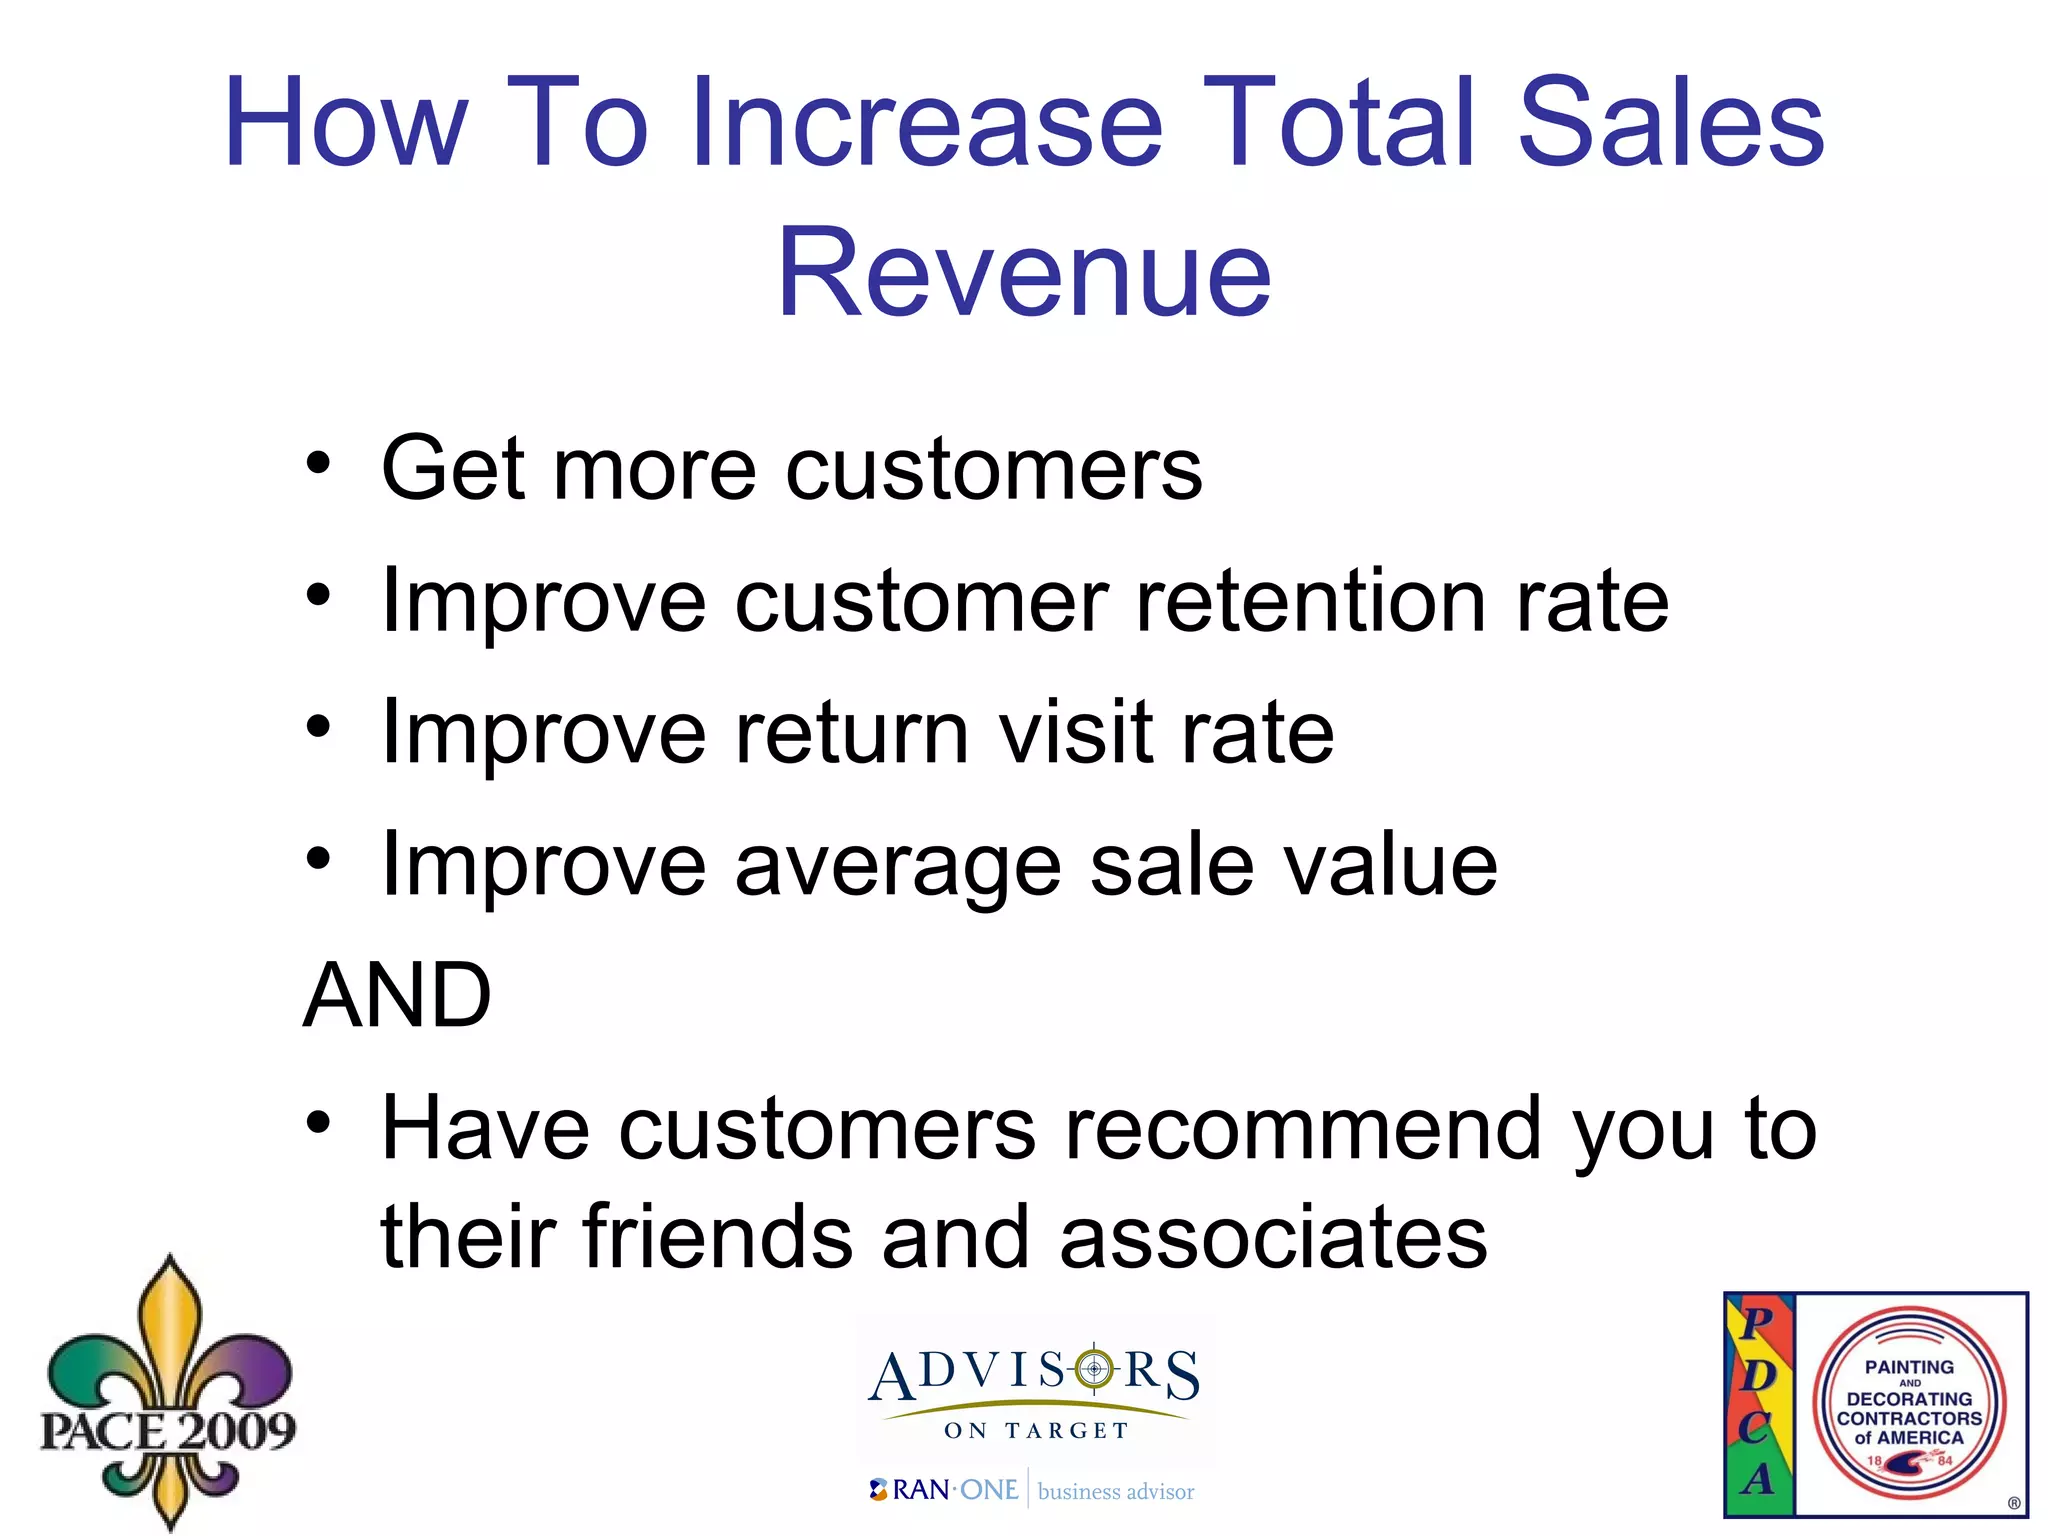
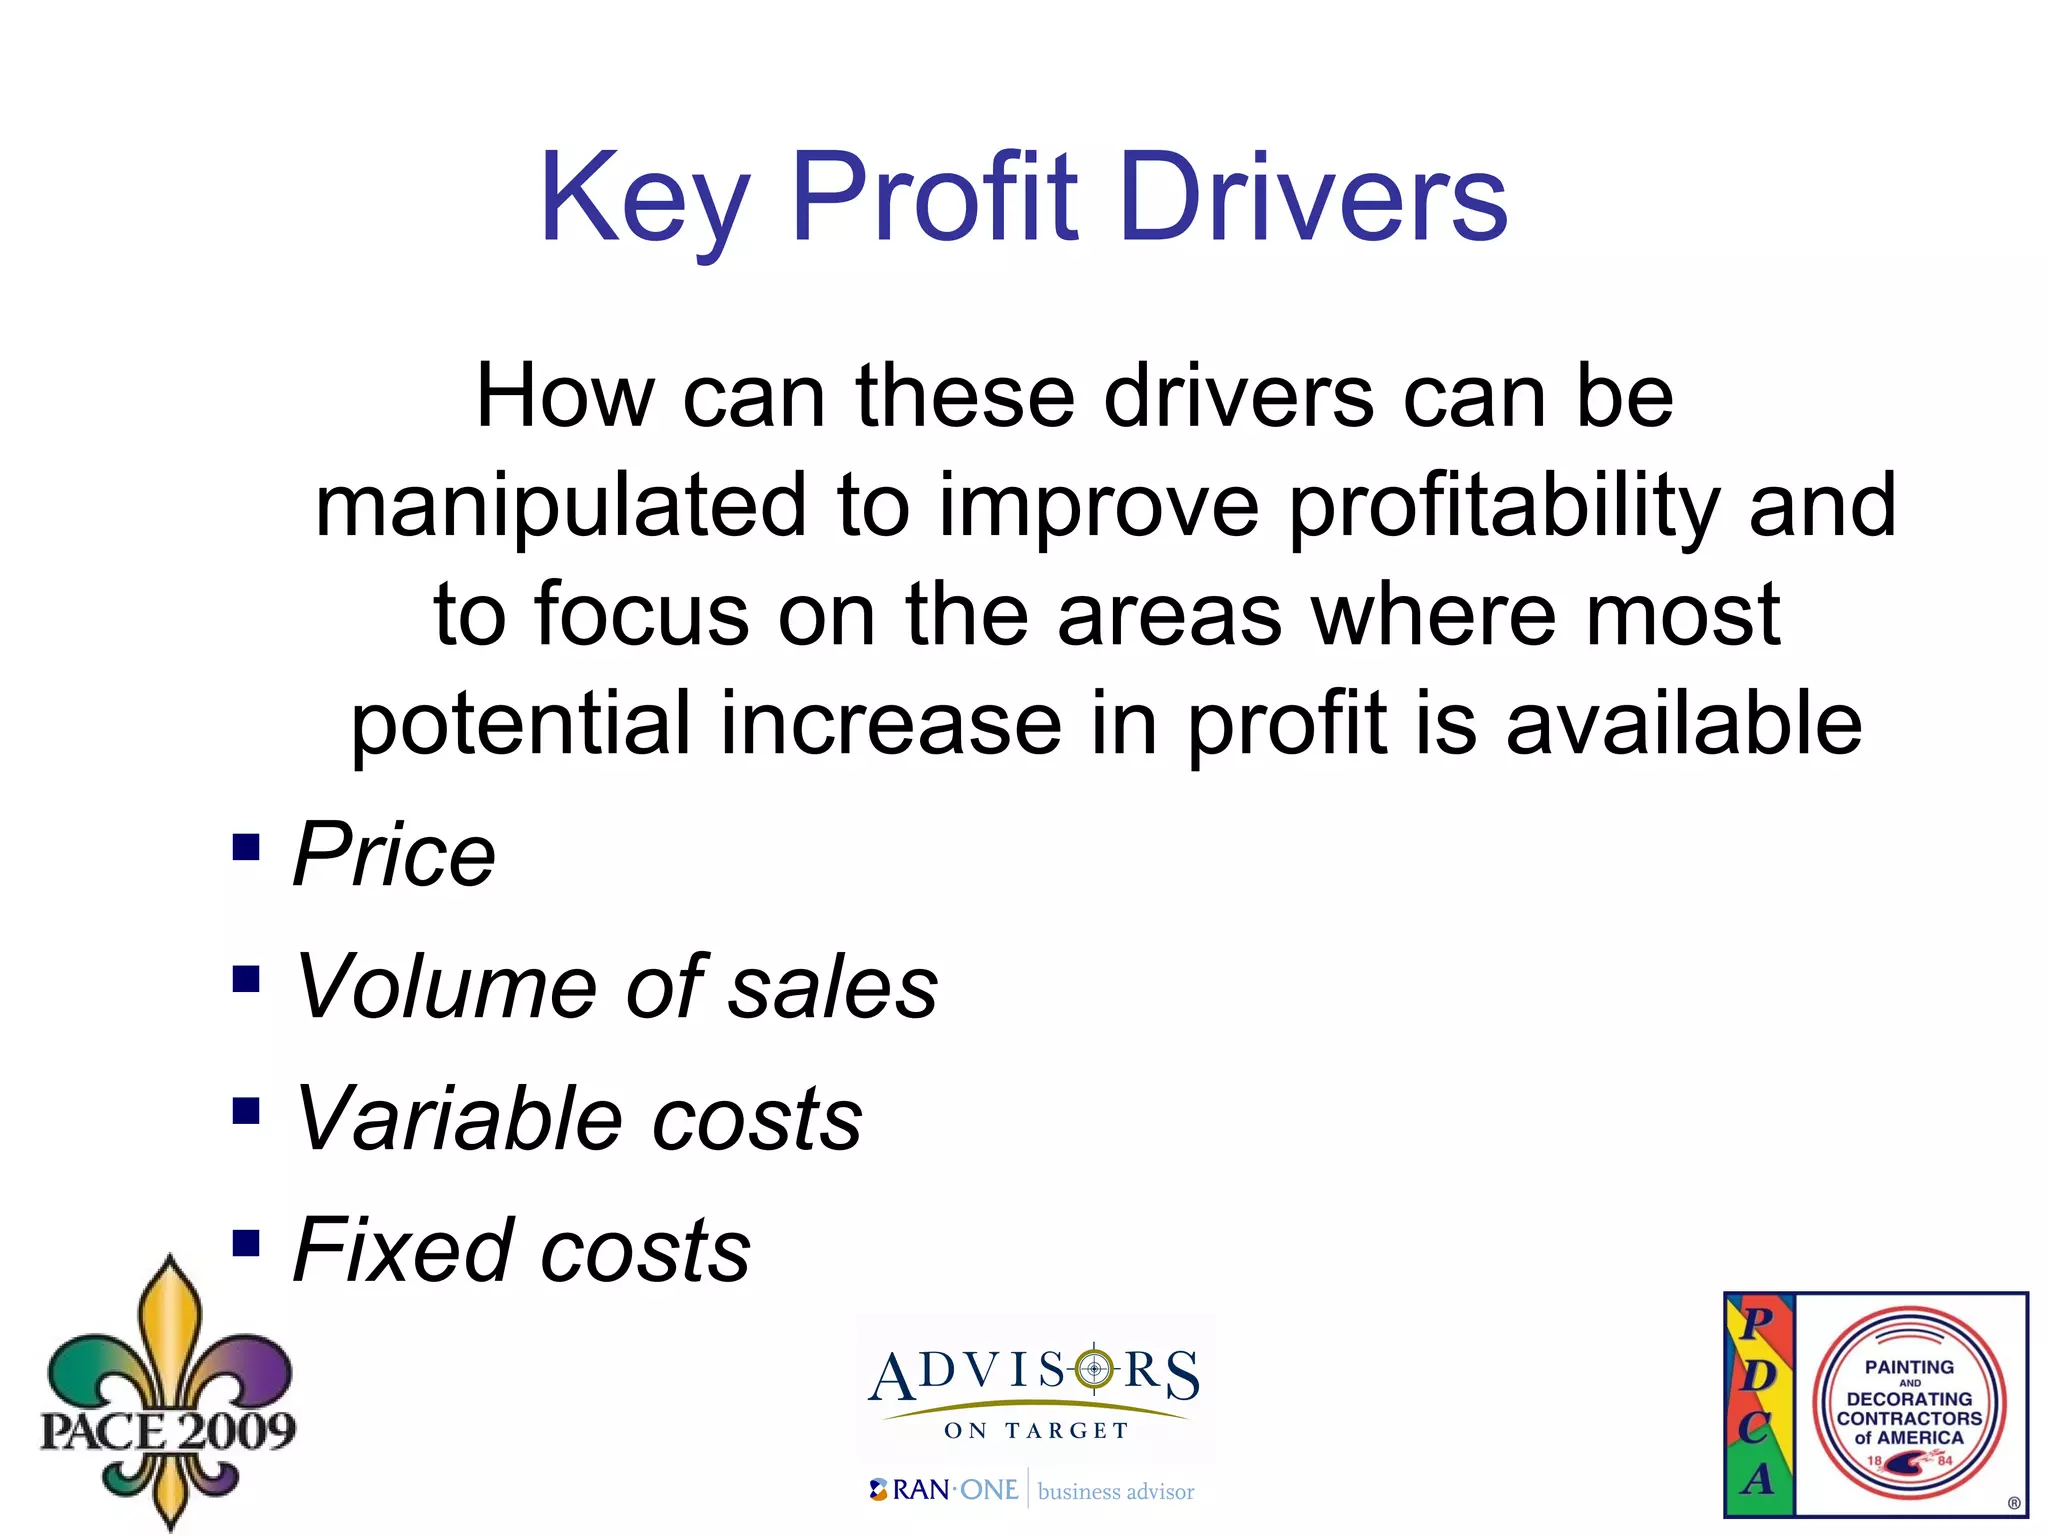
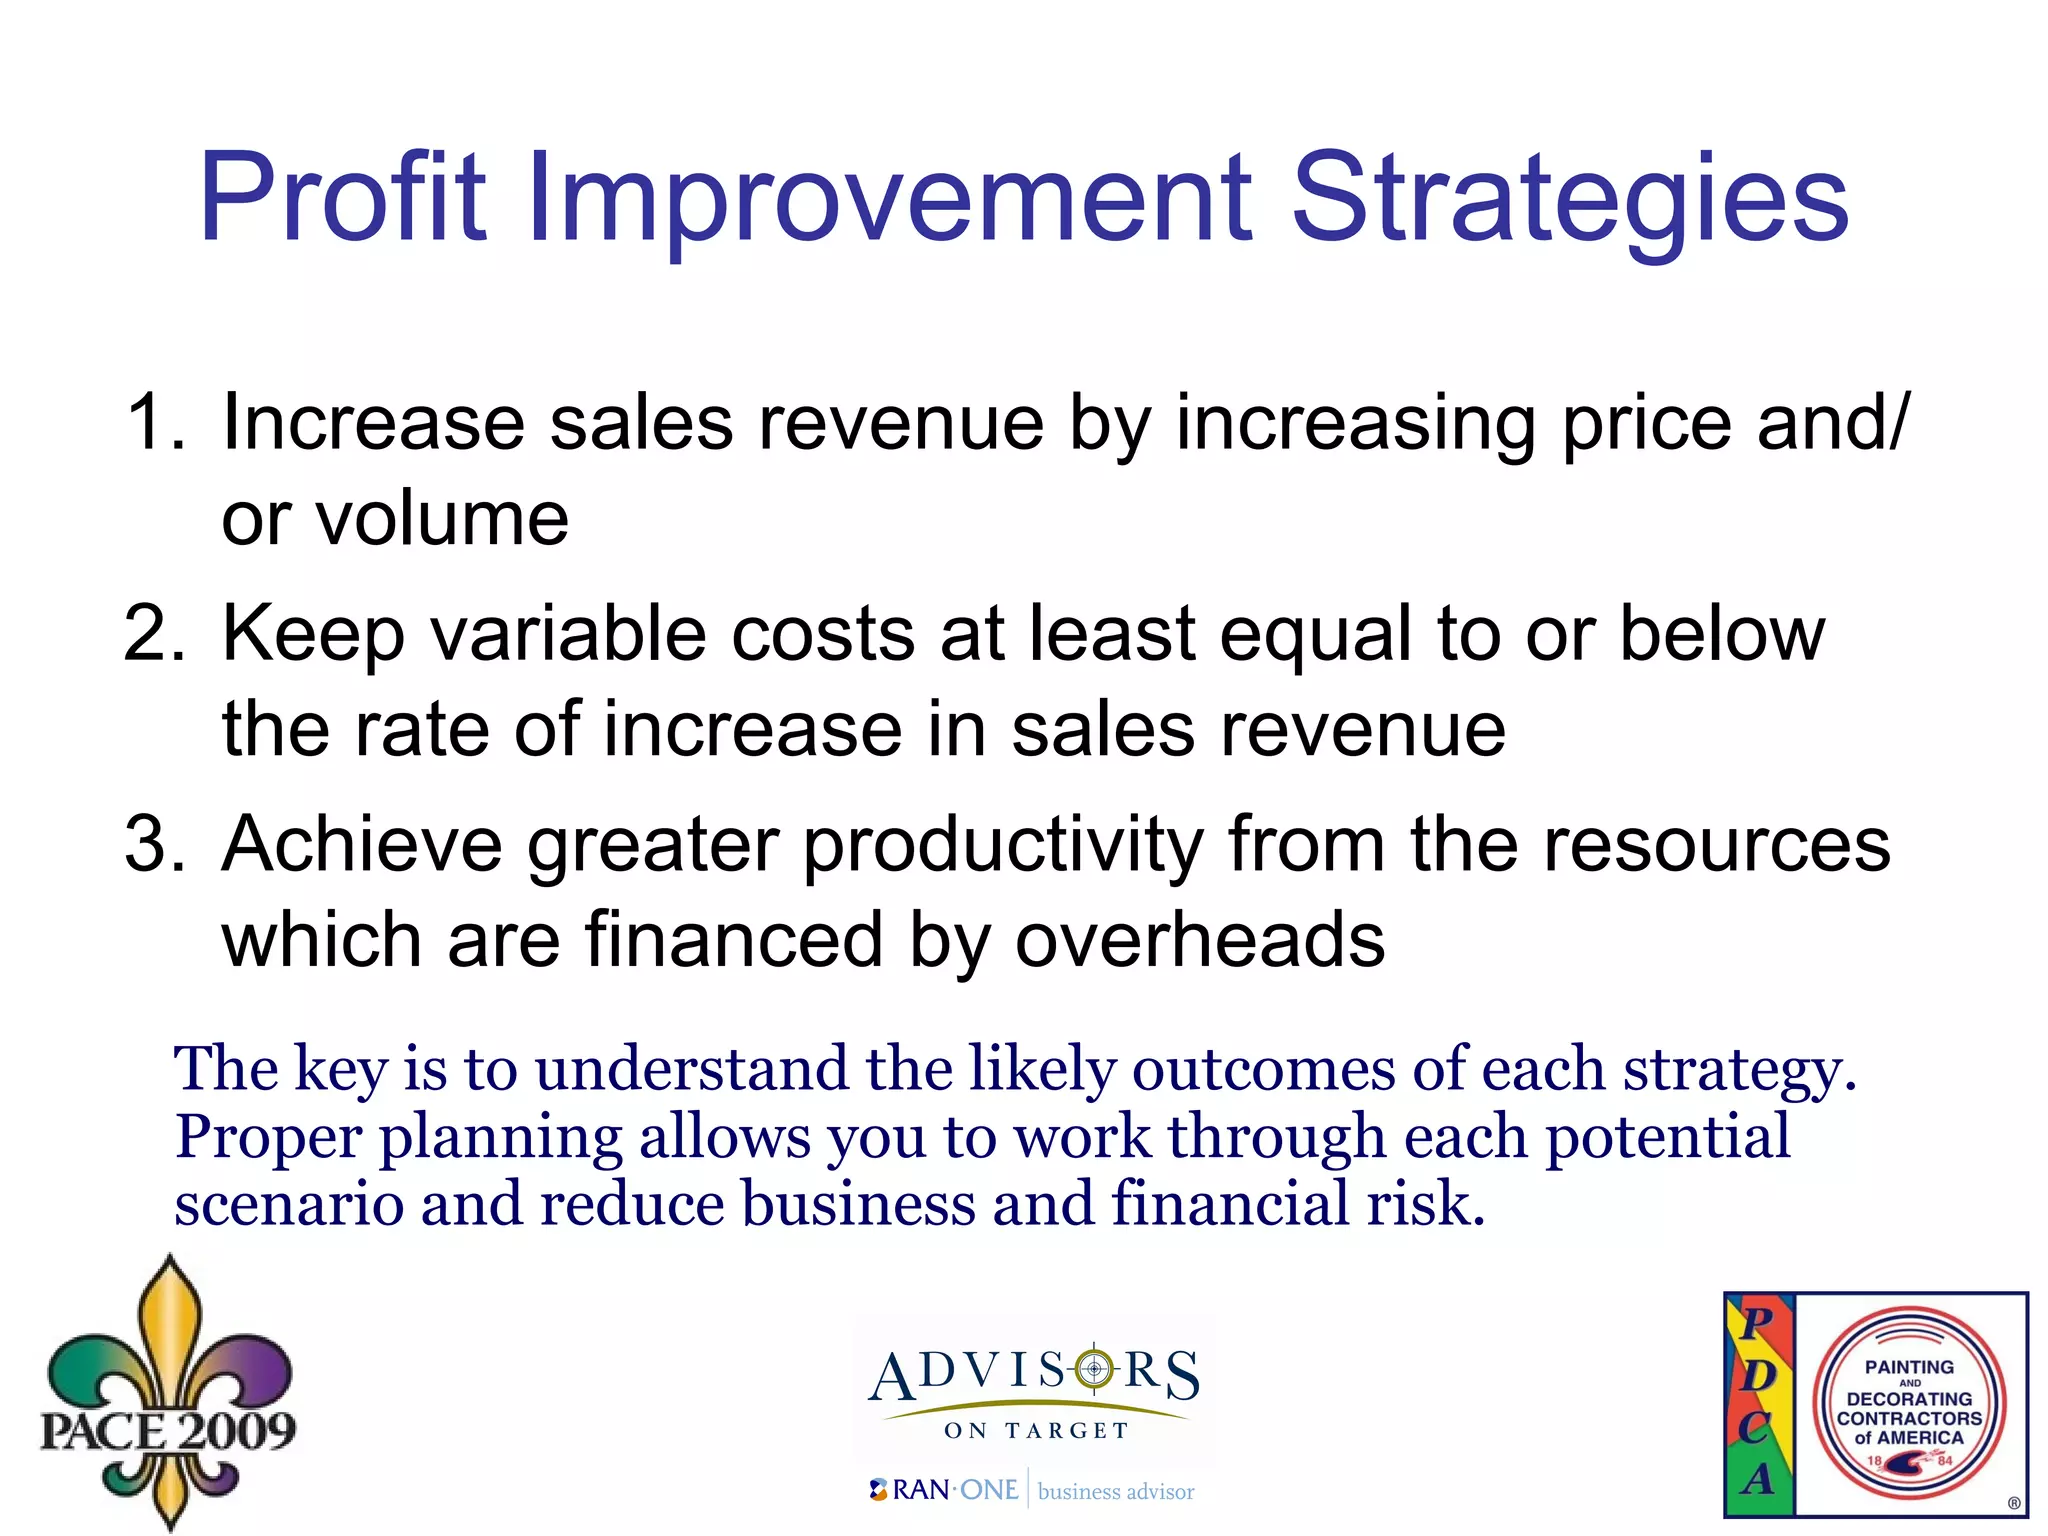
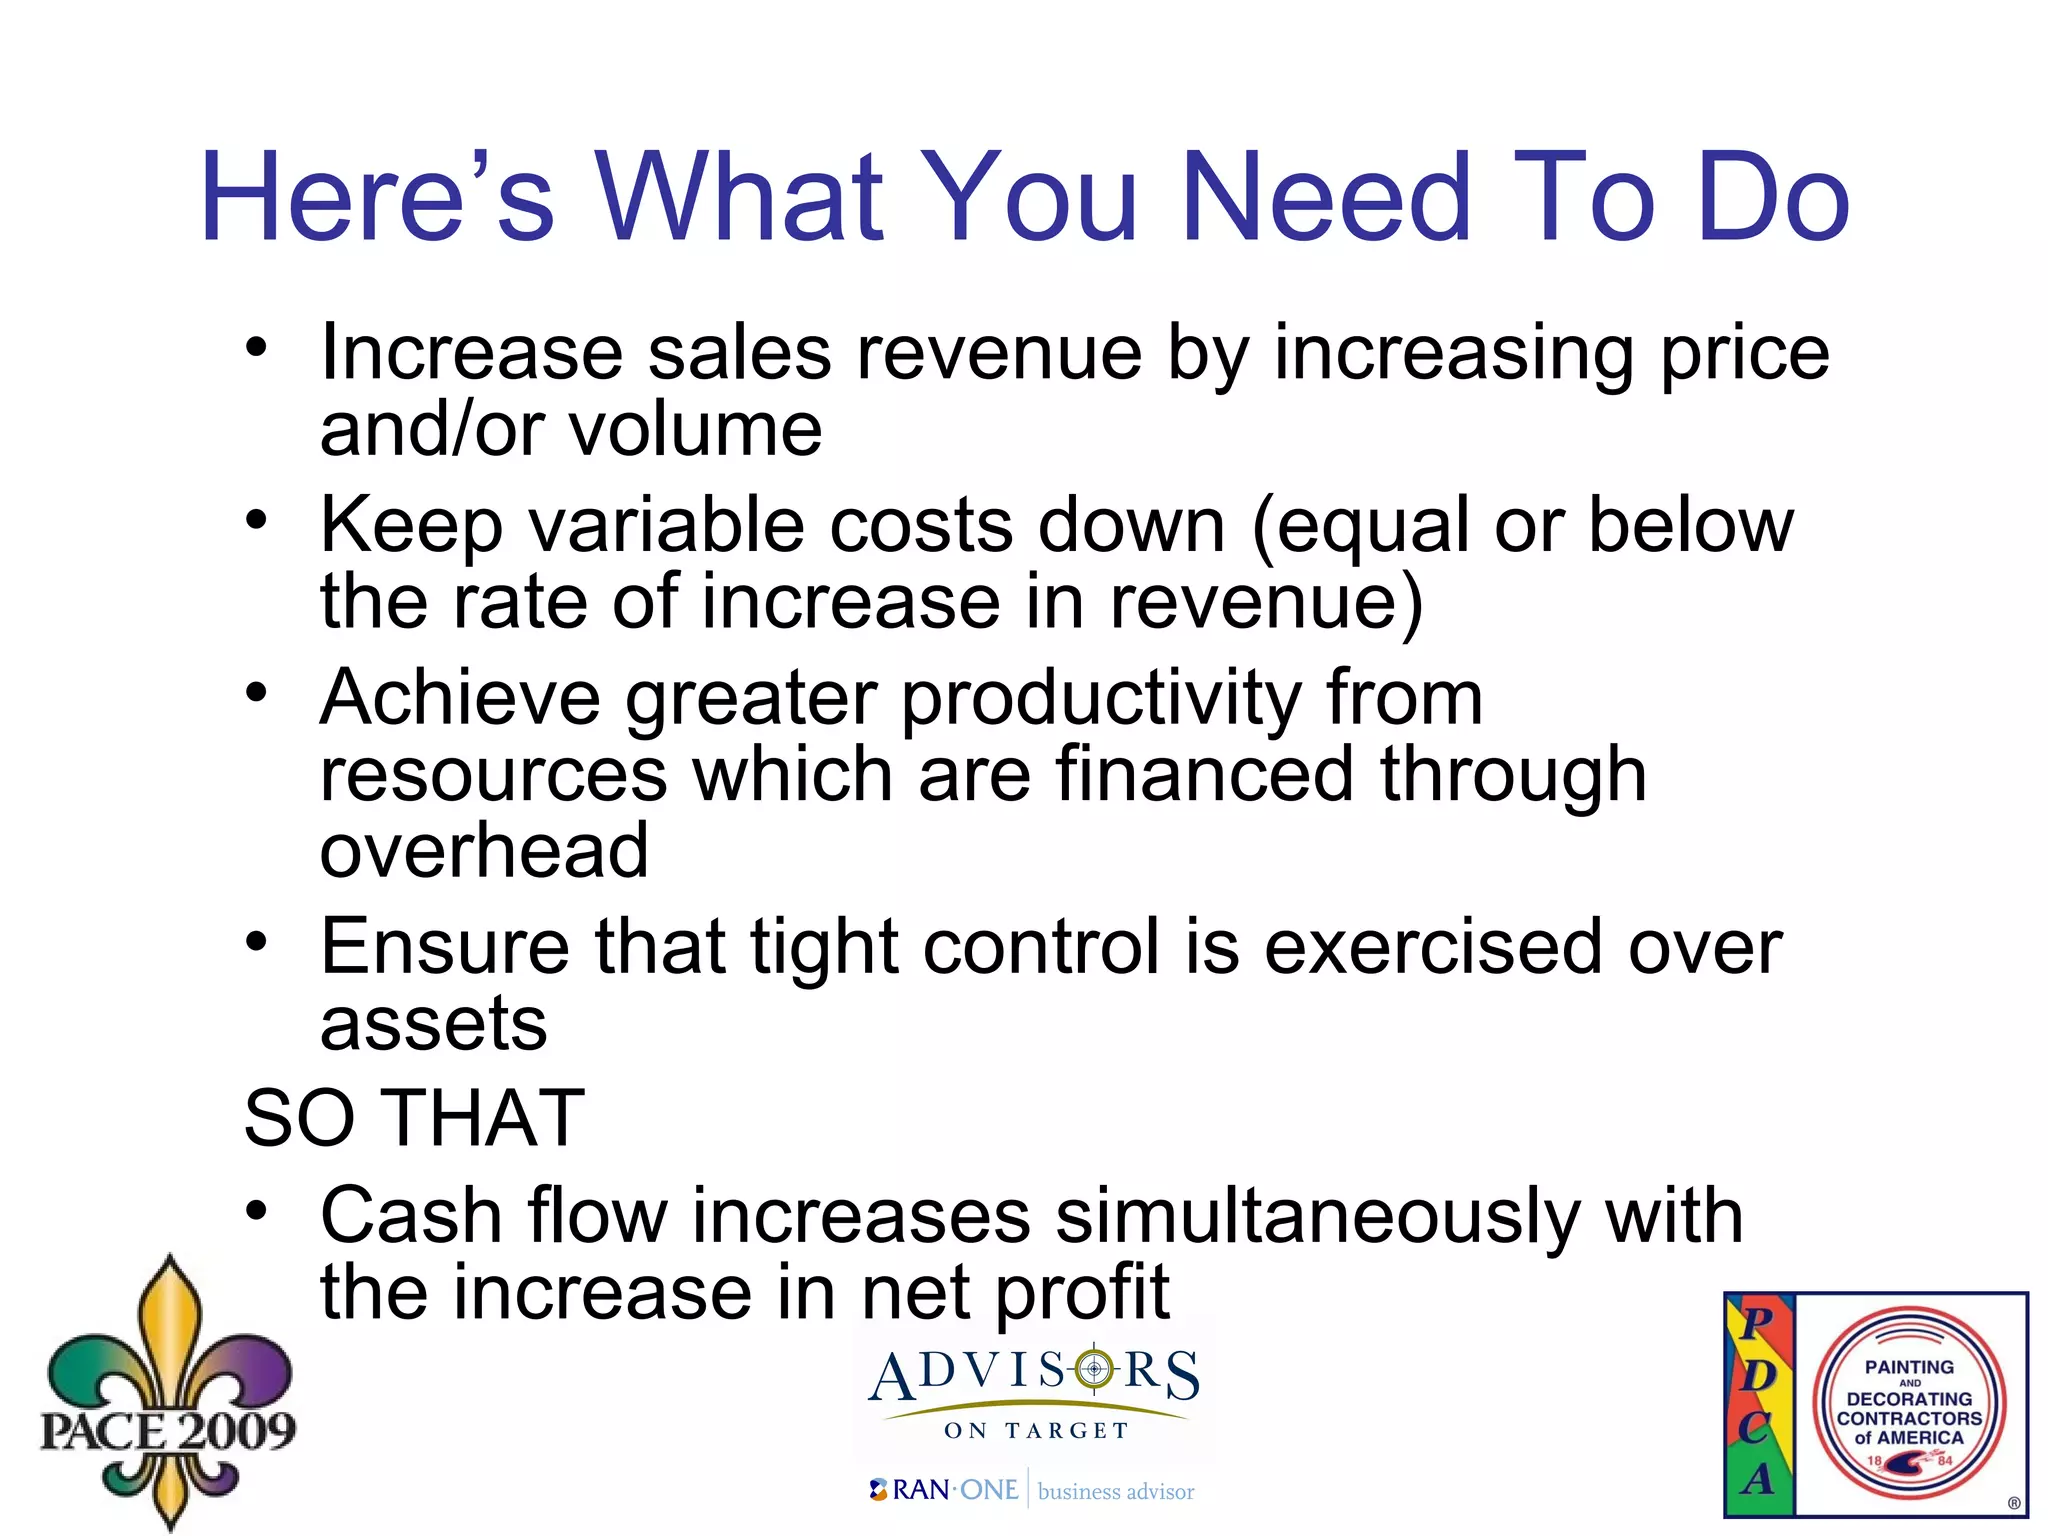
The document outlines effective financial management practices crucial for achieving a profitable and sustainable business, focusing on three key financial indicators: profit margins, cash flow, and return on investment (ROI). It provides strategies for improving profitability, emphasizes the importance of budgeting, and details best practices for monitoring key financial metrics. The guide is aimed at helping businesses make informed decisions to enhance operations and financial health.


