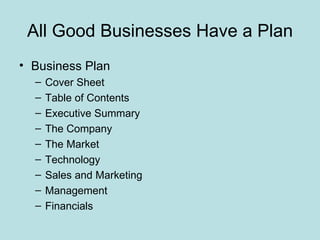
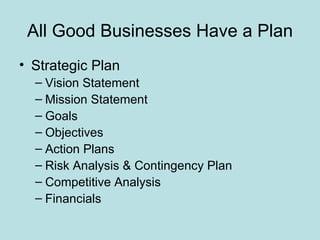
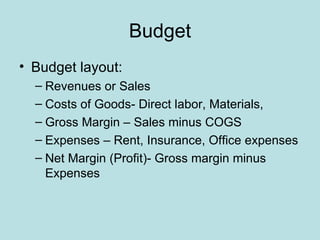
Presented by
Richard Wilbert
     and
Key Management Indicators that
   Can Help You Manage a
     Successful Business
Goals of the Webinar
• Discuss the Planning Process for your
  business
• Discuss the Financial Reports you should
  be using
• Drill down in the reports, what to look for in
  the reports
• How this keeps you on track
Business Planning
All Good Businesses Have a Plan
• Business Plan
  –   Cover Sheet
  –   Table of Contents
  –   Executive Summary
  –   The Company
  –   The Market
  –   Technology
  –   Sales and Marketing
  –   Management
  –   Financials
All Good Businesses Have a Plan
• Business Plan
• This is a statement about the business
  that follows a distinct format that will be
  used to evaluate the business for
  investors, stakeholders, banks and
  partners.
• The use of the business plan is to
  demonstrate to outsiders what your
  business is about.
All Good Businesses Have a Plan
• Strategic Plan
• A document that contains the company’s
  mission and vision statements, goals and
  objectives over a period of time and how
  specific individuals within the company will
  achieve these goals and objectives. The
  Strategic Plan is used to determine the
  use of limited resources (time, money,
  people and technology)
All Good Businesses Have a Plan
• Strategic Plan
  – Vision Statement
  – Mission Statement
  – Goals
  – Objectives
  – Action Plans
  – Risk Analysis & Contingency Plan
  – Competitive Analysis
  – Financials
Key Management Indicators
• Key Management Indicators to help manage
  your business
  – Financial reports
       Chart of Accounts
       Budgets
       Profit and Loss Statement
       Balance Sheet
       Cash flow report
       Days of sales outstanding
       Job Costing reports
       Accounts Receivable and Payables
Key Management Indicators
• Chart of Accounts
  – A chart of accounts is a created list of the
    accounts used by a business to define each
    class of items for which money is spent or
    received.
Key Management Indicators
• Chart of Accounts
  – Used to organize the finances and to
    segregate Expenditures, Revenue, Assets,
    and Liabilities
  – List is Alpha-numeric
  – Arranged in order of Financial Statement
  – 5 digits representing Division, Department and
    type of Account
Profit and Loss Statement
• A Profit and Loss Statement is sometimes
  called the Income Statement or the P&L
• This is your Chart of Accounts with actual
  numbers added to the document.
Profit and Loss Statement
• The P&L serves as the report card of your
  company’s performance each month.
• Many software packages will compare the
  P&L to previous years/months, year to
  date and offer percentages for easy
  comparison of numbers.
Profit and Loss Statement
• The P&L can lead to a number of other
  financial ratios such as: Return on
  Investment (ROI), Return on Assets
  (ROA) and many others that we will not
  discuss at this time, but be aware that
  these calculations are important to
  investors and bankers.
Budget
• The Budget is your financial road map and
  is used to determine whether you are on
  track or not.
  – Annual budgets are spread over 12 months of
    the fiscal year
  – Based on the projected revenues of each
    month and business activities of each month
  – Example: May is most likely busier than
    December, your budget should reflect that
    activity
Budget

• Start by creating a Chart of Accounts:
  – Most software packages will assist with the
    Chart of Accounts, but make it unique to your
    company.
  – PLANET has a sample Chart of Accounts in
    it’s publications available for you to purchase.
Budget
• Budget layout:
  – Revenues or Sales
  – Costs of Goods- Direct labor, Materials,
  – Gross Margin – Sales minus COGS
  – Expenses – Rent, Insurance, Office expenses
  – Net Margin (Profit)- Gross margin minus
    Expenses
Budgets

• Create a list of costs that you include in
  each account item for future reference
• Once annualized, create a monthly
  spreadsheet based on fiscal year- 12
  budgets by month
• This becomes the outline for your Profit
  and Loss Statement or Income Statement
Balance Sheet
• A Balance Sheet offers a snap shot of
  your business on a given date and time
• The Balance Sheet reflects 3 categories
  Assets, Liabilities and Ownership Equity in
  the business.
• The Balance Sheet is not a tool that you
  will use to manage your business, but
  bankers and investors will be interest in
  this document.
Cash Flow Report
• Cash flow is a summary of when cash will
  be received in the business.
• Cash flow is used to determine when
  suppliers and other bills can be paid by
  the business.
• Cash flow creates a spread sheet of when
  payments are due and cash is received.
• This allows you to manage your cash in
  and out of the business.
Days of Sales Outstanding
• Days of Sales Outstanding (DSO)
  – This term refers to the number of days from
    invoice to collection.
  – The longer the days outstanding the slower
    the customers are paying you.
  – This needs to be monitored by someone in
    your office
Job Cost Reports
– Maintenance contractors should review
  projects on a monthly basis to determine labor
  issues.
– Materials are not as important on
  maintenance projects.
– You need to determine how detailed you want
  to be on your projects, whether it is just man
  hours or to be broken down by job function:
  such as Mowing, Pruning, Weeding??
Account Payable and Receivable
• Payables
  – What you owe the suppliers and vendors for the goods
    purchased for a project.
  – Most vendors and suppliers offer terms of net 30. Thirty days
    from date of purchase they expect payment
  – You need to develop a rolling chart of when you can make your
    payment to them, referred to as cash flow report.
  – Include such things as payroll, taxes, equipment payments
  – Knowing when and where the funds are coming from to make
    these payment is a necessary part of your business
Account Payables and Receivable
• Receivables or Aging
   – These are the payments from your customers to you-sometimes
     referred to as aging.
   – This will help determine when you can make your payments
   – Knowing how your customers pay is important to you meeting
     your obligations to your suppliers, employees and good ole
     Uncle Sam.
   – Watching this closely is a method of knowing if there may be an
     issue with a customer.
   – Most contractors will invoice net 30 or pay in 30 days
   – If you allow this number to grow from 30 days it will cost you
     money
   – It is important to get on top of these numbers and collect the
     money owned your company
Key Financial Indicators

• These Financial Indicators are important
  to managing your business and can
  provide a quick look at your business and
  tell you about your company’s
  performance.
Indicators to View Monthly
• Direct Labor
  – Labor is your largest expense in most cases
  – Create benchmarks from past years to
    compare your labor percentage to your
    current statement
  – Watch the percentage as it moves up or
    down, it is a good indicator of the health of
    your business and whether you are making a
    profit.
Indicators to View Monthly
• Material Expense
  – Materials are an expense in the Design Build
    and Bid Build world that can create large
    swings in your P&L
  – Look at this percentage number on the yearly
    average, compare to your monthly statement
  – This number can indicate whether you missed
    something in monthly invoices, or over
    expensed a budget item on a project or mis-
    coded an account for an item.
Indicators to View Monthly
• Gross Margin
  – This is direct cost minus revenue
  – Most landscape contractors are running
    between 45 % to 55% depending the mix of
    work.
Indicators to View Monthly
– Operating Profit
  • Funds remaining after all expenses are paid
  • This can range from 0% to as much as 10% or
    more for good companies
  • The average Landscape company is between 3%
    and 5%
Annual Review
• Production per hour: Revenue/Labor
  Hours
• Average job size: Revenue/ Number of
  projects per year
• Non productive Labor Hours annually
• Annual fuel budget
The Intangibles
The Intangibles
• In every business there are indicators that
  can not be measured numerically
• Customer Satisfaction: are your customers
  happy with the service?
• Employee Satisfaction: Are your
  employees happy and enjoying the work
  experience.
• Owner Satisfaction: Are you happy and
  enjoying the ownership experience.
SiteSource Business Coaching
       and Consulting
         • Richard Wilbert
  Email: sitesource@live.com
www.sitesourcebusinesscoaching.com
           303-909-0798

Key Management Indicators

  • 1.
  • 2.
    Key Management Indicatorsthat Can Help You Manage a Successful Business
  • 3.
    Goals of theWebinar • Discuss the Planning Process for your business • Discuss the Financial Reports you should be using • Drill down in the reports, what to look for in the reports • How this keeps you on track
  • 4.
  • 5.
    All Good BusinessesHave a Plan • Business Plan – Cover Sheet – Table of Contents – Executive Summary – The Company – The Market – Technology – Sales and Marketing – Management – Financials
  • 6.
    All Good BusinessesHave a Plan • Business Plan • This is a statement about the business that follows a distinct format that will be used to evaluate the business for investors, stakeholders, banks and partners. • The use of the business plan is to demonstrate to outsiders what your business is about.
  • 7.
  • 8.
    All Good BusinessesHave a Plan • Strategic Plan • A document that contains the company’s mission and vision statements, goals and objectives over a period of time and how specific individuals within the company will achieve these goals and objectives. The Strategic Plan is used to determine the use of limited resources (time, money, people and technology)
  • 9.
    All Good BusinessesHave a Plan • Strategic Plan – Vision Statement – Mission Statement – Goals – Objectives – Action Plans – Risk Analysis & Contingency Plan – Competitive Analysis – Financials
  • 10.
  • 11.
    Key Management Indicators •Key Management Indicators to help manage your business – Financial reports Chart of Accounts Budgets Profit and Loss Statement Balance Sheet Cash flow report Days of sales outstanding Job Costing reports Accounts Receivable and Payables
  • 12.
    Key Management Indicators •Chart of Accounts – A chart of accounts is a created list of the accounts used by a business to define each class of items for which money is spent or received.
  • 13.
    Key Management Indicators •Chart of Accounts – Used to organize the finances and to segregate Expenditures, Revenue, Assets, and Liabilities – List is Alpha-numeric – Arranged in order of Financial Statement – 5 digits representing Division, Department and type of Account
  • 14.
    Profit and LossStatement • A Profit and Loss Statement is sometimes called the Income Statement or the P&L • This is your Chart of Accounts with actual numbers added to the document.
  • 15.
    Profit and LossStatement • The P&L serves as the report card of your company’s performance each month. • Many software packages will compare the P&L to previous years/months, year to date and offer percentages for easy comparison of numbers.
  • 16.
    Profit and LossStatement • The P&L can lead to a number of other financial ratios such as: Return on Investment (ROI), Return on Assets (ROA) and many others that we will not discuss at this time, but be aware that these calculations are important to investors and bankers.
  • 17.
    Budget • The Budgetis your financial road map and is used to determine whether you are on track or not. – Annual budgets are spread over 12 months of the fiscal year – Based on the projected revenues of each month and business activities of each month – Example: May is most likely busier than December, your budget should reflect that activity
  • 18.
    Budget • Start bycreating a Chart of Accounts: – Most software packages will assist with the Chart of Accounts, but make it unique to your company. – PLANET has a sample Chart of Accounts in it’s publications available for you to purchase.
  • 19.
    Budget • Budget layout: – Revenues or Sales – Costs of Goods- Direct labor, Materials, – Gross Margin – Sales minus COGS – Expenses – Rent, Insurance, Office expenses – Net Margin (Profit)- Gross margin minus Expenses
  • 20.
    Budgets • Create alist of costs that you include in each account item for future reference • Once annualized, create a monthly spreadsheet based on fiscal year- 12 budgets by month • This becomes the outline for your Profit and Loss Statement or Income Statement
  • 21.
    Balance Sheet • ABalance Sheet offers a snap shot of your business on a given date and time • The Balance Sheet reflects 3 categories Assets, Liabilities and Ownership Equity in the business. • The Balance Sheet is not a tool that you will use to manage your business, but bankers and investors will be interest in this document.
  • 22.
    Cash Flow Report •Cash flow is a summary of when cash will be received in the business. • Cash flow is used to determine when suppliers and other bills can be paid by the business. • Cash flow creates a spread sheet of when payments are due and cash is received. • This allows you to manage your cash in and out of the business.
  • 23.
    Days of SalesOutstanding • Days of Sales Outstanding (DSO) – This term refers to the number of days from invoice to collection. – The longer the days outstanding the slower the customers are paying you. – This needs to be monitored by someone in your office
  • 24.
    Job Cost Reports –Maintenance contractors should review projects on a monthly basis to determine labor issues. – Materials are not as important on maintenance projects. – You need to determine how detailed you want to be on your projects, whether it is just man hours or to be broken down by job function: such as Mowing, Pruning, Weeding??
  • 25.
    Account Payable andReceivable • Payables – What you owe the suppliers and vendors for the goods purchased for a project. – Most vendors and suppliers offer terms of net 30. Thirty days from date of purchase they expect payment – You need to develop a rolling chart of when you can make your payment to them, referred to as cash flow report. – Include such things as payroll, taxes, equipment payments – Knowing when and where the funds are coming from to make these payment is a necessary part of your business
  • 26.
    Account Payables andReceivable • Receivables or Aging – These are the payments from your customers to you-sometimes referred to as aging. – This will help determine when you can make your payments – Knowing how your customers pay is important to you meeting your obligations to your suppliers, employees and good ole Uncle Sam. – Watching this closely is a method of knowing if there may be an issue with a customer. – Most contractors will invoice net 30 or pay in 30 days – If you allow this number to grow from 30 days it will cost you money – It is important to get on top of these numbers and collect the money owned your company
  • 27.
    Key Financial Indicators •These Financial Indicators are important to managing your business and can provide a quick look at your business and tell you about your company’s performance.
  • 28.
    Indicators to ViewMonthly • Direct Labor – Labor is your largest expense in most cases – Create benchmarks from past years to compare your labor percentage to your current statement – Watch the percentage as it moves up or down, it is a good indicator of the health of your business and whether you are making a profit.
  • 29.
    Indicators to ViewMonthly • Material Expense – Materials are an expense in the Design Build and Bid Build world that can create large swings in your P&L – Look at this percentage number on the yearly average, compare to your monthly statement – This number can indicate whether you missed something in monthly invoices, or over expensed a budget item on a project or mis- coded an account for an item.
  • 30.
    Indicators to ViewMonthly • Gross Margin – This is direct cost minus revenue – Most landscape contractors are running between 45 % to 55% depending the mix of work.
  • 31.
    Indicators to ViewMonthly – Operating Profit • Funds remaining after all expenses are paid • This can range from 0% to as much as 10% or more for good companies • The average Landscape company is between 3% and 5%
  • 32.
    Annual Review • Productionper hour: Revenue/Labor Hours • Average job size: Revenue/ Number of projects per year • Non productive Labor Hours annually • Annual fuel budget
  • 33.
  • 34.
    The Intangibles • Inevery business there are indicators that can not be measured numerically • Customer Satisfaction: are your customers happy with the service? • Employee Satisfaction: Are your employees happy and enjoying the work experience. • Owner Satisfaction: Are you happy and enjoying the ownership experience.
  • 35.
    SiteSource Business Coaching and Consulting • Richard Wilbert Email: sitesource@live.com www.sitesourcebusinesscoaching.com 303-909-0798