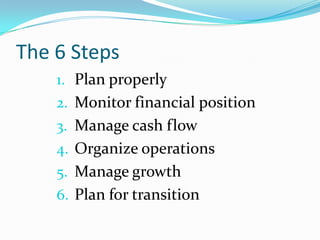
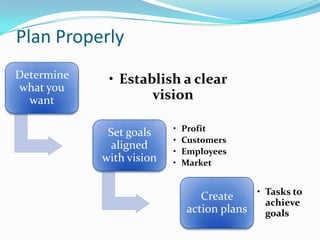
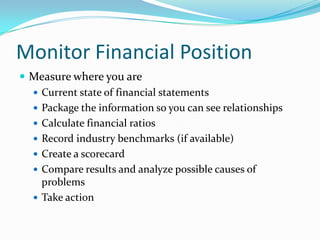
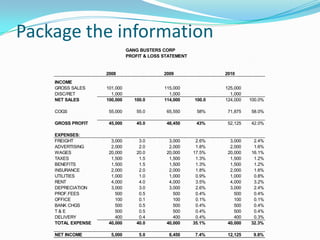
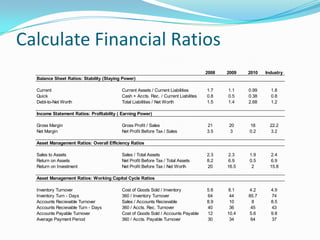
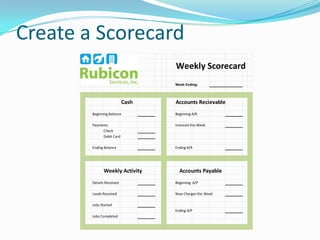
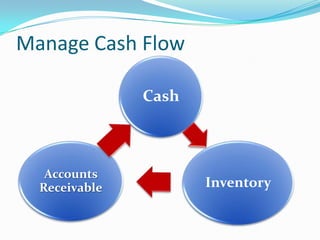
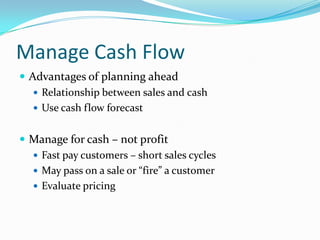
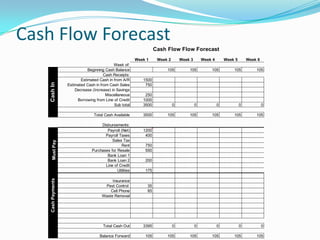
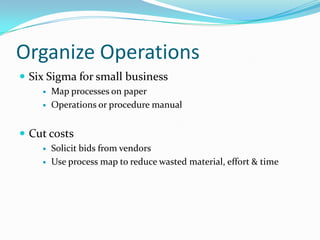
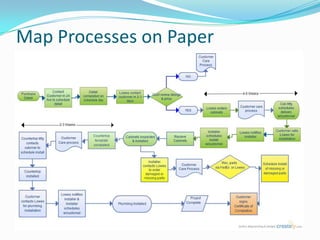
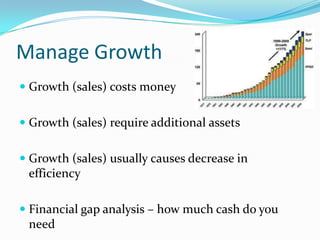
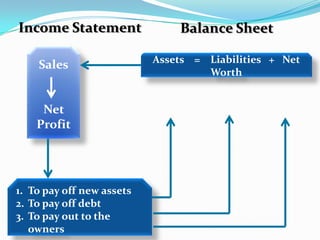
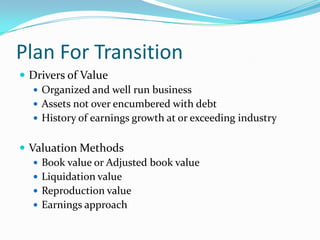
The 6 Steps
    1. Plan properly
    2. Monitor financial position
    3. Manage cash flow
    4. Organize operations
    5. Manage growth
    6. Plan for transition
What Do You Want Out of Your Business?
Most business      MORE
owners want:       SALES
                             MORE
MORE!                       PROFIT

                             MORE
      MORE                   STAFF
    CUSTOMERS
The Slippery Slope
  Too much work for the
    owner to do alone
Work gets out     Hire cheap or untrained
 of control                help
                             Customers get
                                unhappy
       Can’t make
     enough money               Can’t afford to
                                 hire better
                                   people

                Owner spends time putting
                        out fires
Owner spends time putting out
   fires & fixing problems

                        No time for marketing
      Can’t find              or sales
    time to train
       people                   Have to sell at
                                  low price
                                       No referrals or
     Can’t make enough               repeat customers
    money to cover bills or
       grow business
NOT ENOUGH
  PROFITABLE   • PERHAPS YOUR SALES SYSTEMS STINK
 CUSTOMERS?
NOT ENOUGH
               • PERHAPS YOUR CUSTOMER SERVICE
      LOYAL
                 STINKS
 CUSTOMERS?
 COMPETING
               • PERHAPS YOU’RE NOT ANY BETTER THAN
   ON PRICE
                 YOUR COMPETITION
    ALONE?
LITTLE OR NO   • PERHAPS YOUR ORGANIZATIONAL
     PROFIT?     SYSTEMS STINK
  CAN’T FIND
               • PERHAPS YOU’RE NOT A GOOD PERSON TO
  ANY GOOD
                 WORK FOR!
      HELP?
What Do You Want Out of Your Business?
I want my business to be:

1. Completely run by management team
2. Organized & Systemized
3. A great place to work that attracts the best
   employees
4. Built on satisfying loyal customers
5. Makes double the industry average profit
6. Grows my equity and wealth
7. Creates lots of freedom & fun
Plan Properly
Determine    • Establish a clear
what you
  want              vision

                          •   Profit
             Set goals
                          •   Customers
              aligned     •   Employees
            with vision   •   Market


                                            • Tasks to
                                  Create
                                              achieve
                               action plans   goals
Plan Properly
          Start the year in high gear

  Block time to think
       New product or service ideas
       New projects
       New prospects
  Innovation and adaptation
  grow a business
  Plan on paper
Plan Properly
STEP BACK & LOOK AT YOUR BUSINESS

 Time to touch your customers
   Year end is a good time to survey customers
         Service & quality feedback
         “Is there anything else you need that I can sell you?”


 Interview your employees
         Ask for suggestions to improve business
         They often have insights you don’t
Plan Properly
 Dust off the business plan

      Review and update your plan or write a
       new one
          What’s not working and how to fix it

      Make use of dates and milestones

      Growth and new projects may require
       capital – plan for it
Plan Properly
 Look for Good Guidance

       Build a Board of Advisors

       Your professional team – CPA, Attorney, Insurance

       Personal coach or mentor

       SCORE, SBDC, Chamber of Commerce
Monitor Financial Position
 Measure where you are
   Current state of financial statements
   Package the information so you can see relationships
   Calculate financial ratios
   Record industry benchmarks (if available)
   Create a scorecard
   Compare results and analyze possible causes of
    problems
   Take action
The Current State of Your Financials
  How often do you get financials? (I/S & B/S)
         Once per month
         Once per quarter
         Once per year
  How much time do you look at them?
         None
         As little as possible
         1 hour
         2 – 4 hours per month
         One day per month
  How happy are you with the
   quality of your financial statements?
Package the information
                              GANG BUSTERS CORP
                              PROFIT & LOSS STATEMENT


                    2008                    2009                2010
    INCOME
    GROSS SALES     101,000                 115,000             125,000
    DISC/RET          1,000                   1,000               1,000
    NET SALES       100,000      100.0      114,000     100.0   124,000   100.0%

    COGS             55,000       55.0       65,550      58%     71,875   58.0%

    GROSS PROFIT     45,000       45.0       48,450      43%     52,125   42.0%

    EXPENSES:
    FREIGHT           3,000        3.0        3,000      2.6%     3,000    2.4%
    ADVERTISING       2,000        2.0        2,000      1.8%     2,000    1.6%
    WAGES            20,000       20.0       20,000     17.5%    20,000   16.1%
    TAXES             1,500        1.5        1,500      1.3%     1,500    1.2%
    BENEFITS          1,500        1.5        1,500      1.3%     1,500    1.2%
    INSURANCE         2,000        2.0        2,000      1.8%     2,000    1.6%
    UTILITIES         1,000        1.0        1,000      0.9%     1,000    0.8%
    RENT              4,000        4.0        4,000      3.5%     4,000    3.2%
    DEPRECIATION      3,000        3.0        3,000      2.6%     3,000    2.4%
    PROF.FEES           500        0.5          500      0.4%       500    0.4%
    OFFICE              100        0.1          100      0.1%       100    0.1%
    BANK CHGS           500        0.5          500      0.4%       500    0.4%
    T&E                 500        0.5          500      0.4%       500    0.4%
    DELIVERY            400        0.4          400      0.4%       400    0.3%
    TOTAL EXPENSE    40,000       40.0       40,000     35.1%    40,000   32.3%

    NET INCOME        5,000        5.0        8,450     7.4%     12,125    9.8%
Calculate Financial Ratios
                                                                                    2008   2009   2010   Industry
  Balance Sheet Ratios: Stability (Staying Power)

  Current                                 Current Assets / Current Liabilities      1.7    1.1    0.99     1.8
  Quick                                   Cash + Accts. Rec. / Current Liabilites   0.8    0.5    0.38     0.8
  Debt-to-Net Worth                       Total Liabilities / Net Worth             1.5    1.4    2.68     1.2

  Income Statement Ratios: Profitability ( Earning Power)

  Gross Margin                            Gross Profit / Sales                      21     20     18       22.2
  Net Margin                              Net Profit Before Tax / Sales             3.5    3      0.2      3.2

  Asset Management Ratios: Overall Efficiency Ratios

  Sales to Assets                         Sales / Total Assets                      2.3    2.3    1.9      2.4
  Return on Assets                        Net Profit Before Tax / Total Assets      8.2    6.9    0.5      6.9
  Return on Investment                    Net Profit Before Tax / Net Worth         20     16.5    2       15.8

  Asset Management Ratios: Working Capital Cycle Ratios

  Inventory Turnover                      Cost of Goods Sold / Inventory            5.6    8.1    4.2      4.9
  Inventory Turn - Days                   360 / Inventory Turnover                  64      44    85.7     74
  Accounts Recievable Turnover            Sales / Accounts Recievable               8.9     10     8       8.5
  Accounts Recievable Turn - Days         360 / Accts. Rec. Turnover                40      36     45      43
  Accounts Payable Turnover               Cost of Goods Sold / Accounts Payable     12     10.4   5.6      9.8
  Average Payment Period                  360 / Accts. Payable Turnover             30      34     64      37
Create a Scorecard
                                   Weekly Scorecard
                                   Week Ending:


                            Cash   Accounts Recievable
        Beginning Balance          Beginning A/R

        Payments                   Invoiced this Week
             Check
             Debit Card

        Ending Balance             Ending A/R


              Weekly Activity        Accounts Payable
        Details Received           Beginning A/P

        Leads Received             New Charges this Week

        Jobs Started
                                   Ending A/P
        Jobs Completed
Manage Cash Flow

               Cash


   Accounts
  Receivable          Inventory
Manage Cash Flow
 Advantages of planning ahead
    Relationship between sales and cash
    Use cash flow forecast


 Manage for cash – not profit
   Fast pay customers – short sales cycles
   May pass on a sale or “fire” a customer
   Evaluate pricing
Cash Flow Forecast
                                                                     Cash Flow Flow Forecast
                                                           Week 1     Week 2       Week 3       Week 4       Week 5       Week 6
                                             Week of:
                               Beginning Cash Balance                     105          105          105          105          105
                                        Cash Receipts:
                           Estimated Cash in from A/R         1500
    Cash In


                    Estimated Cash in from Cash Sales          750
                        Decrease (Increase) in Savings
                                         Miscellaneous         250
                         Borrowing from Line of Credit        1000
                                              Sub total       3500             0            0            0            0            0

                                  Total Cash Available        3500        105          105          105          105          105

                                      Disbursements:
                                         Payroll (Net)        1200
                                        Payroll Taxes          400
                                            Sales Tax
       Must Pay


                                                  Rent         750
                                 Purchases for Resale          550
                                         Bank Loan 1
                                         Bank Loan 2           200
                                        Line of Credit
                                               Utilities       175
    Cash Payments


                                            Insurance
                                        Pest Control            35
                                           Cell Phone           85
                                       Waste Removal


                                        Total Cash Out        3395             0            0            0            0            0

                                      Balance Forward          105        105          105          105          105          105
Organize Operations
 Six Sigma for small business
       Map processes on paper
       Operations or procedure manual


 Cut costs
       Solicit bids from vendors
       Use process map to reduce wasted material, effort & time
Map Processes on Paper
Manage Growth
 Growth (sales) costs money


 Growth (sales) require additional assets


 Growth (sales) usually causes decrease in
  efficiency

 Financial gap analysis – how much cash do you
  need
Income Statement               Balance Sheet

                           Assets = Liabilities + Net
    Sales
                                    Worth


     Net
    Profit


1. To pay off new assets
2. To pay off debt
3. To pay out to the
   owners
Plan For Transition
 Drivers of Value
   Organized and well run business
   Assets not over encumbered with debt
   History of earnings growth at or exceeding industry


 Valuation Methods
    Book value or Adjusted book value
    Liquidation value
    Reproduction value
    Earnings approach
QUESTIONS?
        David Oetken, MBA
 Small Business Development Center
   2800 West Broadway Suite 315
         Louisville, KY 40211
            502-594-3871

2011_Replanning_Your Business

  • 2.
    The 6 Steps 1. Plan properly 2. Monitor financial position 3. Manage cash flow 4. Organize operations 5. Manage growth 6. Plan for transition
  • 3.
    What Do YouWant Out of Your Business? Most business MORE owners want: SALES MORE MORE! PROFIT MORE MORE STAFF CUSTOMERS
  • 4.
    The Slippery Slope Too much work for the owner to do alone Work gets out Hire cheap or untrained of control help Customers get unhappy Can’t make enough money Can’t afford to hire better people Owner spends time putting out fires
  • 5.
    Owner spends timeputting out fires & fixing problems No time for marketing Can’t find or sales time to train people Have to sell at low price No referrals or Can’t make enough repeat customers money to cover bills or grow business
  • 6.
    NOT ENOUGH PROFITABLE • PERHAPS YOUR SALES SYSTEMS STINK CUSTOMERS? NOT ENOUGH • PERHAPS YOUR CUSTOMER SERVICE LOYAL STINKS CUSTOMERS? COMPETING • PERHAPS YOU’RE NOT ANY BETTER THAN ON PRICE YOUR COMPETITION ALONE? LITTLE OR NO • PERHAPS YOUR ORGANIZATIONAL PROFIT? SYSTEMS STINK CAN’T FIND • PERHAPS YOU’RE NOT A GOOD PERSON TO ANY GOOD WORK FOR! HELP?
  • 7.
    What Do YouWant Out of Your Business? I want my business to be: 1. Completely run by management team 2. Organized & Systemized 3. A great place to work that attracts the best employees 4. Built on satisfying loyal customers 5. Makes double the industry average profit 6. Grows my equity and wealth 7. Creates lots of freedom & fun
  • 8.
    Plan Properly Determine • Establish a clear what you want vision • Profit Set goals • Customers aligned • Employees with vision • Market • Tasks to Create achieve action plans goals
  • 9.
    Plan Properly Start the year in high gear  Block time to think  New product or service ideas  New projects  New prospects  Innovation and adaptation grow a business  Plan on paper
  • 10.
    Plan Properly STEP BACK& LOOK AT YOUR BUSINESS  Time to touch your customers  Year end is a good time to survey customers  Service & quality feedback  “Is there anything else you need that I can sell you?”  Interview your employees  Ask for suggestions to improve business  They often have insights you don’t
  • 11.
    Plan Properly  Dustoff the business plan  Review and update your plan or write a new one  What’s not working and how to fix it  Make use of dates and milestones  Growth and new projects may require capital – plan for it
  • 12.
    Plan Properly  Lookfor Good Guidance  Build a Board of Advisors  Your professional team – CPA, Attorney, Insurance  Personal coach or mentor  SCORE, SBDC, Chamber of Commerce
  • 13.
    Monitor Financial Position Measure where you are  Current state of financial statements  Package the information so you can see relationships  Calculate financial ratios  Record industry benchmarks (if available)  Create a scorecard  Compare results and analyze possible causes of problems  Take action
  • 14.
    The Current Stateof Your Financials  How often do you get financials? (I/S & B/S)  Once per month  Once per quarter  Once per year  How much time do you look at them?  None  As little as possible  1 hour  2 – 4 hours per month  One day per month  How happy are you with the quality of your financial statements?
  • 15.
    Package the information GANG BUSTERS CORP PROFIT & LOSS STATEMENT 2008 2009 2010 INCOME GROSS SALES 101,000 115,000 125,000 DISC/RET 1,000 1,000 1,000 NET SALES 100,000 100.0 114,000 100.0 124,000 100.0% COGS 55,000 55.0 65,550 58% 71,875 58.0% GROSS PROFIT 45,000 45.0 48,450 43% 52,125 42.0% EXPENSES: FREIGHT 3,000 3.0 3,000 2.6% 3,000 2.4% ADVERTISING 2,000 2.0 2,000 1.8% 2,000 1.6% WAGES 20,000 20.0 20,000 17.5% 20,000 16.1% TAXES 1,500 1.5 1,500 1.3% 1,500 1.2% BENEFITS 1,500 1.5 1,500 1.3% 1,500 1.2% INSURANCE 2,000 2.0 2,000 1.8% 2,000 1.6% UTILITIES 1,000 1.0 1,000 0.9% 1,000 0.8% RENT 4,000 4.0 4,000 3.5% 4,000 3.2% DEPRECIATION 3,000 3.0 3,000 2.6% 3,000 2.4% PROF.FEES 500 0.5 500 0.4% 500 0.4% OFFICE 100 0.1 100 0.1% 100 0.1% BANK CHGS 500 0.5 500 0.4% 500 0.4% T&E 500 0.5 500 0.4% 500 0.4% DELIVERY 400 0.4 400 0.4% 400 0.3% TOTAL EXPENSE 40,000 40.0 40,000 35.1% 40,000 32.3% NET INCOME 5,000 5.0 8,450 7.4% 12,125 9.8%
  • 16.
    Calculate Financial Ratios 2008 2009 2010 Industry Balance Sheet Ratios: Stability (Staying Power) Current Current Assets / Current Liabilities 1.7 1.1 0.99 1.8 Quick Cash + Accts. Rec. / Current Liabilites 0.8 0.5 0.38 0.8 Debt-to-Net Worth Total Liabilities / Net Worth 1.5 1.4 2.68 1.2 Income Statement Ratios: Profitability ( Earning Power) Gross Margin Gross Profit / Sales 21 20 18 22.2 Net Margin Net Profit Before Tax / Sales 3.5 3 0.2 3.2 Asset Management Ratios: Overall Efficiency Ratios Sales to Assets Sales / Total Assets 2.3 2.3 1.9 2.4 Return on Assets Net Profit Before Tax / Total Assets 8.2 6.9 0.5 6.9 Return on Investment Net Profit Before Tax / Net Worth 20 16.5 2 15.8 Asset Management Ratios: Working Capital Cycle Ratios Inventory Turnover Cost of Goods Sold / Inventory 5.6 8.1 4.2 4.9 Inventory Turn - Days 360 / Inventory Turnover 64 44 85.7 74 Accounts Recievable Turnover Sales / Accounts Recievable 8.9 10 8 8.5 Accounts Recievable Turn - Days 360 / Accts. Rec. Turnover 40 36 45 43 Accounts Payable Turnover Cost of Goods Sold / Accounts Payable 12 10.4 5.6 9.8 Average Payment Period 360 / Accts. Payable Turnover 30 34 64 37
  • 17.
    Create a Scorecard Weekly Scorecard Week Ending: Cash Accounts Recievable Beginning Balance Beginning A/R Payments Invoiced this Week Check Debit Card Ending Balance Ending A/R Weekly Activity Accounts Payable Details Received Beginning A/P Leads Received New Charges this Week Jobs Started Ending A/P Jobs Completed
  • 18.
    Manage Cash Flow Cash Accounts Receivable Inventory
  • 19.
    Manage Cash Flow Advantages of planning ahead  Relationship between sales and cash  Use cash flow forecast  Manage for cash – not profit  Fast pay customers – short sales cycles  May pass on a sale or “fire” a customer  Evaluate pricing
  • 20.
    Cash Flow Forecast Cash Flow Flow Forecast Week 1 Week 2 Week 3 Week 4 Week 5 Week 6 Week of: Beginning Cash Balance 105 105 105 105 105 Cash Receipts: Estimated Cash in from A/R 1500 Cash In Estimated Cash in from Cash Sales 750 Decrease (Increase) in Savings Miscellaneous 250 Borrowing from Line of Credit 1000 Sub total 3500 0 0 0 0 0 Total Cash Available 3500 105 105 105 105 105 Disbursements: Payroll (Net) 1200 Payroll Taxes 400 Sales Tax Must Pay Rent 750 Purchases for Resale 550 Bank Loan 1 Bank Loan 2 200 Line of Credit Utilities 175 Cash Payments Insurance Pest Control 35 Cell Phone 85 Waste Removal Total Cash Out 3395 0 0 0 0 0 Balance Forward 105 105 105 105 105 105
  • 21.
    Organize Operations  SixSigma for small business  Map processes on paper  Operations or procedure manual  Cut costs  Solicit bids from vendors  Use process map to reduce wasted material, effort & time
  • 22.
  • 23.
    Manage Growth  Growth(sales) costs money  Growth (sales) require additional assets  Growth (sales) usually causes decrease in efficiency  Financial gap analysis – how much cash do you need
  • 24.
    Income Statement Balance Sheet Assets = Liabilities + Net Sales Worth Net Profit 1. To pay off new assets 2. To pay off debt 3. To pay out to the owners
  • 25.
    Plan For Transition Drivers of Value  Organized and well run business  Assets not over encumbered with debt  History of earnings growth at or exceeding industry  Valuation Methods  Book value or Adjusted book value  Liquidation value  Reproduction value  Earnings approach
  • 26.
    QUESTIONS? David Oetken, MBA Small Business Development Center 2800 West Broadway Suite 315 Louisville, KY 40211 502-594-3871

Editor's Notes

  • #4 When more is your goal you just get busier and more unhappyStressed and feeling out of controlChase bad business and say yes to bad offers, keep bad employees, become blind to the bad reality of your situationBelieve in magic: elusive big client – perfect manager – magical solutionVacation home with architect storyHe asks “what do you want” – size , layout, finishes