Download to read offline
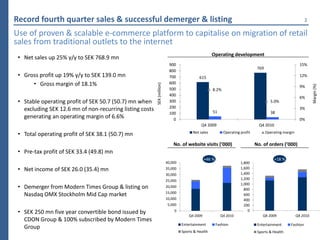
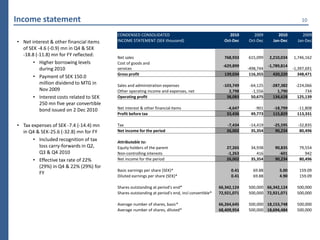

1) CDON Group reported record fourth quarter sales and a successful demerger and listing on the Nasdaq OMX Stockholm exchange. 2) Net sales increased 25% year-over-year to SEK 768.9 million in Q4 and 27% to SEK 2,210.0 million for the full year. 3) Operating profit was SEK 38.1 million in Q4 and SEK 134.6 million for the full year, reflecting stable profits and healthy growth across all business segments.


